. 2024 May 8;4(5):100557.
doi: 10.1016/j.xgen.2024.100557.

The landscape of cancer-rewired GPCR signaling axes

Affiliations

The landscape of cancer-rewired GPCR signaling axes

Chakit Arora et al. Cell Genom. .

Abstract

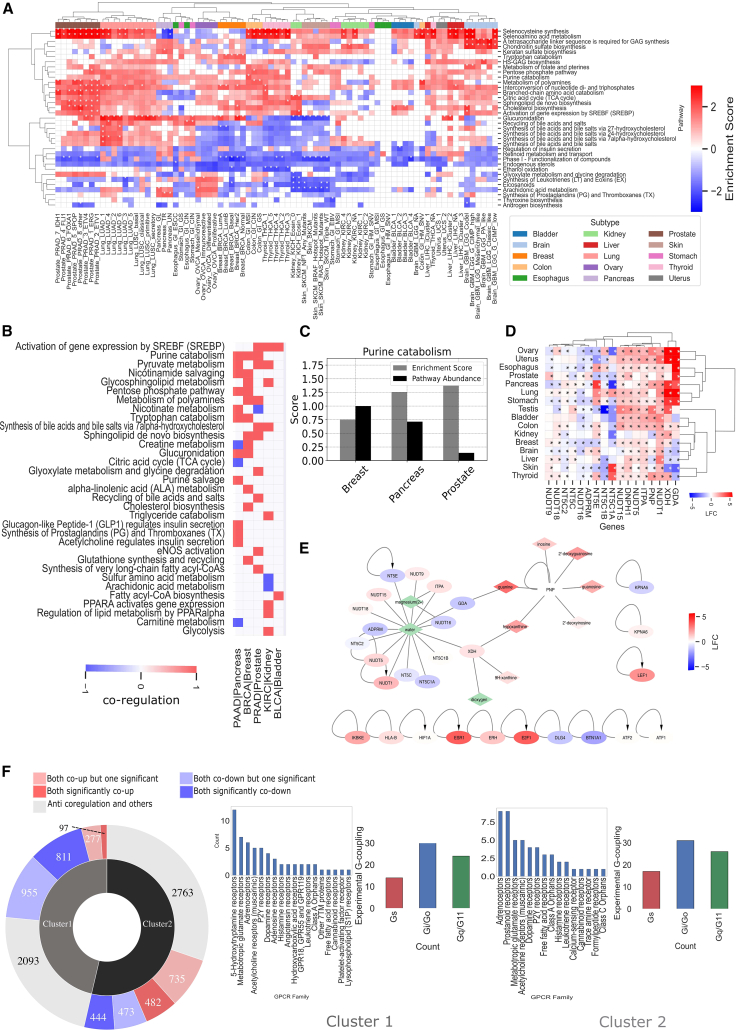
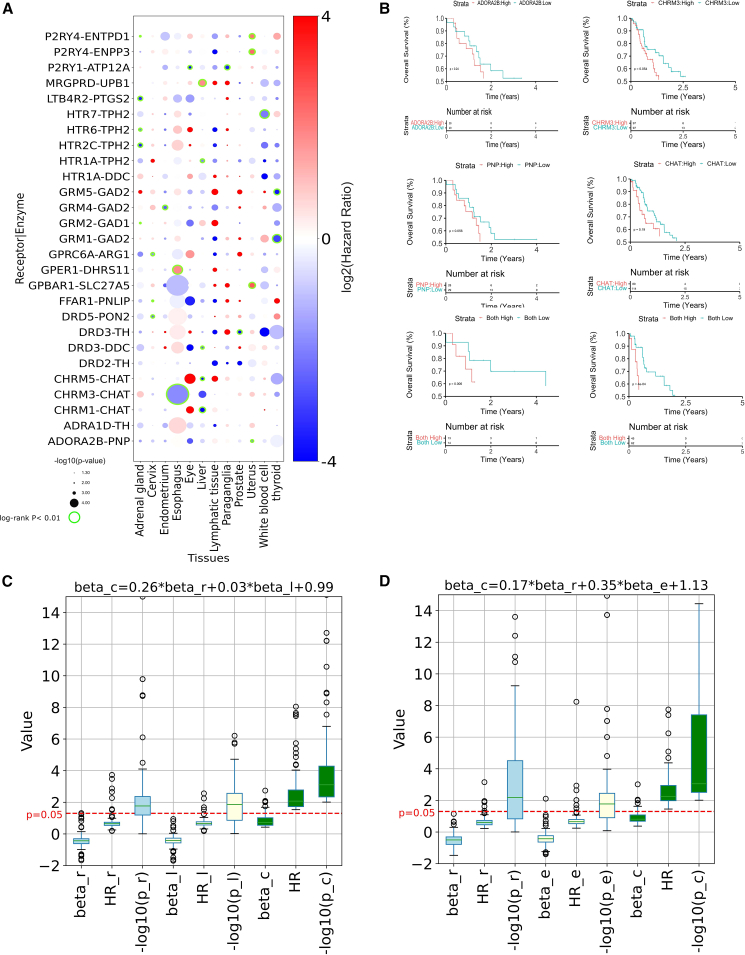
We explored the dysregulation of G-protein-coupled receptor (GPCR) ligand systems in cancer transcriptomics datasets to uncover new therapeutics opportunities in oncology. We derived an interaction network of receptors with ligands and their biosynthetic enzymes. Multiple GPCRs are differentially regulated together with their upstream partners across cancer subtypes and are associated to specific transcriptional programs and to patient survival patterns. The expression of both receptor-ligand (or enzymes) partners improved patient stratification, suggesting a synergistic role for the activation of GPCR networks in modulating cancer phenotypes. Remarkably, we identified many such axes across several cancer molecular subtypes, including many involving receptor-biosynthetic enzymes for neurotransmitters. We found that GPCRs from these actionable axes, including, e.g., muscarinic, adenosine, 5-hydroxytryptamine, and chemokine receptors, are the targets of multiple drugs displaying anti-growth effects in large-scale, cancer cell drug screens, which we further validated. We have made the results generated in this study freely available through a webapp (gpcrcanceraxes.bioinfolab.sns.it).

Keywords: GPCR; cancer; cancer cell lines; cell-cell communication; drug repurposing; personalized medicine; signaling network; survival analysis; transcriptomics.


Conflict of interest statement

Declaration of interests J.S.G. reports consulting fees from Domain Pharmaceuticals, Pangea Therapeutics, and io9 and is founder of Kadima Pharmaceuticals, all unrelated to the current study.

Figures

None
Graphical abstract
Figure 1
Figure 1
GPCR extracellular signaling network and overview of the datasets considered (A) Workflow of the study involving the procedure to generate the interacting enzyme-receptor pairs (left center) to generate the GPCR-ligand-enzyme extended network (center), the dataset employed (left top and bottom) to perform the DE and survival analysis (center top and bottom) and subsequently the downstream analysis steps (right). (B) Sunburst charts providing an overview of the number of liganded and orphan G-protein-coupled receptors (GPCRs) considered; classification of the liganded GPCRs based on their ligand type, i.e., either peptide, organic, or a combination of both; number of enzymes that are either currently included or absent within the Reactome pathways. The included ligands are additionally subcategorized based on the frequency of their types and the frequency of the Reactome pathway domains with which they are linked. For enzymes, only the second layer of this information is shown. (C) The network of GPCRs and cognate ligands and biosynthetic enzymes. (D) Funnel plot exhibiting the frequency of differentially expressed (TCGA vs. GTEx, BH-corrected adjusted p <0.01) GPCRs, ligands, and enzymes corresponding to each whole tissue. (E) Stacked bar plot displaying the number of significantly enriched ligand-associated pathways within Reactome sub-domains: signaling (R-HSA-372790: signaling by GPCR) and metabolism (R-HSA-1430728:metabolism). Each bar represents the relative proportions of different categories as percentages of the whole, with respect to each tissue. An enriched pathway refers to a pathway enriched in TCGA with a GSEA enrichment score >0 and BH-corrected adjusted p <0.01. (F) The bar plot illustrates the top 30 enriched transcription factors, with the y axis representing the transcription factors and the x axis indicating the count of subtypes in which they are enriched.
Figure 2
Figure 2
Peptide ligand-receptor co-regulation (A) Heatmap (center panel) displaying the co-differential regulation for receptor-ligand pairs across different TCGA subtypes (color coded at the top row). Darker red represents both receptor and ligand significantly co-upregulated in TCGA (i.e., log2-fold change, LFC > 1 and adjusted p <0.01) and darker blue represents both receptor and ligand significantly co-downregulated in TCGA (i.e., LFC < 1 and adjusted p <0.01). Paler colors represent either the receptor or ligand as significantly differentially expressed (i.e., |LFC| > 1 for both but adjusted p < 0.01 for only one of these). White cells indicate anti-regulation or no fold change at all in at least one of them. Only those pairs that are affected in at least 25% of TCGA subtypes are displayed. A dashed line separating the two clusters, created using Hierarchical clustering, is shown in the middle. Hierarchical clustering was performed using the Ward method to identify two homogeneous clusters by minimizing within-cluster variance based on the sum of squared differences of feature values; i.e., scores∈[−2, + 2] assigned to each pair. Heatmap (left panel) uses color codes to display the ligand’s mechanism of action in “Action,” G-protein coupling associated with the GPCRs, and GPCR family. Heatmap (right panel) displays the information contained in the left panel as concise bar plots for each of the two clusters. For each cluster, bar plots indicate G-protein coupling preferences as well as GPCR families represented as count of the number of receptors. (B) The scatterplot displays a GPCR-centric view of the heatmap in (A) based on tissue-wise or ligand-wise similarity. Here, ligand-wise similarity for each GPCR is the average of the pairwise Euclidean distances between co-differential expression (co-DE) profiles across its ligands (i.e., vertically), while tissue-wise similarity is a similar metric across tissues (i.e., horizontally). The size of the markers is proportional to the number of ligands, and the colors correspond to the average difference in the number of co-up and co-down profiles. GPCRs located in the top-right corner are more diverse in terms of their ligand interactions. (C) Diverse co-DE profiles are observed with respect to different ligands and tissues corresponding to the same GPCR. For example, CXCR3 and its corresponding ligands exhibit an almost exclusively co-upregulated profile irrespective of tissue type, while CALCRL and its ligands display varied co-regulation profiles, implying a varying interaction with its ligands in different tissue (or cancer) types. (D) The bar plot visually presents the ranking of oncogenes based on the average count of co-regulated GPCR-ligand instances across subtypes. The x axis denotes individual oncogenes/tumor suppressor genes (TSGs), color-coded separately for clarity, while the y axis represents the corresponding average count.
Figure 3
Figure 3
Biosynthetic pathway enrichment (A) Heatmap of GSEA pathway enrichment analysis for differentially expressed genes in cancer (TCGA) over normal (GTEx) samples, considering Reactome pathways related to signaling and metabolism. Red cells indicate pathways enriched in TCGA, blue cells indicate pathways enriched in GTEx, and white cells indicate no enrichment. Cells marked with an asterisk (∗) correspond to a statistically significant enrichment (adjusted p <0.01). (B) Concordant pathway enrichment analysis considering both differentially expressed genes (enrichment score [ES]) and metabolites (pathway abundance score [PAS]). A score of 1 (red) indicates co enrichment in cancer (ES and PAS >0), and a score of −1 (blue) indicates co enrichment in normal samples (ES and PAS <0). (C) Bar plot displaying numerical values for ES and PAS for the purine catabolism pathway in three different tissues: breast, bladder, and prostate. (D) Heatmap of differentially expressed genes for the purine catabolism pathway in breast cancer. Red cells indicate upregulated genes in TCGA, blue cells indicate downregulated genes in TCGA, and cells marked with an asterisk (∗) correspond to a statistically significant DE (adjusted p <0.01). (E) A functional interaction network between genes (ovals) and metabolites (diamonds) in the purine catabolism pathway in breast cancer. Red nodes indicate upregulated components, blue nodes indicate downregulated components, and green nodes indicate no information available. The network shows that over-activation of the pathway is contributed by over-expression of both genes and metabolites. (F) Sunburst chart (left panel) displaying the distribution of co-differentially regulated receptor-enzyme pairs across two different clusters similar to receptor-ligand co-regulation analysis (Figure S7). Darker red represents the number of receptor-enzyme pairs significantly co-up regulated in TCGA (i.e., LFC > 1 and adjusted p <0.01) and darker blue represents the number of receptor-enzyme pairs co-downregulated in TCGA (i.e., LFC < 1 and adjusted p <0.01). Paler colors represent the number of pairs wherein either the receptor or enzyme is significantly differentially expressed (i.e., |LFC| > 1 for both but adjusted p <0.01 for only one of these). Gray indicates pairs with anti-regulation or no fold change at all in at least one of them. Only those pairs that are affected in at least 25% of TCGA subtypes are utilized for the clustering. For each cluster, bar plots (center and right) indicate G-protein coupling preferences as well as GPCR families represented as count of the number of receptors.
Figure 4
Figure 4
Association of GPCR-peptide ligands axes to survival (A) Survival association of GPCR components in various cancer types. The funnel plot shows the number of significant instances of individual components, such as receptors, ligands, and enzymes, whose expression values are associated with patient survival across various cancer types. A total of 302 unique significant receptor instances (log rank p <0.05, FDR < 0.1) were identified in 11 cancer tissues, 103 ligands in 10 cancers, and 71 enzymes in 10 cancers. (B) Scatterplots for individual receptor instances, enzymes, and ligands associated with patient survival in various cancer types. (log rank p <0.05, FDR < 0.1). The x axis displays the number of tissues in which the genes are associated with lower survival (inverted blue triangles) and, vice versa, y axis displays the number of tissues in which the genes are associated with higher survival (red triangles). Only the genes that are significantly associated with survival in at least two tissues are shown. (C) The bubble plot shows the correlation between the combined expression levels of GPCR-ligand pairs and patient survival across various cancer types. The pairs with a log rank p < 0.05 and also lower than log rank p values for individual GPCR/ligand are displayed. Bubble color is proportional to HR; i.e., HR > 1, high expression is correlated with high survival (red); HR < 1, high expression is correlated with poor survival (blue). Bubble diameters are proportional to the −log10(log rank p value). Green highlighted bubbles represent the most significant instances (sample sizes >5, FDR < 0.1). (D) The expression values for the CALCR-CALCB axes in breast cancer (right) and corresponding Kaplan-Meier (KM) curve for survival analysis of patients stratified based on the individual as well as combined receptor/ligand expression. (E) Scatterplot showing with differentially co-expressed GPCR-ligand pairs (upper triangle, co-upregulation; lower triangle, co-downregulation) that were significantly associated with patient survival (red, higher survival; blue, lower survival). A total of 24 receptor-ligand pairs from 15 cancer subtypes were identified. Reported p values inside KM plots have been obtained through the log rank test.
Figure 5
Figure 5
Association of GPCR-enzymes axes to survival (A) The bubble plot shows the correlation between the combined expression levels of GPCR-enzyme pairs and patient survival across various cancer types. The pairs with a log rank p < 0.05 and also lower than log rank p values for individual GPCR/enzyme are displayed. Further, the pairs with rate-limiting enzymes having less than 100 PubMed references are not shown. Bubble color is proportional to HR; i.e., HR > 1, high expression is correlated with high survival (red); HR < 1, high expression is correlated with poor survival (blue). Bubble diameters are proportional to the −log(log rank p value). Green highlighted bubbles represent the most significant instances (sample sizes >5, FDR < 0.1). (B) The CHRM3-CHAT axis is recurrently correlated with lower survival rates in esophageal cancer. The KM plots (left) display the risk enhancement achieved when CHRM3-CHAT combined stratification was applied as compared to individual CHRM3/CHAT as evident by log rank p values. Similarly, the ADORA2B-PNP axis is also consistently associated with lower survival rates in uterine cancer, as evident from the KM plot on the right. Reported p values inside KM plots have been obtained through the log rank test. (C and D) The boxplot visualizes the results of the receptor-ligand (C) and receptor-enzyme (D) combinatorial Cox proportional hazards (PH) analysis. Each of the nine boxes on the x axis represents distinct parameters, including Cox PH regression coefficients for individual receptor (β_r), ligand (β_l), or enzyme (β_e), and their combinatorial effect (β_c). Additionally, hazard ratios (HRs) and −log10(p values) for each component are depicted. The red horizontal line at 1.3 serves as the −log10 transformed significance cutoff (log rank p < 0.05) for model selection. The multiple linear regression equation (β_c = f(β_r, β_l, or β_e)) above the plot reflects the relationship between individual and combinatorial regression coefficients. Medians and error bars provide a comprehensive overview of the statistical significance and impact on survival across various cancer datasets.
Figure 6
Figure 6
GPCR ligands with cancer cell line growth-inhibitory capacity (A) The scatterplot displays 52 GPCR ligands that were tested in 578 cell lines in PRISM drug repurposing resource. Thirteen GPCR ligands (in red) were found to significantly inhibit the growth of cancer cell lines (correlation > 0.2, bimodality coefficient >0.35). (B) Venn diagram showing the overlap of GPCRs in the target proteins of these 13 ligands with the pooled list of GPCRs that were found to mediate survival-associated GPCR-ligand/GPCR-enzyme axes. (C) The heatmap displays the 13 shortlisted ligands and their corresponding GPCR targets. The targets marked with asterisks (∗) are the GPCRs overlapping with significant axes. Heatmap also displays the overall action mode of ligand, more detailed mechanism of action (MOA), and G-protein coupling associated with the GPCR. (D) Stacked bar plot of top 10 MOAs involving the top 10 GPCR drug with the highest growth inhibition potential (ranked according to the negative of the log2FC in each cell line). Each stack is proportional to the number of cell lines of a given tissue where a drug belonging to that MOA is ranked among the top 10 inhibiting drugs. Stack coloring is tissue specific. (E) Stacked bar plot, normalized for the total cell line-drug pairs count, of top 10 drug targets hit by the top 10 GPCR drug with the highest growth inhibition potential (ranked according to the negative of the log2FC in each cell line). Each stack is proportional to the number of cell lines of a given tissue where a drug hitting the specific target is ranked among the top 10 inhibiting drugs. Stack coloring is tissue specific. (F) Graph showing viability changes in HEPG2 cells following treatment with MRS1220 and CGS15943, normalized to non-treated cells. To assess the statistical significance of the difference in the mean of the non-treated and treated cells, pairwise Wilcoxon test was used (non-significant, p > 0.05; ∗p ≤ 0.05; ∗∗p ≤ 0.01; ∗∗∗p ≤ 0.001). (G) Dose-response curve depicts the corresponding response of the HEPG2 cell line to the drugs and the calculated log10 of EC50. The error bars indicate the standard error of the mean.

Update of

References

    1. Pierce K.L., Premont R.T., Lefkowitz R.J. Seven-transmembrane receptors. Nat. Rev. Mol. Cell Biol. 2002;3:639–650. doi: 10.1038/nrm908. - DOI - PubMed
    1. Oldham W.M., Hamm H.E. Heterotrimeric G protein activation by G-protein-coupled receptors. Nat. Rev. Mol. Cell Biol. 2008;9:60–71. doi: 10.1038/nrm2299. - DOI - PubMed
    1. Wootten D., Christopoulos A., Marti-Solano M., Babu M.M., Sexton P.M. Mechanisms of signalling and biased agonism in G protein-coupled receptors. Nat. Rev. Mol. Cell Biol. 2018;19:638–653. doi: 10.1038/s41580-018-0049-3. - DOI - PubMed
    1. de Mendoza A., Sebé-Pedrós A., Ruiz-Trillo I. The evolution of the GPCR signaling system in eukaryotes: modularity, conservation, and the transition to metazoan multicellularity. Genome Biol. Evol. 2014;6:606–619. doi: 10.1093/GBE/EVU038. - DOI - PMC - PubMed
    1. Flock T., Hauser A.S., Lund N., Gloriam D.E., Balaji S., Babu M.M. Selectivity determinants of GPCR-G-protein binding. Nature. 2017;545:317–322. doi: 10.1038/nature22070. - DOI - PMC - PubMed

Publication types