. 2024 May 21;5(5):101550.
doi: 10.1016/j.xcrm.2024.101550. Epub 2024 May 8.

Chemoradiotherapy-induced ACKR2+ tumor cells drive CD8+ T cell senescence and cervical cancer recurrence

Affiliations

Chemoradiotherapy-induced ACKR2+ tumor cells drive CD8+ T cell senescence and cervical cancer recurrence

Dongfang Dai et al. Cell Rep Med. .

Abstract

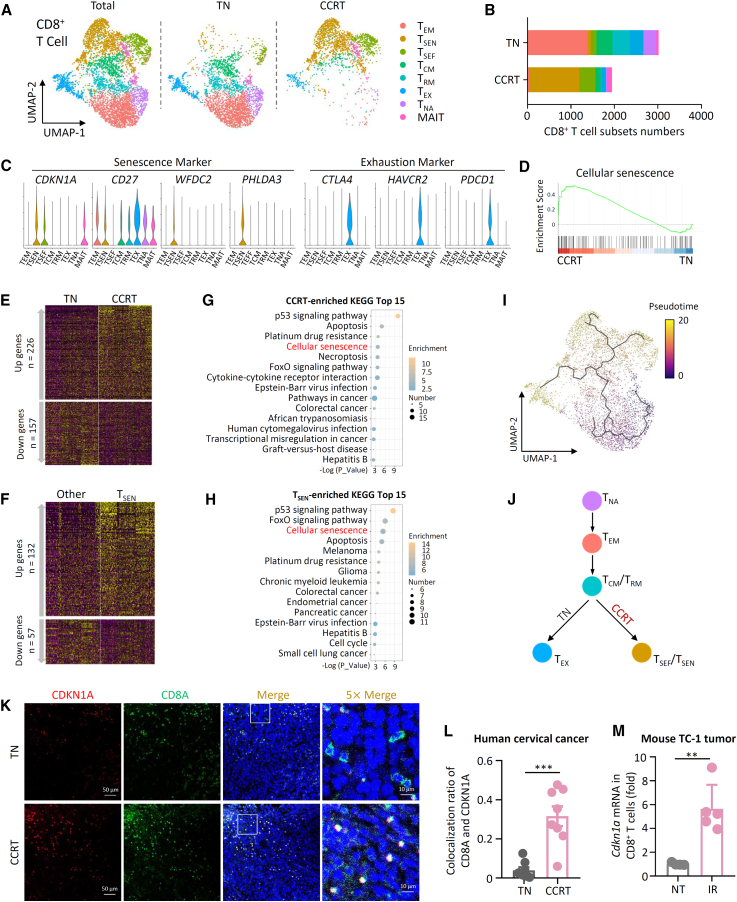
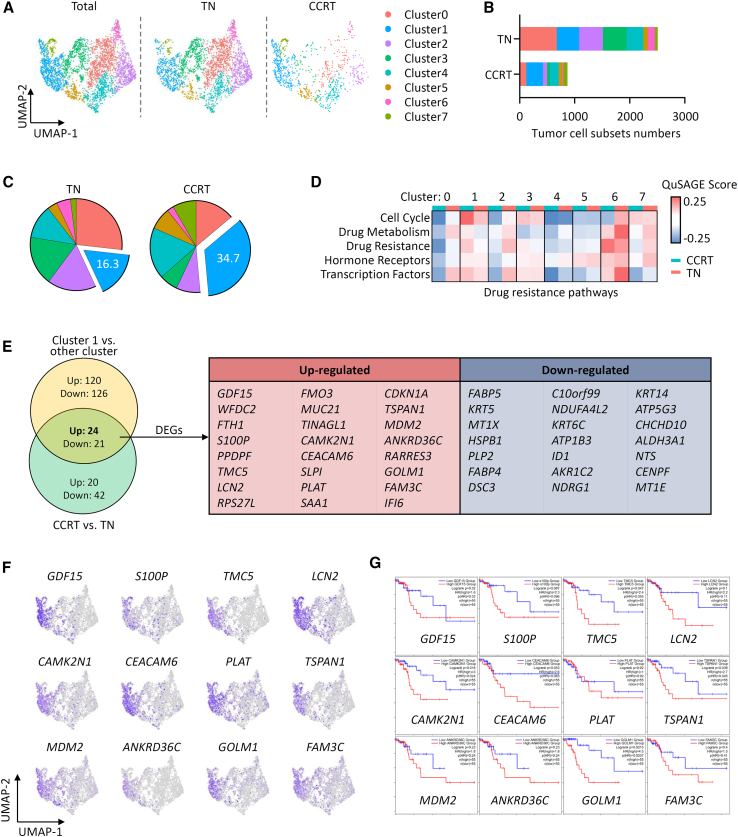
Tumor recurrence after chemoradiotherapy is challenging to overcome, and approaches to predict the recurrence remain elusive. Here, human cervical cancer tissues before and after concurrent chemoradiotherapy (CCRT) analyzed by single-cell RNA sequencing reveal that CCRT specifically promotes CD8+ T cell senescence, driven by atypical chemokine receptor 2 (ACKR2)+ CCRT-resistant tumor cells. Mechanistically, ACKR2 expression is increased in response to CCRT and is also upregulated through the ligation of CC chemokines that are produced by activated myeloid and T cells. Subsequently, ACKR2+ tumor cells are induced to produce transforming growth factor β to drive CD8+ T cell senescence, thereby compromising antitumor immunity. Moreover, retrospective analysis reveals that ACKR2 expression and CD8+ T cell senescence are enhanced in patients with cervical cancer who experienced recurrence after CCRT, indicating poor prognosis. Overall, we identify a subpopulation of CCRT-resistant ACKR2+ tumor cells driving CD8+ T cell senescence and tumor recurrence and highlight the prognostic value of ACKR2 and CD8+ T cell senescence for chemoradiotherapy recurrence.

Keywords: ACKR2; CD8(+) T cell senescence; cervical cancer; single-cell RNA sequencing; tumor recurrence.


Conflict of interest statement

Declaration of interests The authors declare no competing interests.

Figures

None
Graphical abstract
Figure 1
Figure 1
Characterization of cellular landscape in human cervical cancer before and after CCRT (A) Workflow for scRNA-seq of TN and CCRT tumor samples from patients with cervical cancer. (B) UMAP plots of single cells identified in cervical cancer tissue. (C) Heatmap of marker genes of different cell types of the scRNA-seq data. (D) Distribution of cell populations in individual samples of patients with cervical cancer. (E and F) Multiplexed immunofluorescence (mIF) of immune cell markers (E) or tumor marker pan-CK (F) in cervical carcinoma tissues from the TN and CCRT patients. Scale bar, 100 μm. (G) Statistical analysis of the percentages and absolute numbers of immune cell populations in cervical carcinoma tissues from the TN and CCRT patients (n = 5–8 for each group). TC, T cell; Ma, macrophage; NK, NK cell; BC, B cell. For (G), data are mean ± SEM. Unpaired two-tailed t tests were performed. ∗p < 0.05. See also Figure S1.
Figure 2
Figure 2
CCRT specifically drives CD8+ T cell senescence in the TME (A) UMAP plots of CD8+ T cells from TN and CCRT groups. (B) Distribution and cell numbers of CD8+ T cell subpopulations of TN and CCRT cervical tumors. (C) Violin plots showing the senescence- and exhaustion-related marker genes’ expression in CD8+ T cell subpopulations. (D) Gene set enrichment analysis of cellular senescence pathway of CD8+ T cells in TN and CCRT groups. (E and F) Heatmap of DEGs in CD8+ T cells of CCRT versus TN (E) and DEGs in TSEN versus other CD8+ T cell subpopulations (F). (G and H) KEGG analysis of the enriched top 15 pathways in CD8+ T cells after CCRT (G) and the enriched top 15 pathway in TSEN subpopulations (H). (I and J) Pseudotime and the proposed scheme of cell trajectory of CD8+ T cell subpopulations. (K and L) IF and statistical analysis of CD8A and CDKN1A colocalization in human TN and CCRT tumors. Scale bar, 50 μm. (M) qPCR of Cdkn1a mRNA in tumor-infiltrating CD8+ T cells from mouse TC-1 tumors that were left nontreated (NT) or were exposed to 15 Gy irradiation (IR). For (L) and (M), data are mean ± SEM. Unpaired two-tailed t tests were performed. ∗∗p < 0.01 and ∗∗∗p < 0.001. See also Figure S3.
Figure 3
Figure 3
CCRT activates myeloid cells in the TME (A) UMAP plots of myeloid cell subpopulations from TN and CCRT groups. (B) Distribution and cell numbers of myeloid cell subpopulations in TN and CCRT groups. (C) DEGs in total myeloid cells, neutrophils, monocytes, and macrophages of CCRT versus TN groups. (D) Gene Ontology (GO) analysis of the top 15 biological pathways (BPs) enriched in myeloid cells of CCRT versus TN group. (E) qPCR analysis of IL6 and CCL3 mRNA in CD11b+ myeloid cells from peripheral blood of TN and CCRT patients with cervical cancer. (F) Heatmap showing the interactions between myeloid cell subpopulations and T cells. Ma, macrophage; Mono, monocytes; Neu, neutrophil. (G and H) Tumor weights (G) and the mRNA expression of senescence marker genes Cdkn1a and Phlda3 in tumor-infiltrating CD8+ T cells (H) of TC-1 tumor-bearing mice exposed to 15 Gy IR and then intratumorally injected with immunoglobulin G (IgG) or the depleting antibodies of neutrophils (α-Ly6G) and macrophages (α-CSF1R) at day 10 after tumor inoculation. For (E), (G), and (H), data are mean ± SEM. Unpaired two-tailed t tests were performed. ∗p < 0.05. See also Figure S4.
Figure 4
Figure 4
Identification of CCRT-resistant tumor cell subpopulation (A) UMAP plots of tumor cell subpopulations from TN and CCRT groups. (B and C) Distribution and cell numbers of tumor cell subpopulations in TN and CCRT groups. (D) Heatmap of quantitative set analysis for gene expression (QuSAGE) score of cell cycle, drug metabolism/resistance, hormone receptors, and transcription factor pathways in tumor cell subpopulations of TN and CCRT groups. (E) Venn diagram showing the overlapped numbers and lists of DEGs in cluster 1 subpopulation versus other clusters and the DEGs in tumor cells of CCRT versus TN groups. (F) Gene expression feature plots of top 12 overlapped upregulated genes in (E). (G) Disease-free survival analysis of top 12 overlapped upregulated genes in (E) in human patients with cervical cancer based on TCGA dataset (TCGA, PanCancer Atlas). See also Figure S5.
Figure 5
Figure 5
CCRT-resistant ACKR2+ tumor cells drive CD8+ T cell senescence (A) Scheme of coculture system of T cells with tumor cells that were left NT or were exposed to X-ray IR. (B) qPCR of the mRNA of senescence marker genes (CDKN1A and PHLDA3 for human, Cdkn2a and Phlda3 for mouse) in Jurkat T cells and mouse primary CD8+ T cells cocultured with human SiHa, HeLa, or mouse U14 cervical tumor cells that were left NT or were exposed to X-ray IR. (C) The cell-cell communication analysis of cluster 1 tumor cells with different immune cell populations based on the receptor-ligand interaction. (D) qPCR analysis of ACKR2 mRNA level in SiHa and HeLa tumor cells that were left NT or were exposed to X-ray IR (20 Gy). (E) ACKR2 expression in different tumor cell clusters. (F and G) IF and statistical analysis showing ACKR2 expression in tumor tissues of TN and CCRT patients with cervical cancer. Scale bar, 50 μm. (H and I) qPCR analysis of Cdkn2a mRNA in primary CD8+ T cells cocultured with shAckr2 or Ackr2-OE U14 tumor cells that were left NT or were exposed to X-ray IR. For (B), (D), and (G)–(I), data are mean ± SEM. Unpaired two-tailed t tests were performed. ∗p < 0.05, ∗∗p < 0.01, and ∗∗∗p < 0.001. See also Figure S6.
Figure 6
Figure 6
ACKR2 drives CD8+ T cell senescence through inducing TGF-β (A–H) Tumor sizes (A and E), weights (B and F), ACKR2 mRNA in tumor cells (C and G), and the mRNA of senescence marker genes (Cdkn1a and Phlda3) in tumor-infiltrating CD8+ T cells (D and H) of the tumor-bearing mice inoculated with Ackr2-OE (A–D) or shAckr2 (E–H) mouse TC-1 cervical tumor cells. (I) qPCR of TGFB1 and ACKR2 mRNA in SiHa cells with indicated treatments and of Tgfb1 mRNA in Ackr2-OE or shAckr2 mouse TC-1 cervical tumor cells. (J and K) qPCR of CDKN1A mRNA expression in human Jurkat T cells or Cdkn2a mRNA in mouse primary CD8+ T cells that were pretreated with or without SB-525334 (SB) and then cocultured with SiHa or Ackr2-OE U14 tumor cells that were left NT or were exposed to X-ray IR. (L–N) The tumor sizes (L), Ackr2 mRNA of tumor cells (M), and the mRNA of senescence marker genes (Cdkn1a and Phlda3) in tumor-infiltrating CD8+ T cells (N) of the tumor-bearing mice inoculated with mouse TC-1 tumor cells and then left NT or locally exposed with 15 Gy IR plus intratumoral injection with IgG or anti-TGF-β blocking antibody (αTβ) at day 10 after tumor injection. (O and P) qPCR analysis of Tgfb1, Cdkn1a, and Phlda3 mRNA in mouse primary CD8+ T cells cocultured with shCtrl and shTgfb1 TC-1 tumor cells that were left NT or were exposed to IR. (Q) qPCR analysis of the mRNA expression of senescence marker genes (Cdkn2a and Phlda3) in wild-type (WT) and TGF-βR1K268R (TβR1K268R) knockin mouse primary CD8+ T cells that were stimulated with or without TGF-β (100 ng/mL) for 24 h. Data are mean ± SEM. Statistical analysis was performed using two-way ANOVA (A, E, and L) or two-tailed unpaired t tests (B–D, F–H, I–K, and M–Q). ∗p < 0.05, ∗∗p < 0.01, and ∗∗∗p < 0.001; ns, not significant. See also Figure S6.
Figure 7
Figure 7
ACKR2 predicts poor prognosis in human patients with cervical cancer (A–D) IF and statistical analysis showing ACKR2 expression (A and B) and the colocalization of CD8 with CDKN1A (C and D) in human cervical carcinoma from the cured (n = 19) and recurrence (n = 17) patients after CCRT. (E) Linear correlation analysis of ACKR2 expression with senescent CDKN1A+ CD8+ T cells from (A)–(D) (n = 36). (F and G) Overall survival (F) and disease-free survival (G) of the enrolled CCRT-treated patients with cervical cancer (n = 61). (H) Summary diagram showing that ACKR2+ therapy-resistant tumor cells drive CD8+ T cell senescence in the TME of cervical cancer after CCRT treatment. For (B) and (D), data are mean ± SEM. Unpaired two-tailed t tests were performed. ∗∗∗p < 0.001. See also Figure S6.

References

    1. Sung H., Ferlay J., Siegel R.L., Laversanne M., Soerjomataram I., Jemal A., Bray F. Global Cancer Statistics 2020: GLOBOCAN Estimates of Incidence and Mortality Worldwide for 36 Cancers in 185 Countries. CA Cancer J. Clin. 2021;71:209–249. doi: 10.3322/caac.21660. - DOI - PubMed
    1. Peters W.A., 3rd, Liu P.Y., Barrett R.J., 2nd, Stock R.J., Monk B.J., Berek J.S., Souhami L., Grigsby P., Gordon W., Jr., Alberts D.S. Concurrent chemotherapy and pelvic radiation therapy compared with pelvic radiation therapy alone as adjuvant therapy after radical surgery in high-risk early-stage cancer of the cervix. J. Clin. Oncol. 2000;18:1606–1613. doi: 10.1200/jco.2000.18.8.1606. - DOI - PubMed
    1. Marth C., Landoni F., Mahner S., McCormack M., Gonzalez-Martin A., Colombo N., ESMO Guidelines Committee Cervical cancer: ESMO Clinical Practice Guidelines for diagnosis, treatment and follow-up. Ann. Oncol. 2018;29:iv262. doi: 10.1093/annonc/mdy160. - DOI - PubMed
    1. Adiga D., Eswaran S., Pandey D., Sharan K., Kabekkodu S.P. Molecular landscape of recurrent cervical cancer. Crit. Rev. Oncol. Hematol. 2021;157 doi: 10.1016/j.critrevonc.2020.103178. - DOI - PubMed
    1. Chao X., Fan J., Song X., You Y., Wu H., Wu M., Li L. Diagnostic Strategies for Recurrent Cervical Cancer: A Cohort Study. Front. Oncol. 2020;10 doi: 10.3389/fonc.2020.591253. - DOI - PMC - PubMed

MeSH terms

Substances