. 2024 Jul 11;73(8):1302-1312.
doi: 10.1136/gutjnl-2024-332260.

Landscape of the gut mycobiome dynamics during pregnancy and its relationship with host metabolism and pregnancy health

Affiliations

Landscape of the gut mycobiome dynamics during pregnancy and its relationship with host metabolism and pregnancy health

Yuanqing Fu et al. Gut. .

Abstract

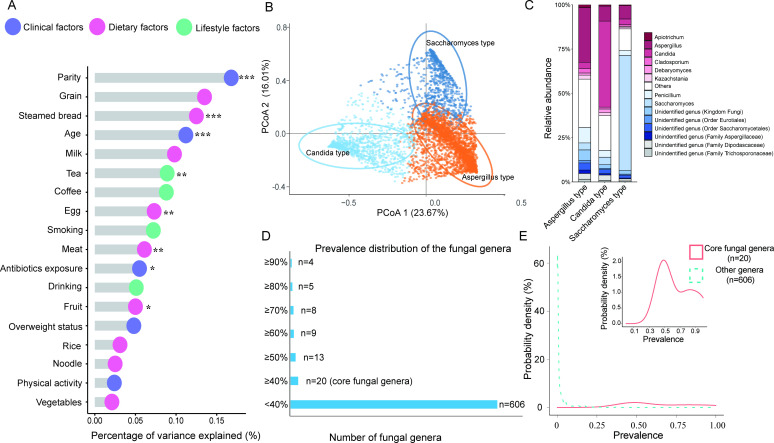
Objective: The remodelling of gut mycobiome (ie, fungi) during pregnancy and its potential influence on host metabolism and pregnancy health remains largely unexplored. Here, we aim to examine the characteristics of gut fungi in pregnant women, and reveal the associations between gut mycobiome, host metabolome and pregnancy health.

Design: Based on a prospective birth cohort in central China (2017 to 2020): Tongji-Huaxi-Shuangliu Birth Cohort, we included 4800 participants who had available ITS2 sequencing data, dietary information and clinical records during their pregnancy. Additionally, we established a subcohort of 1059 participants, which included 514 women who gave birth to preterm, low birthweight or macrosomia infants, as well as 545 randomly selected controls. In this subcohort, a total of 750, 748 and 709 participants had ITS2 sequencing data, 16S sequencing data and serum metabolome data available, respectively, across all trimesters.

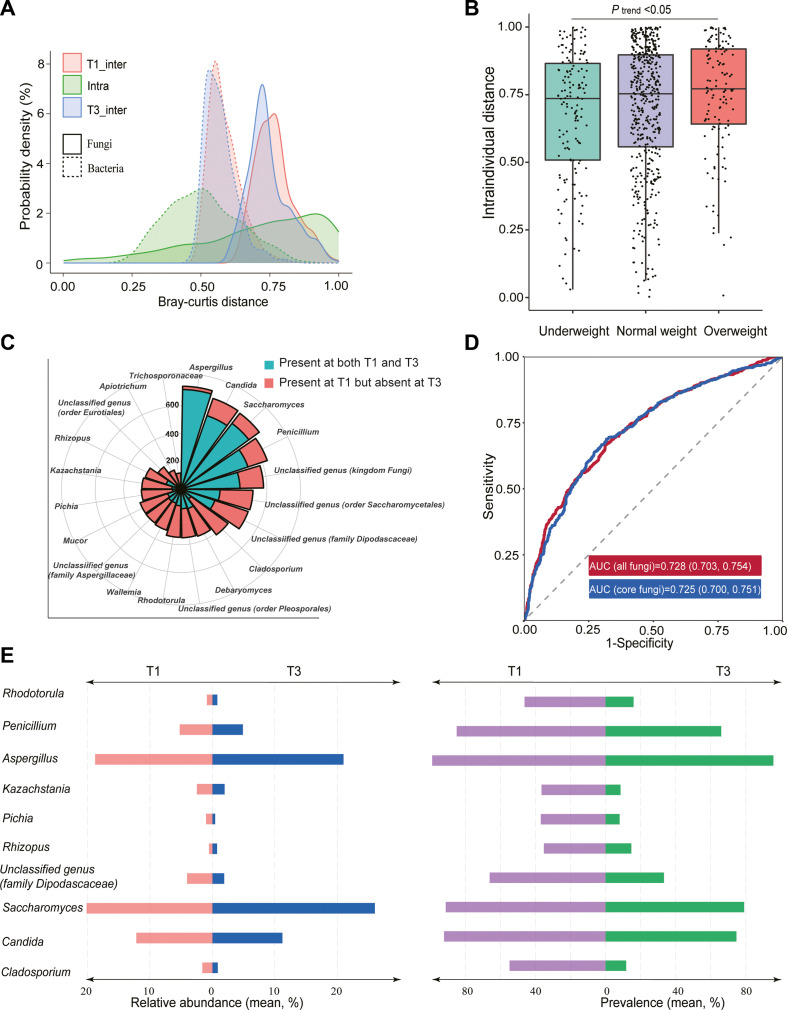
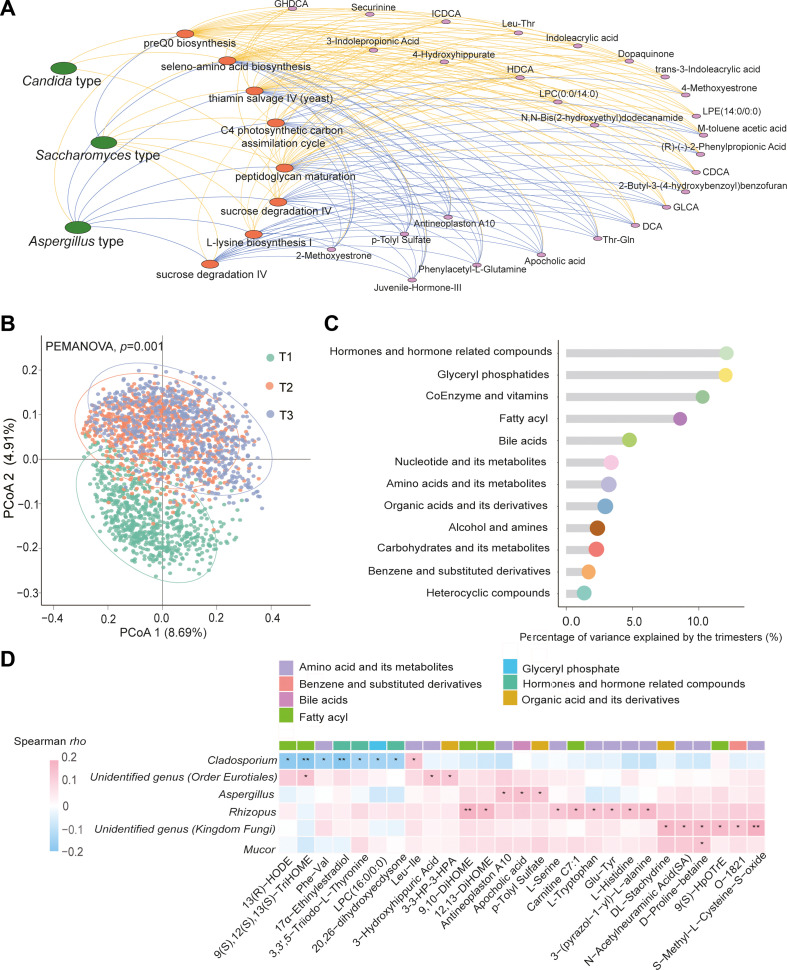
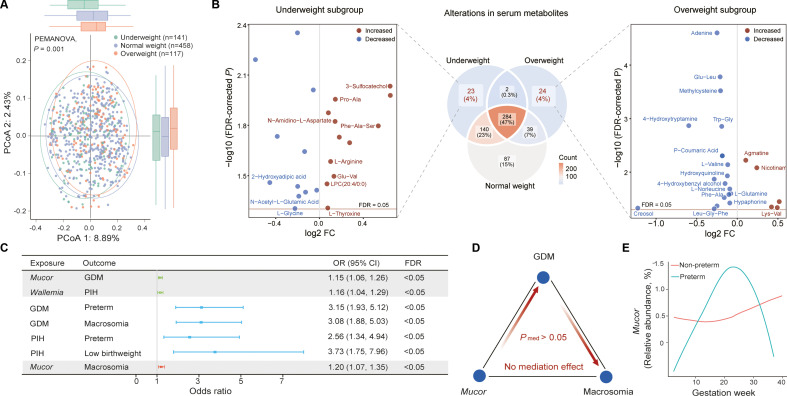
Results: The composition of gut fungi changes dramatically from early to late pregnancy, exhibiting a greater degree of variability and individuality compared with changes observed in gut bacteria. The multiomics data provide a landscape of the networks among gut mycobiome, biological functionality, serum metabolites and pregnancy health, pinpointing the link between Mucor and adverse pregnancy outcomes. The prepregnancy overweight status is a key factor influencing both gut mycobiome compositional alteration and the pattern of metabolic remodelling during pregnancy.

Conclusion: This study provides a landscape of gut mycobiome dynamics during pregnancy and its relationship with host metabolism and pregnancy health, which lays the foundation of the future gut mycobiome investigation for healthy pregnancy.

Keywords: INTESTINAL MICROBIOLOGY.


Conflict of interest statement

Competing interests: None declared.

Figures

Figure 1
Figure 1
Study workflow for profiling the gut fungi during pregnancy and exploring its relationship with host metabolism and health. To comprehensively profile the gut mycobiome-host interaction among pregnant women, we investigated potential determinants contributing to the variations of the gut mycobiome and explored the impact of gut mycobiome during early pregnancy on later pregnancy complications as well as birth outcomes in a large cohort involving 4800 pregnant women. To examine how pregnancy impacts the gut mycobiome over time and investigate potential associations between the gut mycobiome and host metabolism, we established a subcohort of 1059 participants, which included 514 women who gave birth to preterm (n=240), low birth weight (n=137) or macrosomia (n=216) infants, as well as 545 randomly selected healthy controls. Within this subcohort, ITS2 sequencing was performed on 1059 stool samples collected during the first trimester of pregnancy, 890 during the second trimester of pregnancy and 850 during the third trimester. A total of 750 participants in this subcohort had ITS2 sequencing data available for all trimesters.
Figure 2
Figure 2
Profiling of the gut mycobiome composition and enterotypes among pregnant women. (A) Variance in the mycobiome composition explained by potential determinants was assessed through permutational multivariate analysis of variance (PERMANOVA) analysis. This analysis was performed based on 4800 independent samples collected during the first trimester. The value of p was determined through 999 permutations. Significance levels are indicated as follows: *, p<0.05; **, p<0.01; ***, p<0.001.(B) Clustering results of fungal enterotypes were visualised by principal coordinate analysis (PCoA). This visualisation was applied for all samples collected in the whole cohort. (C) The most abundant genera within each enterotype were shown. This analysis was based on all samples collected in the whole cohort. (D) The number of gut fungal genera that survived prevalence-based filtering at various cut-off thresholds was shown. This analysis was performed based on 4800 independent samples collected during the first trimester. (E) The distribution of prevalence of gut fungal genera was demonstrated. This analysis was performed based on 4800 independent samples collected during the first trimester.
Figure 3
Figure 3
The shifts of gut fungal enterotypes and the dynamics of gut fungal α diversity during pregnancy. (A) Sankey diagram illustrating the shifts of gut fungal enterotypes from early pregnancy to late pregnancy. (B–D) The comparison of gut fungal α diversity across different trimesters, demonstrating the dynamics of gut fungal α diversity from early pregnancy to late pregnancy. Box plot centres show medians of the α diversity metrics with boxes indicating their IQRs, upper and lower whiskers indicating 1.5 times the IQR from above the upper quartile and below the lower quartile, respectively. Paired t test was performed to determine the significance of difference. Significance levels are indicated as follows: ns, p>0.05; *, p<0.05; **, p<0.01; ***, p<0.001. T1, the first trimester of pregnancy; T2, the second trimester of pregnancy; T3, the third trimester of pregnancy.
Figure 4
Figure 4
Discriminative gut fungal genera between early and late pregnancy. (A) The distributions of variation in gut fungal and bacterial composition over time (from T1 to T3) within individuals, as well as the differences between individuals at T1 or T3. (B) Comparison of the extent of gut mycobiome compositional alteration within individuals over time (from T1 to T3) stratified by prepregnancy overweight status. (C) Nightingale rose diagram visualising the proportion of participants whose core gut fungal genera were lost during later pregnancy in comparison to early pregnancy. (D) A machine learning framework, specifically LightGBM, was employed to train the trimester classifier on the gut mycobiome composition at T1 and T3. Subsequently, this trained classifier was used to predict the trimester to which the samples belong, employing a 10-fold cross-validation strategy and the corresponding area under the curve (AUC) values were presented. (E) The figure displays the relative abundance (left) and prevalence (right) of the top 10 gut fungal genera that contributed to the trimester classifier for T1 and T3.
Figure 5
Figure 5
Interactions between gut mycobiome and host metabolism during pregnancy. (A) Network analysis among gut fungal enterotype, microbial functionality and host metabolome. The yellow and blue lines between gut fungal enterotype and functional pathways indicate enrichment and depletion of the pathways, respectively. The yellow and blue lines between functional pathways and serum metabolites indicate positive and negative associations, respectively. (B) Comparison on the overall metabolic pattern of serum samples collected during different trimesters of pregnancy. Principal coordinate analysis (PCoA) was employed, using Canberra dissimilarity, to examine the dissimilarities between all samples. Multivariate PERMANOVA analysis was performed to evaluate the extent to which trimester accounted for the variance in the overall metabolic pattern. The value of p was determined based on 999 permutations. (C) The extent of Canberra dissimilarity-based metabolic alterations during pregnancy for different classes of metabolites over time. To quantify these alterations, we assessed the explained variance of each class of metabolites by trimester using multivariate PERMANOVA. (E) Heatmap of covarying relationship between individual core fungal genera and individual serum metabolites from the first trimester to the third trimester. Spearman correlation analysis was performed between the changes in core gut fungi (CLR-transformed) and changes in metabolites. Significance levels are indicated as follows: *, FDR<0.05; **, FDR<0.01. GHDCA, glycohyodeoxycholic acid; ICDCA, isochodeoxycholic acid; HDCA, hyodeoxycholic acid; CDCA, chenodeoxycholic acid; GLCA, glycolithocholic acid, DCA, deoxycholic acid.
Figure 6
Figure 6
Distinctive metabolic changes stratified by prepregnancy overweight status and the clinical significance of the gut mycobiome during pregnancy. (A) Comparison on the overall metabolic dynamics between subgroups. Principal coordinate analysis (PCoA) was employed, using Canberra dissimilarity, to examine the dissimilarities between pregnant women with different prepregnancy overweight status. The value of p was determined based on 999 permutations. (B) Venn plot showing the number of distinctive and common metabolites that changed significantly from the first trimester to the third trimester. In each subgroup stratified by the prepregnancy overweight status, paired t-tests were conducted for each serum metabolite measured at T1 and T3. An FDR<0.05 was considered statistically significant. For those metabolites which significantly changed solely among pregnant women who were underweight or overweight prior to pregnancy, we showed the fold-change and value of p for each metabolite in the volcano plot. The x-axis shows the log2-transforemd fold-changes, and the y axis indicates the -log (base 10) of the FDR values. Red solid lines indicate the threshold of FDR=0.05. Red dots indicate those metabolites significantly increased from T1 to T3, while blue dots indicate metabolites that significantly decreased. Only the metabolites that were characterised with the highest accuracy and could be matched with internal standards were labelled with compound names in this plot. (C) The relationship between core fungal genera and pregnancy complications as well as adverse birth outcomes. Only the statistically significant associations (FDR<0.05) were illustrated in the forest plot. (D) Mediation analysis among the gut fungal genus Mucor, GDM and macrosomia. (E) Curves show LOESS fit for the relative abundance of the identified taxa based on preterm delivery (green) or not (red). The y-axis indicates the relative abundance. 13(R)-HODE, 13R-hydroxy-9Z,11E-octadecadienoic acid; TriHOME, trihydroxyoctadec-10-enoic acid; 3–3-HP-3-HPA, 3-(3-Hydroxyphenyl)−3-hydroxypropanoic acid; DiHOME, dihydroxyoctadec-12-enoic acid; 9(S)-HpOTrE, 9S-hydroperoxy-10E,12Z,15Z-octadecatrienoic acid; O-1821, 7-(3-Hydroxy-2-(3-hydroxy-5-phenylpent-1-enyl)−5-oxocyclopentyl)hept-5-enoic acid. GDM, gestational diabetes mellitus; LOESS, locally weighted regression; PIH, pregnancy-induced hypertension.

References

    1. Newbern D, Freemark M. Placental hormones and the control of maternal metabolism and fetal growth. Current Opinion in Endocrinology, Diabetes & Obesity 2011;18:409–16. 10.1097/MED.0b013e32834c800d - DOI - PubMed
    1. Mor G, Cardenas I. The immune system in pregnancy: a unique complexity. American J Rep Immunol 2010;63:425–33. 10.1111/j.1600-0897.2010.00836.x - DOI - PMC - PubMed
    1. Evans JM, Morris LS, Marchesi JR. The gut Microbiome: the role of a virtual organ in the Endocrinology of the host. J Endocrinol 2013;218:R37–47. 10.1530/JOE-13-0131 - DOI - PubMed
    1. Koren O, Goodrich JK, Cullender TC, et al. . Host remodeling of the gut Microbiome and metabolic changes during pregnancy. Cell 2012;150:470–80. 10.1016/j.cell.2012.07.008 - DOI - PMC - PubMed
    1. Underhill DM, Iliev ID. The Mycobiota: interactions between Commensal fungi and the host immune system. Nat Rev Immunol 2014;14:405–16. 10.1038/nri3684 - DOI - PMC - PubMed

Publication types

LinkOut - more resources