. 2024 Jun 12;44(24):e0971232024.
doi: 10.1523/JNEUROSCI.0971-23.2024.

Human iPSC-Derived Neurons with Reliable Synapses and Large Presynaptic Action Potentials

Affiliations

Human iPSC-Derived Neurons with Reliable Synapses and Large Presynaptic Action Potentials

Torsten Bullmann et al. J Neurosci. .

Abstract

Understanding the function of the human brain requires determining basic properties of synaptic transmission in human neurons. One of the most fundamental parameters controlling neurotransmitter release is the presynaptic action potential, but its amplitude and duration remain controversial. Presynaptic action potentials have so far been measured with high temporal resolution only in a limited number of vertebrate but not in human neurons. To uncover properties of human presynaptic action potentials, we exploited recently developed tools to generate human glutamatergic neurons by transient expression of Neurogenin 2 (Ngn2) in pluripotent stem cells. During maturation for 3 to 9 weeks of culturing in different established media, the proportion of cells with multiple axon initial segments decreased, while the amount of axonal tau protein and neuronal excitability increased. Super-resolution microscopy revealed the alignment of the pre- and postsynaptic proteins, Bassoon and Homer. Synaptic transmission was surprisingly reliable at frequencies of 20, 50, and 100 Hz. The synchronicity of synaptic transmission during high-frequency transmission increased during 9 weeks of neuronal maturation. To analyze the mechanisms of synchronous high-frequency glutamate release, we developed direct presynaptic patch-clamp recordings from human neurons. The presynaptic action potentials had large overshoots to ∼25 mV and short durations of ∼0.5 ms. Our findings show that Ngn2-induced neurons represent an elegant model system allowing for functional, structural, and molecular analyses of glutamatergic synaptic transmission with high spatiotemporal resolution in human neurons. Furthermore, our data predict that glutamatergic transmission is mediated by large and rapid presynaptic action potentials in the human brain.

Keywords: action potential; human; iPSC; presynaptic.


Conflict of interest statement

The authors declare no competing financial interests.

Figures

Figure 1.
Figure 1.
The proportion of cells with multiple axon initial segments decreases to low levels during maturation. A, Bright-field images of cultures of human neurons with mouse astrocytes at 3 weeks. B, Example confocal fluorescence images of neurons stained for GAD65 (magenta) and MAP2 (green) at 6 weeks in human and mouse neuron cultures. C, Example confocal fluorescence images of neurons stained for ANK3 (magenta) and MAP2 (green) at 3 weeks showing neurons with one or two axon initial segments. D, Percentage of neurons with multiple axon initial segments decreases during maturation (n = 16–45 neurons per group).
Figure 2.
Figure 2.
The amount of tau protein in the axon increases during maturation. A, Western blots of total tau in human neurons during maturation in different media. β-Actin was used as a loading control. B, Tau expression increases during maturation of human neurons, quantified from first 12 lanes of the tau Western blot shown in A. C, Example confocal fluorescence images of neurons stained for microtubules (βIII-tubulin, blue) as well as the microtubule-associated proteins tau (red) and MAP2 (green). D, Mask for microtubules in dendrites (MAP2 positive) and axons (MAP2 negative). E, Ratio of tau to tubulin immunofluorescence signals in the axon increases during maturation. Each point represents mean ± standard error from n = 5 neurons per age and medium group from 12 independent cultures.
Figure 3.
Figure 3.
Passive properties indicate continuous cell growth and a stable resting membrane potential after 6 weeks. A, Example DIC image of a whole-cell patch-clamp recording from a 6-week-old neuron. B, Example of a square-pulse stimulus (with 100 ms duration and 5 mV amplitude). The input resistance (Rin) was calculated from the steady-state current (Iss). C, The input resistance Rin. D, The cell capacitance Cm. E, Example of membrane voltage responses to a series of current injections. The membrane time constant (τm) was estimated by fitting a monoexponential function to each voltage response. F, The membrane time constant (τm). G, The resting membrane potential Vrest. Recorded neurons per group: n = 8–26, except (C) with n = 6–19 and (F) with n = 3–12.
Figure 4.
Figure 4.
Somatic action potential duration decreases and excitability increases during maturation. A, Examples of somatic action potentials recorded in ACSF after development in different culture media (dashed lines indicate 0 mV potentials). B, The current threshold Ith. C, The current threshold divided by the cell capacitance Cm (current density threshold). D, Example showing the parameters used to describe an action potential, including half-duration, threshold voltage Vth, and peak voltage Vmax. E, Action potential half-duration. F, Action potential threshold voltage Vth. G, Action potential peak voltage Vmax. H, Action potential maximum slope V˙max. I, Examples of action potentials elicited by square pulse stimuli (with 100 ms duration and a current density of 3 pA/pF) in ACSF after development in different culture media (dashed lines indicate 0 mV potentials). J, The number of action potentials in response to a current injection (current density of 3 pA/pF). Recorded neurons per group: n = 8–31, except (I) with n = 7–14.
Figure 5.
Figure 5.
Human-induced neurons develop synapses with narrow apposition of pre- and postsynaptic scaffolding proteins. A, Examples of STED images showing the ultrastructure of synapses with distinct pre- and postsynaptic labeling of Bassoon (green) and Homer1 (magenta) at 3, 6, and 9 weeks. B, For measurement of peak-to-peak distance between presynaptic Bassoon and postsynaptic Homer1, synaptic contacts were aligned (small insert) and line profiles (white box) were fitted to Gaussians (gray line). C, During development a nonsignificant change in the distance of presynaptic Bassoon and postsynaptic Homer1 was observed. For comparison, measurements are shown for rat cortical neurons at DIV14. Number of synapses per group: n = 29, 19, 24, 23. D, Example electron microscopic image of a synaptic contact between human neurons cultured for 7 weeks.
Figure 6.
Figure 6.
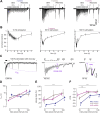
High-frequency transmission with synchronous release up to 100 Hz. A, Example traces of evoked EPSCs elicited by high-frequency stimulation at 50 Hz and 6 pulses of recovery (with exponentially increasing time difference) at different developmental stages (3, 6, and 9 weeks). The average (black) and individual consecutive traces of a recording from an individual cell (gray) are superimposed (stimulation artifacts removed). B, Average amplitudes normalized to first EPSC of a series of EPSCs with stimulation at 10, 50, and 100 Hz at the age of 9 weeks. C, Example traces of evoked EPSCs in a 6-week-old neuron elicited by high-frequency stimulation at 100 Hz and 6 pulses of recovery at different time scales illustrating the analysis of recovery from depression, the steady-state amplitude, and the PPR (stimulation artifacts removed). D, Steady-state amplitude (normalized amplitude of the last 5 EPSCs during high-frequency transmission). E, PPR calculated from the amplitude of first two EPSCs in a trace. F, Time constant of a monoexponential fit (τrec) of the EPSC amplitudes during the recovery. Recordings without recovery due to strong facilitation were excluded from the analysis of the recovery kinetics. Number of neurons per group are 20, 29, and 21 for 3, 6, and 9 weeks, respectively. Except for B with 11, 13, and 6 neurons for 10, 50, and 100 Hz, respectively.
Figure 7.
Figure 7.
Temporal precision of synaptic transmission increases during development. A, Grand averages of the first and last EPSCs of a 50 Hz stimulation at 3 and 9 weeks shown as mean ± standard error. B, The NCCT for the first EPSC of a 50 Hz stimulation (median and interquartile range, for n = 9 and 13 neurons for 3 and 9 weeks, respectively). C, The time to the half of the normalized maximal charge transfer for the first EPSC during 50 Hz stimulation (n = 9, 15, and 13 neurons for 3, 6, and 9 weeks, respectively). D, Average jitter of the time of the peak of the EPSC during 50 Hz stimulation (n = 8, 10, and 10 neurons for 3, 6, and 9 weeks, respectively; only including neurons with at least 3 traces to calculate the jitter). E, Jitter of the first EPSC (n = 18, 15, and 12 neurons for 3, 6, and 9 weeks, respectively; using the first EPSC from the 20, 50, and 100 Hz stimulation; only including neurons with at least 3 traces to calculate the jitter). F, Average jitter of the last three EPSCs during the 50 Hz stimulation as shown in panel D (n = 8, 10, and 10 neurons for 3, 6, and 9 weeks, respectively). G, Decay time constant for the first EPSC during 50 Hz stimulation (n = 9, 14, and 12 neurons for 3, 6, and 9 weeks, respectively; only including monoexponential fits with R2 > 0.85).
Figure 8.
Figure 8.
Presynaptic axon potentials are large and rapid. A, Example image of a whole-cell patch-clamp recording from a bouton of an 9-week-old iPSC-derived neuron showing the fluorescence of the ATTO 488 dye in the pipette solution (top left), the superposition of the fluorescence and the DIC image (bottom left), and the florescence due to filling of the axon with the dye after withdrawal of the patch pipette (right). B, Example of a presynaptic action potential at 9 weeks. C, Peak amplitude and half-duration of the presynaptic action potentials (n = 6 and14 bouton recordings at 4 and 9–10 weeks, respectively). D, Example of presynaptic capacitance recording showing voltage command (Vm), the pharmacologically isolated calcium current (ICa), and the membrane capacitance (Cm). The elicited increase in Cm is indicated (ΔCm). Gray marked inset shows a magnification of Vm and ICa (calibration, 100 mV and 25 pA).

References

    1. Alle H, Kubota H, Geiger JRP (2011) Sparse but highly efficient Kv3 outpace BKca channels in action potential repolarization at hippocampal mossy fiber boutons. J Neurosci 31:8001–8012. 10.1523/JNEUROSCI.0972-11.2011 - DOI - PMC - PubMed
    1. Bardy C, et al. (2015) Neuronal medium that supports basic synaptic functions and activity of human neurons in vitro. Proc Natl Acad Sci U S A 112:E2725–E2734. 10.1073/pnas.1504393112 - DOI - PMC - PubMed
    1. Beaulieu-Laroche L, Toloza EHS, van der Goes MS, Lafourcade M, Barnagian D, Williams ZM, Eskandar EN, Frosch MP, Cash SS, Harnett MT (2018) Enhanced dendritic compartmentalization in human cortical neurons. Cell 175:643–651.e14. 10.1016/j.cell.2018.08.045 - DOI - PMC - PubMed
    1. Bischofberger J, Engel D, Frotscher M, Jonas P (2006) Timing and efficacy of transmitter release at mossy fiber synapses in the hippocampal network. Pflugers Arch 453:361–372. 10.1007/s00424-006-0093-2 - DOI - PubMed
    1. Bischofberger J, Geiger JRP, Jonas P (2002) Timing and efficacy of Ca2+ channel activation in hippocampal mossy fiber boutons. J Neurosci 22:10593–10602. 10.1523/JNEUROSCI.22-24-10593.2002 - DOI - PMC - PubMed

MeSH terms

Substances

LinkOut - more resources