. 2024 Apr 30;33(2):77-98.
doi: 10.5607/en23037.

Sensory Stimulation-dependent Npas4 Expression in the Olfactory Bulb during Early Postnatal Development

Affiliations

Sensory Stimulation-dependent Npas4 Expression in the Olfactory Bulb during Early Postnatal Development

Oh-Hoon Kwon et al. Exp Neurobiol. .

Abstract

The development of the olfactory system is influenced by sensory inputs, and it maintains neuronal generation and plasticity throughout the lifespan. The olfactory bulb contains a higher proportion of interneurons than other brain regions, particularly during the early postnatal period of neurogenesis. Although the relationship between sensory stimulation and olfactory bulb development during the postnatal period has been well studied, the molecular mechanisms have yet to be identified. In this study, we used western blotting and immunohistochemistry to analyze the expression of the transcription factor Npas4, a neuron-specific immediate-early gene that acts as a developmental regulator in many brain regions. We found that Npas4 is highly expressed in olfactory bulb interneurons during the early postnatal stages and gradually decreases toward the late postnatal stages. Npas4 expression was observed in all olfactory bulb layers, including the rostral migratory stream, where newborn neurons are generated and migrate to the olfactory bulb. Under sensory deprivation, the olfactory bulb size and the number of olfactory bulb interneurons were reduced. Furthermore, Npas4 expression and the expression of putative Npas4 downstream molecules were decreased. Collectively, these findings indicate that Npas4 expression induced by sensory input plays a role in the formation of neural circuits with excitatory mitral/tufted cells by regulating the survival of olfactory bulb interneurons during the early stages of postnatal development.

Keywords: Immediate-early gene; Npas4; Olfactory bulb development; Olfactory bulb interneurons; Postnatal development; Unilateral naris occlusion.


Figures
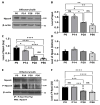
Fig. 1
Fig. 1
Expression of Npas4 in the mouse postnatally developing olfactory bulb. Expression levels of Npas4 during postnatal mouse olfactory bulb development (n=3 for each age group) using Npas4 and β-actin antibodies. (A) Immunoblot of Npas4 expression (band at approximately 100 kDa) at different developmental stages. Actin (43 kDa band) is used as a loading control. (B) Quantitative analysis of overall Npas4 protein expression in immunoblot images. (C) and (D) Quantitative analysis of Npas4 protein expression in the upper and lower parts. Npas4 protein levels are normalized by the level of β-actin expression. (E) Expression levels of phosphorylated Npas4 during postnatal mouse olfactory bulb development (n=4 for each age group) using Npas4 antibodies. Lysates were immunoprecipitated with phosphoserine/threonine/tyrosine antibody and then probed with Npas4 antibody. (F) Quantitative analysis of overall phosphorylated Npas4 protein expression in immunoblot images. Error bars represent the mean±SE, and significance is determined using a one-way ANOVA with Bonferroni’s multiple comparisons tests. Individual animals are labeled with black circles. *p<0.05, **p<0.01, ***p<0.001, ****p<0.0001.
Fig. 2
Fig. 2
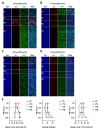
Expression pattern of Npas4 in mouse olfactory bulbs for the postnatal developing period. (A~D) Representative images of the P0, P14, P28, and P56 olfactory bulbs. Cells are co-stained with the Npas4, Tbr2, and DAPI and imaged using confocal microscopy. Blue represents nuclear DNA stained with DAPI, red represents Tbr2, and green represents Npas4 (primarily expressed in the nucleus). Each layer of the olfactory bulb glomerular layer (GL), external plexiform layer (EPL), mitral cell layer (MCL), and granule cell layer (GCL) is indicated in each image. (E) A rectangular region of interest (ROI) of the same size was randomly placed in the image data of each layer, and the ratio of Npas4 expressing cells to the total cells and the ratio of Npas4 expressing cells to the Tbr2+ cells inside the ROI was counted and the intensity of Npas4 expressing cells was measured. The counts for Npas4+ cells and total cells are all listed in Table 4. The counts for Npas4+ cells and Tbr2+ cells are all listed in Table 5. Scale bar: 100 μm.
Fig. 3
Fig. 3
OB interneurons express Npas4 during the postnatal developing period. (A) Co-stained with GABAergic interneuron markers GAD67 and NPAS4 in P14 mouse OB. GABAergic interneurons expressing Npas4 in the glomerular layer (GL), mitral cell layer (MCL), and granule cell layer (GCL) were labeled with antibodies for Npas4 and GAD67; red represents GAD67, and green represents Npas4. Squared areas are magnified, and signals are shown in red and green, respectively. The closed arrow represents GABAergic interneurons expressing Npas4 protein. The ratio of Npas4 expressing cells to the GAD67+ cells in the image data of each layer. (B) Co-stained with tyrosine hydroxylase and Npas4, and calretinin and Npas4 in P14 mouse OB. TH-positive interneurons expressing the Npas4 protein in the GL were labeled with antibodies for Npas4 and TH. CALR-positive interneurons expressing Npas4 protein in the GCL are labeled with antibodies for Npas4 and calretinin; red represents TH-positive (primarily expressed in the cytoplasm) and CALR-positive interneurons; green represents Npas4. Squared areas are magnified, and signals are shown in red and green, respectively. The closed arrow represents TH-positive interneurons and CALR-positive interneurons expressing Npas4. The ratio of Npas4 expressing cells to the TH+ and CALR+ cells in the image data of each layer. The closed arrow represents TH-positive interneurons and CALR-positive interneurons expressing Npas4. The counts for Npas4+ cells, GAD67+ cells, TH+ cells, and CALR+ cells are all listed in Table 6 and Table 7. Scale bar: 50 μm and 10 μm.
Fig. 4
Fig. 4
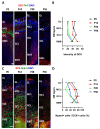
The expression pattern of cells expressing Npas4 and DCX in OB layer during the postnatal developing period. (A) Representative images of the P0, P14, P28, and P56 olfactory bulbs. Cells are co-stained with the DCX, Tbr2, and DAPI and imaged using confocal microscopy. Blue represents nuclear DNA stained with DAPI, red represents DCX, and green represents Tbr2. Each layer of the olfactory bulb glomerular layer (GL), external plexiform layer (EPL), mitral cell layer (MCL), and granule cell layer (GCL) is indicated in each image. (B) A rectangular region of interest (ROI) of the same size was randomly placed in the image data of each layer and the intensity of DCX expressing cells was measured. (C) Representative images of the P0, P14, P28, and P56 olfactory bulbs. Cells are co-stained with the DCX, Npas4, and DAPI and imaged using confocal microscopy. Blue represents nuclear DNA stained with DAPI, red represents DCX, and green represents Npas4. (D) A rectangular region of interest (ROI) of the same size was randomly placed in the image data of each layer, and the ratio of Npas4 expressing cells to the DCX+ cells inside the ROI was counted. The counts for Npas4+ cells and DCX+ cells are all listed in Table 8. Scale bar: 100 μm.
Fig. 5
Fig. 5
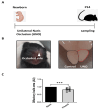
Effect of unilateral naris occlusion on the olfactory bulb’s development. (A) Schematic diagram of unilateral naris occlusion during postnatal olfactory bulb development. (B) Representative images of the mouse and the olfactory bulb occluded side. (C) The relative level of olfactory bulb size in open naris vs. closed naris. Error bars represent the mean±SE, and significance is determined using a t-test. (n=8, ***p<0.001).
Fig. 6
Fig. 6
Effect of unilateral naris occlusion on Npas4 expression during postnatal olfactory bulb development. (A) Immunoblot of Npas4 in P14 olfactory bulbs isolated from the open and closed sides of the naris. (B) The relative level of Npas4 normalized by β-actin level (n=6, ****p<0.0001). (C) RT-qPCR products of Npas4 mRNAs from the open and closed sides of the naris in P14. (D) Quantification of the intensity of Npas4 normalized by β-actin level (n=6, **p<0.01).
Fig. 7
Fig. 7
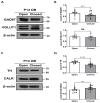
Effect of unilateral naris occlusion on OB interneurons during postnatal olfactory bulb development. (A) Immunoblot of GAD67 and VGLUT1 in P14 olfactory bulbs isolated from the open and closed sides of the naris. (B) The relative levels of GAD67 and VGLUT1 normalized by β-actin level (n=11, ***p<0.001). (C) Immunoblots of tyrosine hydroxylase (TH) and calretinin (CALR) normalized by β-actin level in P14 olfactory bulbs isolated from the open and closed sides of the naris. (D) The relative levels of TH and CALR were normalized by β-actin level (n=11, **p<0.01, ****p<0.0001).
Fig. 8
Fig. 8
The expression pattern of cells expressing Npas4 and DCX in OB layer during the postnatal developing period under the unilateral naris occlusion. (A) Representative images in P14 olfactory bulbs isolated from the open and closed sides of the naris. Cells are co-stained with the DCX, Tbr2, and DAPI and imaged using confocal microscopy. Blue represents nuclear DNA stained with DAPI, red represents DCX, and green represents Tbr2. Each layer of the olfactory bulb glomerular layer (GL), external plexiform layer (EPL), mitral cell layer (MCL), and granule cell layer (GCL) is indicated in each image. (B) Representative images in P14 olfactory bulbs isolated from the open and closed sides of the naris. Cells are co-stained with the DCX, Npas4, and DAPI and imaged using confocal microscopy. Blue represents nuclear DNA stained with DAPI, red represents DCX, and green represents Npas4. (C) A rectangular region of interest (ROI) of the same size was randomly placed in the image data of each layer and the intensity of DCX expressing cells and Npas4 expressing cells was measured. in the open and closed side of the naris. (D) A rectangular region of interest (ROI) of the same size was randomly placed in the image data of each layer, and the ratio of Npas4 expressing cells to the DCX+ cells and total cells inside the ROI was counted. The counts for Npas4+ cells and DCX+ cells are all listed in Table 9 and Table 10. Scale bar: 100 μm.
Fig. 9
Fig. 9
Effect of unilateral naris occlusion on Npas4 putative downstream molecules’ mRNA levels during postnatal olfactory bulb development. (A) Putative downstream molecules of the Npas4-Network interaction image from STRING: functional protein association networks. (B) RT-qPCR products of Bdnf, Hdac9, Nur77, Mdm2, Dcx, and Syt10 mRNAs from open and closed sides of the naris in P14. (B) and (C) Quantification of the intensity of Bdnf, Hdac9, Nur77, Mdm2, Dcx, and Syt10 normalized by β-actin level (n=6, *p<0.05, **p<0.01).
Fig. 10
Fig. 10
Schematic summary of sensory-input dependent Npas4 expression in the olfactory bulb during postnatal development.

Similar articles

Cited by

References

    1. Carvell GE, Simons DJ. Abnormal tactile experience early in life disrupts active touch. J Neurosci. 1996;16:2750–2757. doi: 10.1523/JNEUROSCI.16-08-02750.1996. - DOI - PMC - PubMed
    1. Frasnelli J, Collignon O, Voss P, Lepore F. Crossmodal plasticity in sensory loss. Prog Brain Res. 2011;191:233–249. doi: 10.1016/B978-0-444-53752-2.00002-3. - DOI - PubMed
    1. Grubb MS, Thompson ID. The influence of early experience on the development of sensory systems. Curr Opin Neurobiol. 2004;14:503–512. doi: 10.1016/j.conb.2004.06.006. - DOI - PubMed
    1. Mitchell DE. The extent of visual recovery from early monocular or binocular visual deprivation in kittens. J Physiol. 1988;395:639–660. doi: 10.1113/jphysiol.1988.sp016939. - DOI - PMC - PubMed
    1. Xu H, Kotak VC, Sanes DH. Conductive hearing loss disrupts synaptic and spike adaptation in developing auditory cortex. J Neurosci. 2007;27:9417–9426. doi: 10.1523/JNEUROSCI.1992-07.2007. - DOI - PMC - PubMed