. 2024 May 9;10(1):225.
doi: 10.1038/s41420-024-01992-7.

Bortezomib exerts its anti-cancer activity through the regulation of Skp2/p53 axis in non-melanoma skin cancer cells and C. elegans

Affiliations

Bortezomib exerts its anti-cancer activity through the regulation of Skp2/p53 axis in non-melanoma skin cancer cells and C. elegans

Kirti S Prabhu et al. Cell Death Discov. .

Abstract

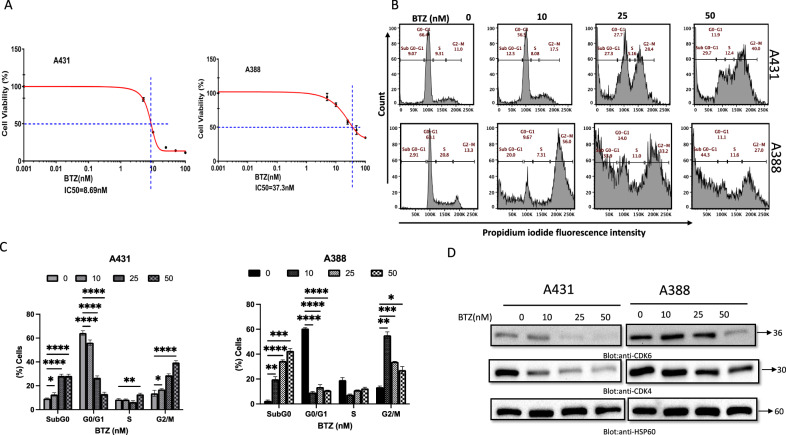
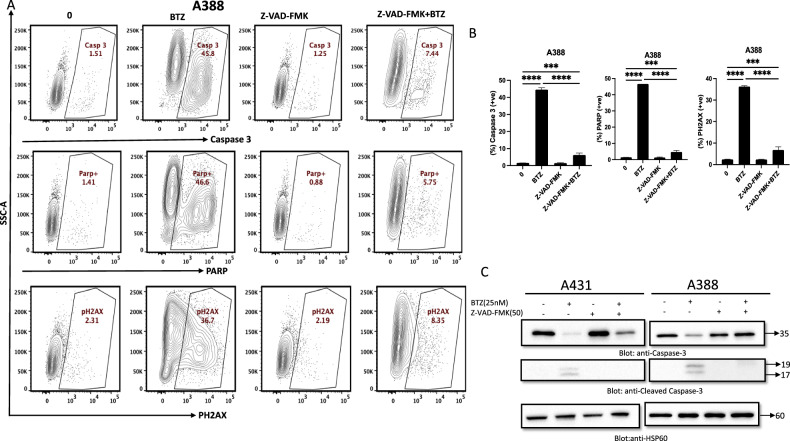
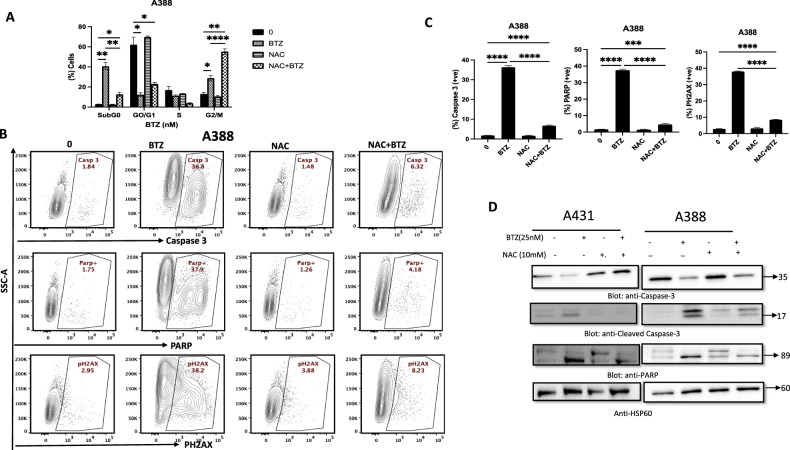
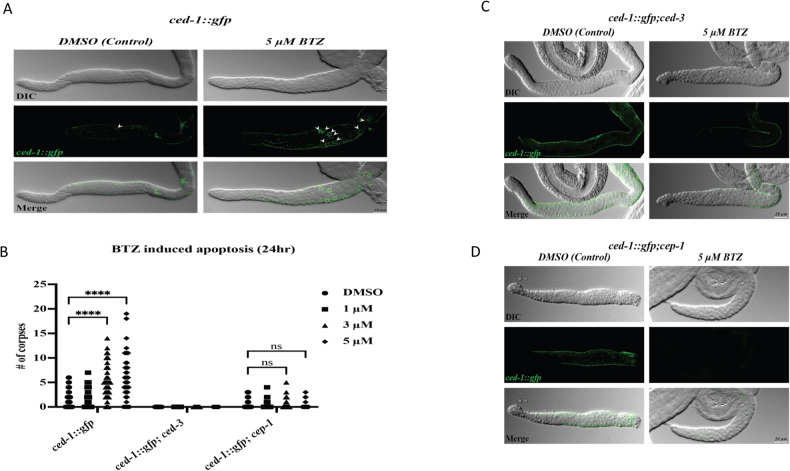
Non-melanoma skin cancer (NMSC), encompassing basal and squamous cell carcinoma, is the most prevalent cancer in the United States. While surgical removal remains the conventional therapy with a 95% 5-year cure rate, there is a growing interest in exploring alternative treatment strategies. In this study, we investigated the role of Bortezomib (BTZ), a proteasome inhibitor, in NMSC. Using two NMSC cell lines (A431 and A388), we examined the effects of BTZ treatment. Our results demonstrated that 48 h of BTZ treatment led to downregulating Skp2 expression in both A431 and A388 cells while upregulating p53 expression, specifically in A388 cells. These alterations resulted in impaired cellular growth and caspase-dependent cell death. Silencing Skp2 in A388 cells with siRNA confirmed the upregulation of p53 as a direct target. Furthermore, BTZ treatment increased the Bax to Bcl-2 ratio, promoting mitochondrial permeability and the subsequent release of cytochrome C, thereby activating caspases. We also found that BTZ exerted its antitumor effects by generating reactive oxygen species (ROS), as blocking ROS production significantly reduced BTZ-induced apoptotic cell death. Interestingly, BTZ treatment induced autophagy, which is evident from the increased expression of microtubule-associated proteins nucleoporin p62 and LC-3A/B. In addition to cell lines, we assessed the impact of BTZ in an in vivo setting using Caenorhabditis elegans (C. elegans). Our findings demonstrated that BTZ induced germline apoptosis in worms even at low concentrations. Notably, this increased apoptosis was mediated through the activity of CEP-1, the worm's counterpart to mammalian p53. In summary, our study elucidated the molecular mechanism underlying BTZ-induced apoptosis in NMSC cell lines and C. elegans. By targeting the skp2/p53 axis, inducing mitochondrial permeability, generating ROS, and promoting autophagy, BTZ demonstrates promising anti-cancer activity in NMSC. These findings provide novel insights into potential therapeutic strategies for controlling the unregulated growth of NMSC.


Conflict of interest statement

The authors declare no competing interests.

Figures

Fig. 1
Fig. 1. Effects of Bortezomib (BTZ)–on cell proliferation and cell cycle.
A BTZ inhibits the viability of A431 and A388 in a concentration-dependent after treatment with BTZ for 48 h. Cell cycle fraction analysis and cell cycle regulating proteins in response to BTZ. Upon treatment with BTZ as indicated, NMSC cells were analyzed by flow cytometry wherein BTZ significantly enhanced SubG0 fraction in A431 and A388 (B, C) and by (D) western blot analysis where expression of CDK4, CDK6, and HSP60 was examined. The graph displays the mean ± SD of three independent experiments. *P < 0.05, **P < 0.01, ***P < 0.001. The original western blots and quantification graphs can be found in Supplementary Files 1 and 2, respectively.
Fig. 2
Fig. 2. BTZ induces apoptosis in NMSC cells.
A, B A431 and A388 cells were treated with BTZ in a dose-dependent manner and analyzed by flow cytometry for apoptosis. BTZ- mediated caspase cascade activation followed by DNA double-strand breakage in A431 and A388 cells as analyzed by C western blot and D, E flow cytometry. The original western blots and quantification graphs can be found in Supplementary Files 1 and 2, respectively.
Fig. 3
Fig. 3. z-VAD-FMK reversed BTZ-induced caspase activation in NMSC cells.
NMSC cells A431 and A388 were treated with BTZ and z-VAD-FMK alone and in combination for 48 h. Caspase activation induced by BTZ in A431 and A388 cells was reversed by z-VAD-FMK as analyzed by flow cytometry (A, B) and western blot (C). The graph displays the mean ± SD of three independent experiments. *P < 0.05, **P < 0.01, ***P < 0.001. The original western blots and quantification graphs can be found in Supplementary Files 1 and 2, respectively.
Fig. 4
Fig. 4. BTZ suppresses proteasome activity in NMSC cells.
A A431 and A388 cells were treated with different doses of BTZ for 48 h as indicated. After cell lysis, equal amounts of proteins were separated by SDS-PAGE, transferred to the PVDF membrane, and immunoblotted with antibodies of anti-ubiquitin, Skp2, p53, p27, p21, MTH1 and HSP60. B BTZ treatment of A388 cells causes the stabilization of p27. A388 cells were treated with and without 50 nM of BTZ for 48 h. Cells were then treated with 10 μM Cyclohexamide for 30, 60, 120 and 240 min. Cells were lysed and equal amounts of proteins were separated by SDS-PAGE, transferred to PVDF membrane, and immunoblotted with antibodies against p27and HSP60 as indicated. C SKP2 siRNA expression downregulates SKP2 and upregulated p53, p27, p21. A388 cells were transfected with Scrambled siRNA (100 nm) and SKP2 siRNA (50–100 nm) using Lipofectamine 2000 as described in the “Methods” section. After 48 h of transfection, cells were lysed and equal amounts of proteins were separated by SDS-PAGE, transferred to the PVDF membrane, and immunoblotted with antibodies against Skp2,p53, p27, p21, and GAPDH as indicated. The original western blots and quantification graphs can be found in Supplementary Files 1 and 2, respectively.
Fig. 5
Fig. 5. BTZ-induced mitochondrial signaling pathways in NMSC cells.
BTZ treatment causes alteration in Bcl-2 expression. A A431 and A388 cells were treated with increasing doses of BTZ for 48 h, as indicated. After cell lysis, equal amounts of proteins were separated by SDS-PAGE, transferred to the PVDF membrane, and immunoblotted with antibodies against caspase-8, Bid, Bax, Bcl-2, and HSP60. B Data obtained from immunoblot analysis of Bax and Bcl-2 in A431 and A388 were used to evaluate the effects of BTZ on Bax/Bcl-2 ratio. Densitometric analysis of Bax and Bcl-2 bands was performed using AlphaImager Software (San Leandro, CA, USA), and data (relative density normalized to HSP60) were plotted as Bax/Bcl-2 ratio. Treatment with BTZ caused loss of mitochondrial membrane potential in NMSC cells. C A431 and A388 cells were treated with increasing concentrations of BTZ for 48 h and analyzed by flow cytometry. The graph displays the mean ± SD of three independent experiments (*P < 0.05, **P < 0.01, and ***P < 0.001). BTZ-induced the release of cytochrome c. D A431 and A388 cells were treated in the presence and absence of BTZ for 48 h. Cytoplasmic fraction was isolated as described in the methodology. Cell extracts were separated on SDS-PAGE, transferred to the PVDF membrane, and immunoblotted with an antibody against cytochrome c and HSP60. The original western blots and quantification graphs can be found in Supplementary Files 1 and 2, respectively.
Fig. 6
Fig. 6. BTZ -mediated reactive oxygen species (ROS) generation in NMSC cells.
A431 and A388 were treated with BTZ for 48 h. A, B Cellrox and mitoSOX assays were performed to evaluate the level of ROS by flow cytometry as described in the methodology. NAC-pretreated NMSC cells prevented BTZ-mediated activation of ROS. C A388 cells were pretreated with 10 mM NAC and then subsequently treated with 25 nM BTZ as indicated for 48 h. Th graph displays the mean ± SD (standard deviation) fold change release of ROS of three experiments (*P < 0.05, **P < 0.01, ***P < 0.001). The original western blots and quantification graphs can be found in Supplementary Files 1 and 2, respectively.
Fig. 7
Fig. 7. BTZ A-mediated ROS generation involved in apoptotic cell death in NMSC cells.
N-acetylcysteine (NAC) pretreated leukemic cells abrogated the BTZ-induced increase in SubG0 fraction in (A) A388 cells were pretreated with 10 mM NAC followed by 25 nM BTZ for 48 h, and cell cycle fraction was measured by flow cytometry. NAC pretreated leukemic cells prevented BTZ-mediated activation of caspases. A388 cells were pretreated with 10 mM NAC, then subsequently treated with 25 nM BTZ as indicated for 48 h and subjected to flow cytometry (B, C) and (D) for western blot lysed cell extracts were separated on SDS-PAGE, transferred to PVDF membrane, and immunoblotted with an antibody against procaspase-3, cleaved caspase-3, PARP, and HSP60. The graph displays the mean ± SD of three independent experiments. *P < 0.05, **P < 0.01, ***P < 0.001. The original western blots and quantification graphs can be found as Supplementary Files 1 and 2 respectively.
Fig. 8
Fig. 8. BTZ induces apoptosis in C. elegans.
A Apoptotic corpses in ced-1::gfp 24 h after treatment with 5 µM BTZ (BTZ). Increased apoptotic corpses were detected in the extracted germlines of ced-1::gfp worms upon treatment with BTZ. There are 1–2 corpses in control (DMSO treated) germlines, while upon 5 µm BTZ, 8–10 corpses can be observed by engulfment marker CED-1, fused with GFP. B The graph shows a significantly increased number of apoptotic corpses in the germlines of worms treated with various dosages of BTZ in ced-1::gfp strain (n = 45). The caspase-null strain (ced-3 mutants) confirmed the apoptosis, where no apoptotic corpses were observed in ced-1::gfp;ced-3 (n = 40). cep-1/p53 null mutant was used to confirm the BTZ-induced apoptosis via the DNA damage pathway. The graph shows the basal level of apoptosis in ced-1::gfp;cep-1 strain among treated versus control worms, showcasing its dependency on cep-1/p53 (n = 45). Arrows mark the apoptotic corpses in the pachytene region of the germlines. DIC: Differential Interference Contrast. GFP: Green Fluorescent Protein. (****P < 0.0001). Genetic characterization of BTZ-induced apoptosis. C Comparing ced-1::gfp;ced-3 worms treated with BTZ (BTZ) versus control showed no significant differences in the number of apoptotic corpses as the apoptosis is not executed in the absence of CED-3 in ced-3 null mutant, indicating caspase dependency of BTZ-induced apoptosis. D In the cep-1/p53 null mutant (ced-1::gfp;cep-1), apoptosis is not detected, suggesting the DNA damage-induced apoptosis upon BTZ treatment. All GFP signal intensities were normalized to their corresponding control. DIC differential interference contrast, GFP green fluorescent protein.

Similar articles

Cited by

References

    1. Feehan RP, Shantz LM. Molecular signaling cascades involved in nonmelanoma skin carcinogenesis. Biochem J. 2016;473:2973–94. - PMC - PubMed
    1. Bowden GT. Prevention of non-melanoma skin cancer by targeting ultraviolet-B-light signalling. Nat Rev Cancer. 2004;4:23–35. - PubMed
    1. Lomas A, Leonardi-Bee J, Bath-Hextall F. A systematic review of worldwide incidence of nonmelanoma skin cancer. Br J Dermatol. 2012;166:1069–80. - PubMed
    1. Xiang F, Lucas R, Hales S, Neale R. Incidence of nonmelanoma skin cancer in relation to ambient UV radiation in white populations, 1978-2012: empirical relationships. JAMA Dermatol. 2014;150:1063–71. - PubMed
    1. Croft M, Benedict CA, Ware CF. Clinical targeting of the TNF and TNFR superfamilies. Nat Rev Drug Discov. 2013;12:147–68. - PMC - PubMed