. 2024 May 9;15(1):3900.
doi: 10.1038/s41467-024-48034-5.

A common polymorphism in the Intelectin-1 gene influences mucus plugging in severe asthma

Affiliations

A common polymorphism in the Intelectin-1 gene influences mucus plugging in severe asthma

Jamie L Everman et al. Nat Commun. .

Abstract

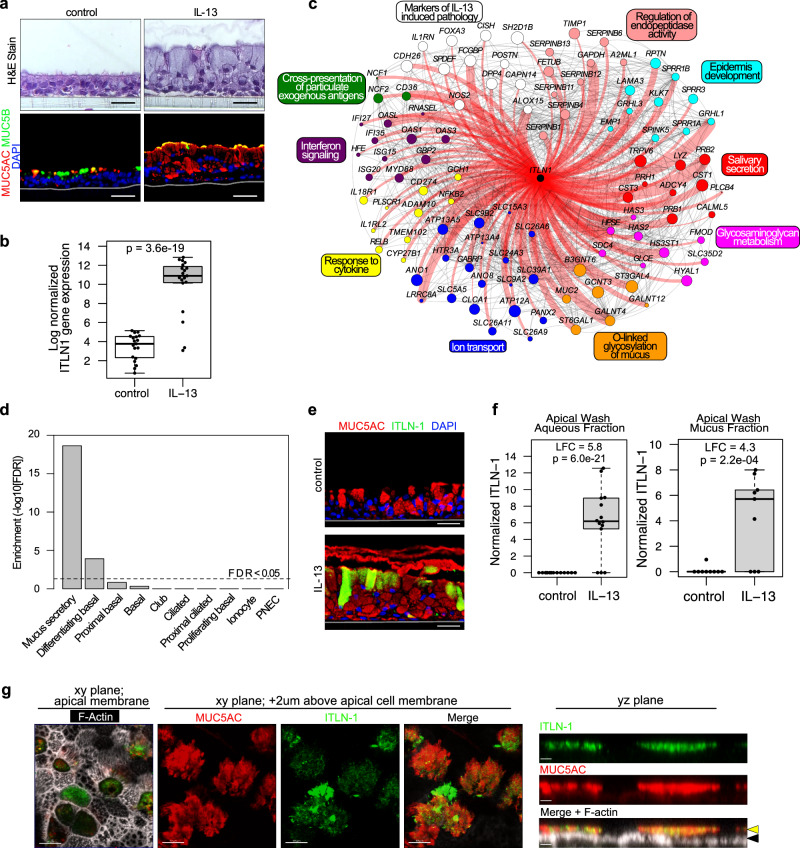
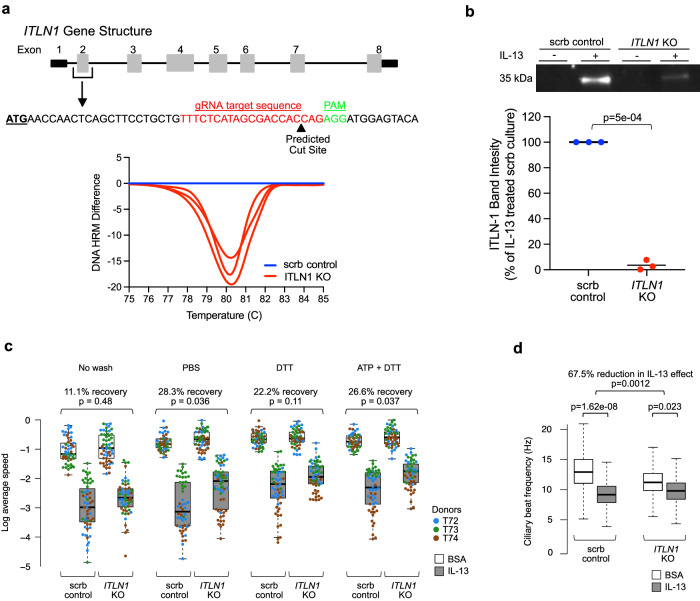
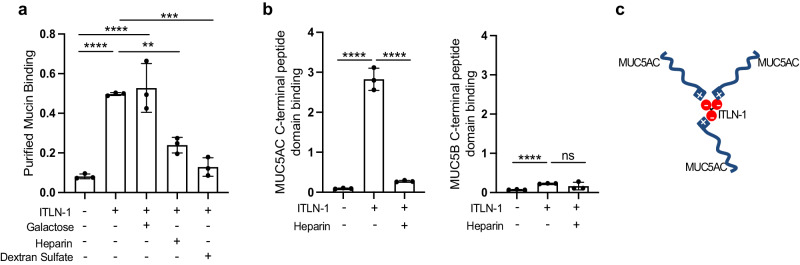
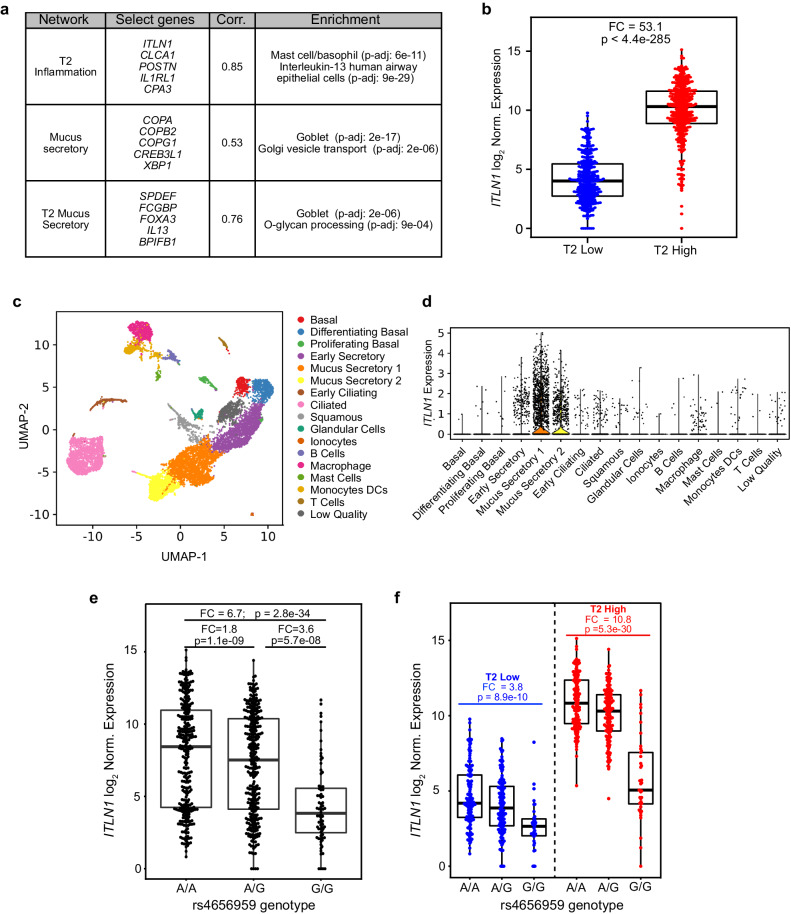
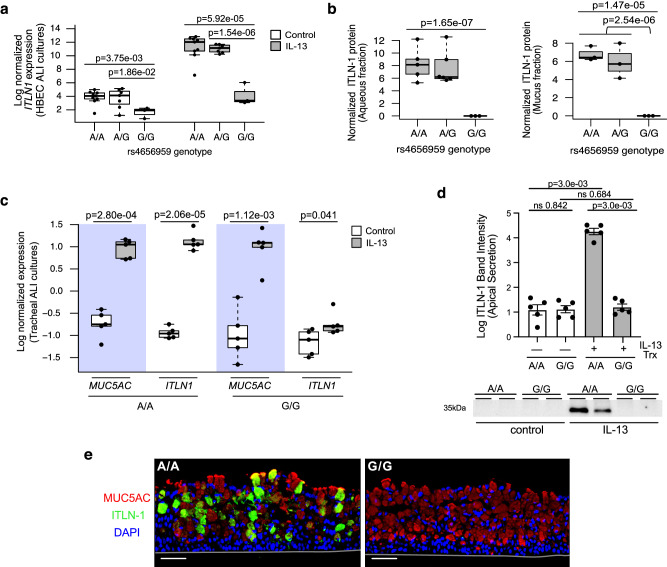
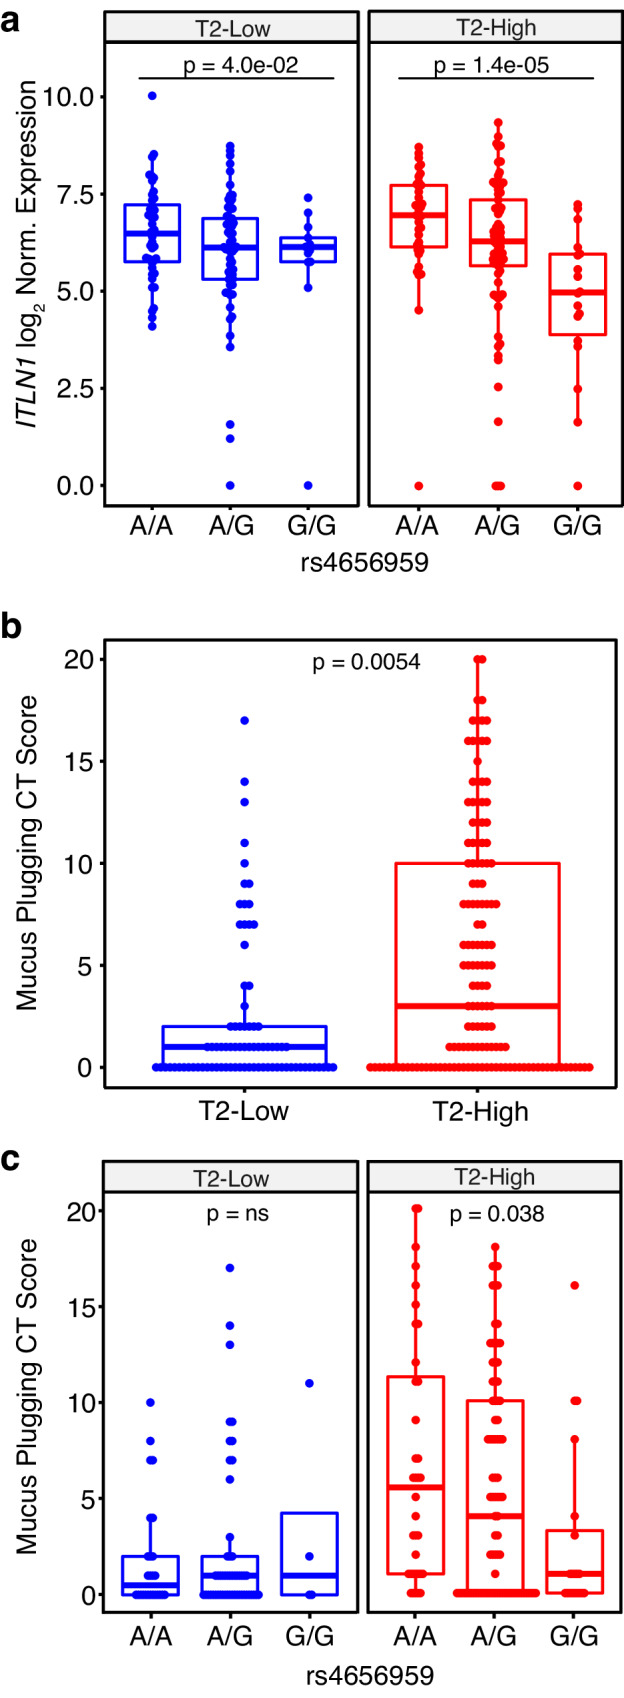
By incompletely understood mechanisms, type 2 (T2) inflammation present in the airways of severe asthmatics drives the formation of pathologic mucus which leads to airway mucus plugging. Here we investigate the molecular role and clinical significance of intelectin-1 (ITLN-1) in the development of pathologic airway mucus in asthma. Through analyses of human airway epithelial cells we find that ITLN1 gene expression is highly induced by interleukin-13 (IL-13) in a subset of metaplastic MUC5AC+ mucus secretory cells, and that ITLN-1 protein is a secreted component of IL-13-induced mucus. Additionally, we find ITLN-1 protein binds the C-terminus of the MUC5AC mucin and that its deletion in airway epithelial cells partially reverses IL-13-induced mucostasis. Through analysis of nasal airway epithelial brushings, we find that ITLN1 is highly expressed in T2-high asthmatics, when compared to T2-low children. Furthermore, we demonstrate that both ITLN-1 gene expression and protein levels are significantly reduced by a common genetic variant that is associated with protection from the formation of mucus plugs in T2-high asthma. This work identifies an important biomarker and targetable pathways for the treatment of mucus obstruction in asthma.


Conflict of interest statement

On behalf of the SARP study: The following companies provided financial support for study activities at the Coordinating and Clinical Centers beyond the third year of SARP patient follow-up: AstraZeneca, Boehringer-Ingelheim, Genentech, GlaxoSmithKline, Sanofi–Genzyme–Regeneron, and TEVA. These companies had no role in study design, data collection, or data analysis, nor preparation of the manuscript or decision to publish, and the only restriction on the funds was that they be used to support the SARP initiative. The authors of this manuscript report the following COIs: J.L.E. is listed as an inventor on the filed patent application by National Jewish Health, PCT/US24/11470 titled “Methods and Compositions for Treating Mucus Obstruction in Severe Asthma.” V.E.O. has received compensation for his role in Independent Data and Monitoring Committees for trials sponsored by Regeneron and Sanofi. B.M.E. receives consulting fees from Aer Therapeutics LLC, and receives stocks for service on the company board. B.M.E. is listed as one of the inventors on a filed patent application for lung image-based scoring systems that quantify mucus plug burden in the lung. T.S.H. is a stockholder and advisor for Aer Therapeutics LLC. M. Castro reports grants/research support from NIH, ALA, PCORI, AstraZeneca, Gala Therapeutics, Genentech, GSK, Novartis, Pulmatrix, Sanofi-Aventis, Shionogi, and Theravance. M. Castro receives consulting fees from Allakos, Amgen, Arrowhead Pharmaceuticals, Genentech, GSK, Merck, Novartis, OM Pharma, Pfizer, Pioneering Medicines, Sanofi-Aventis, and Teva, and receives payment for speaker’s bureau activities from Amgen, AstraZeneca, Genentech, Regeneron, Sanofi-Aventis, and Teva. M. Castro receives stock options from Aer Therapeutics. E.I. reports grants/research support or research materials from NHLBI, NIH, AstraZeneca, Avillion, Gossamer Bio, PCORI, Circassia, Genentech, TEVA, Sun Pharma, Laurel Pharmaceuticals, Om Pharma, Nestle, CSL Behring, AMSA, and Sanofi-Regeneron. E.I. receives consulting fees from AB Science, Allergy and Asthma Network, Amgen, Arrowhead Pharmaceuticals, AstraZeneca, GlaxoSmithKline, Merck, NHLBI, PPS Health, Regeneron, Sanofi Genzyme, TEVA, Cowen, Guidepoint, Windrose Consulting Group, and Reach Market Research. E.I. reports royalties from Wolters Kluwer, and speaker fees from Westchester Medical Center and Clearview Health Partners. E.I. has provided expert testimony for Cambridge Medical Experts. E.I. has received compensation for participation in the Data Safety Monitoring Board for Novartis, as a member of the coordinating committee in NAEPP: National Asthma Education Prevention Program, and stock options for Vorso. B.D.L., D.T.M., K.S., and L.D. reports grant funding support for SARP study activities at the Coordinating and Clinical Centers beyond the third year of SARP patient follow-up from AstraZeneca, Boehringer-Ingelheim, Genentech, GlaxoSmithKline, Sanofi–Genzyme–Regeneron, and TEVA. K.S. has received advisory fees from AstraZeneca. D.S.G. is listed as one of the inventors on a filed patent application for lung image-based scoring systems that quantify mucus plug burden in the lung. A.T.H. has received grants/research support for this study from NHLBI, and for SARP study activities at the Coordinating and Clinical Centers beyond the third year of SARP patient follow-up from AstraZeneca, Boehringer-Ingelheim, Genentech, GlaxoSmithKline, Sanofi–Genzyme–Regeneron, and TEVA. W.C.M. reports grant funding support from NHLI and ALA, and reports grant funding support for SARP study activities at the Coordinating and Clinical Centers beyond the third year of SARP patient follow-up from AstraZeneca, Boehringer-Ingelheim, Genentech, GlaxoSmithKline, Sanofi–Genzyme–Regeneron, and TEVA. L.D. also reports grant funding from NHLBI and ALA-ACRC, consulting fees from OM Pharma, research support/research equipment and materials from GlaxoSmithKline, Laurel, Sun Pharma, Vifor/OM Pharma, Vitaeris/CSL Behring, and Vitaflo. N.N.J. has previously received consulting fees from GlaxoSmithKline and AstraZeneca. S.E.W. is a Primary Investigator on an ongoing investigational research study with Regeneron. P.G.W. is a consultant with Regeneron, Sanofi, AstraZeneca, and Roche. J.V.F. reports grant funding from NIH/NHLBI, and reports grant funding support for SARP study activities at the Coordinating and Clinical Centers beyond the third year of SARP patient follow-up from AstraZeneca, Boehringer-Ingelheim, Genentech, GlaxoSmithKline, Sanofi–Genzyme–Regeneron, and TEVA. J.V.F. is the inventor of granted patents describing thiol modified saccharides as drugs to treat mucus-associated lung disease, including asthma, patent numbers US 9,856,283; US 910,526,359; US 11,021,506. J.V.F. is listed as one of the inventors on a filed patent application for lung image-based scoring systems that quantify mucus plug burden in the lung. J.V.F. is a member of the Scientific Advisory Board and receives financial and stock options as compensation for services on the Advisory Board for Suzhou Connect Biopharmaceuticals, Ltd. J.V.F. is a member of the company board and is a consultant for Aer Therapeutics, and receives financial compensation and stocks provided as compensation for services provided. M.A.S. has received speaker fees from the Colorado Allergy and Asthma Society, and is a consultant for Escient Pharmaceuticals. M.A.S. is listed as an inventor on the filed patent application by National Jewish Health, PCT/US24/11470 titled “Methods and Compositions for Treating Mucus Obstruction in Severe Asthma.” S.P.S., M.A.L., N.D.J., E.H.C., M.C.P., M. Chioccioli, C.M.M., B.B.P., N.D., R.P., C.R., M.T.M., C.E., J.R.E., A.C.Y.M., D.H., S.H., S.S., L.F., A.F.M., G.L.Z., C.R.M., J.G., X.Z., V.M., H.W.C., P.C., E.D.G., P.Z., N.R., E.M.D., M.T., E.R.B., S.C.E., D.A.M., M.L.S., J.R.S., C.G.P., and E.G.B. declare no competing interests.

Figures

Fig. 1
Fig. 1. ITLN-1 is an IL-13-induced component of the airway epithelium.
a Chronic IL-13 stimulation model of airway epithelial T2 inflammation as illustrated by H&E staining and immunofluorescent (IF) labeling of MUC5AC (red), MUC5B (green), and nuclei (blue); images are representative of 8 paired donors analyzed; scale bar 30 µM. b Box plot of normalized ITLN1 gene expression in baseline (control) and IL-13-treated ALI cultures (n = 19 donors). FDR-adjusted (Benjamini-Hochberg method) two-sided p value is based on a paired exact test (edgeR). Box centers = median, upper and lower box bounds = 1st and 3rd quartiles, whiskers extend from these bounds up to 1.5 × IQR (inter-quartile range), and data beyond whiskers are plotted as points. c Connectivity among genes within a co-expression network that includes ITLN1. Genes shown are those annotated for the enriched functional terms and pathways indicated. Genes with direct connections to ITLN1 are highlighted in red and edge width indicates strength of connectivity. Node color denotes functional annotation, and node size increases with eigengene-based connectivity to the network. d Enrichment of ITLN1 co-expression network genes in mucus secretory cells, compared to all other defined airway epithelial lung cell populations identified by scRNA-seq. FDR-adjusted two-sided p-values are based on a one-sided hypergeometric test. e Immunofluorescent labeling shows IL-13-induced expression of ITLN-1 in a subset of MUC5AC+ secretory cells; MUC5AC (red), ITLN-1 (green), nuclei (blue); Images are representative of 8 paired donors analyzed; scale bar 30 µM. f Boxplots of normalized ITLN-1 peptides measured in apical ALI secretions following control and chronic IL-13 stimulation (aqueous fraction n = 14 donors, mucus fraction n = 9 donors). FDR-adjusted two-sided p values are based on a paired exact test (edgeR). LFC = log fold change. Box plots as defined in b. g Confocal imaging analysis of mucociliary ALI cultures stimulated with IL-13 illustrating ITLN-1 presence within the airway mucus on the apical side of mucociliary epithelium; MUC5AC (red), ITLN-1 (green), F-actin (white); black arrows—apical cell membrane, yellow arrows—mucus layer; XY image scale bar 10 µm; YZ image scale bar 2.5 µm; images are representative of ALI cultures labeled from n = 3 HBEC donors. Source data are provided as a Source Data file.
Fig. 2
Fig. 2. ITLN-1 contributes to IL-13-mediated decrease in epithelial mucociliary function.
a Schematic of the gene structure of ITLN1, the targeted CRISPR-Cas9 editing site, and the resultant DNA editing as determined by high-resolution melt curve analysis. The plot (bottom) shows differences in melt temperature profiles from pooled ALI inserts (n = 3/condition) for ITLN1 KO (red) samples from each donor assayed by HRM analysis. The scramble control DNA melt temperature profile (blue) was set as the reference for each donor (n = 3 donors). b Western blot quantitation of ITLN-1 (35 kDa) in apical washes collected from mock or IL-13-stimulated mucociliary ALI cultures differentiated from control edited (scrb; blue) and ITLN1 KO basal cells (red); Western blot image is representative of all measured data, and band intensity plot reflects data from conditions from all edited donors (n = 3); Two-sided p values calculated using paired Student’s t test. c Box plots showing the log of average particle speed within control edited (scrb) and ITLN1 KO mucociliary cultures that were mock- (BSA, white boxes) or IL-13-stimulated (gray boxes), with replicate experiments carried out using no wash, PBS wash, PBS-DTT wash, and ATP + PBS-DTT wash regimes. Data values represent the log of average speed of all measured particles within each video from the MCM assays, where there are an average of n = 18 videos for each of the 16 total conditions (2 gene-edited statuses × 2 treatments × 4 washes) per donor. Videos were captured across 6–7 fields of view across the culture to account for variation across the culture, measured across n = 3 individual ALI inserts from each of the edited donors (n = 3)—with each donor identified by a different color in the plot). The exact sample sizes per box, left to right, are 54, 55, 56, 55, 55, 54, 58, 58, 55, 55, 55, 56, 56, 54, 55, 58. Above plots are given the estimated percent recovery (and associated p values) of particle speed in IL-13-stimulated cultures relative to BSA cultures when in an ITLN1 KO epithelium compared to the control (scrb) epithelium. Two-sided p values are based on linear mixed model t tests, with random effects for donor and insert, and use Satterthwaite approximation of degrees of freedom. Box centers = median, upper and lower box bounds = 1st and 3rd quartiles, whiskers extend from these bounds up to 1.5 × IQR (inter-quartile range). All data points are overlain. d Box plots of ciliary beat frequency (CBF) measured on control (scrb) and ITLN1 KO mucociliary ALI cultures from triplicate culture inserts and 3 donors following mock- and IL-13-stimulation. Each box plot, as defined in c, represents all datapoints collected from all videos captured across donors and inserts for each condition (n = 30,899, 24,786, 25,533, and 24,964, from left to right), but illustration of outliers was excluded for visualization purposes. Two-sided p values are based on linear mixed model t-tests with random effects for donor and insert and use Satterthwaite approximation of degrees of freedom. Source data are provided as a Source Data file.
Fig. 3
Fig. 3. ITLN-1 binds to purified airway mucins and to the C-terminal domain of MUC5AC.
a Bar graphs measuring binding of recombinant flag-tagged ITLN-1 protein, and the effect of co-incubation with galactose, heparin, or dextran sulfate, to purified human airway mucins (isolated and pooled from n = 5 participants). Data represent mean values ± SD; one way ANOVA with multiple comparisons **p = 0.0032, ***p = 0.0002, and ****p < 0.0001. b Binding assays measuring the ability of ITLN-1 protein, or co-incubated ITLN-1 + heparin, to bind to immobilized C-terminal peptides of MUC5AC (left) or MUC5B (right). Data representative of n = 3 independent experiments and bar plots represent mean values ± SD; Two-sided t test ****p < 0.0001, ns = not significant. c Illustration of the potential mechanism by which an ITLN-1 protein trimer could interact with the C-terminal domain of MUC5AC mucin molecules via electrostatic interactions. Source data are provided as a Source Data file.
Fig. 4
Fig. 4. ITLN1 is correlated with T2 inflammatory mucus secretory expression networks and is expressed by mucus secretory cells in vivo.
a WGCNA conducted using gene expression from nasal airway epithelial brushings collected from 695 children in the GALA II asthma study found a strong correlation of ITLN1 expression with T2 inflammation and mucus secretory networks. Select genes from each network, Pearson correlation between expression of ITLN1 and network eigengenes, and top functional enrichments from each network are given. Enrichment p values were obtained from a one-sided Fisher exact test implemented in Enrichr. FDR-adjusted p values were obtained using the Benjamini–Hochberg method. b Box plots of log2-normalized ITLN1 gene expression in GALA II nasal epithelial brushes stratified by T2 inflammation status (n: T2-low = 331, T2-high = 364). Fold change (FC) and two-sided p value from a Wald test was obtained from DESeq2. Box centers = median, upper and lower box bounds = 1st and 3rd quartiles, whiskers extend from these bounds up to 1.5 × IQR (inter-quartile range). All data points are overlain. c UMAP visualization of 11,515 cells from scRNA-seq of two dissociated bronchial airway epithelial brushings detailing the 17 cell types identified by SNN clustering through the Leiden algorithm. d Violin plots of log count per million (CPM)-normalized ITLN1 expression across the 17 distinct cell types identified in bronchial airway brushings. e Box plots of log2-normalized ITLN1 expression in GALA II stratified by the A/A (n = 292), A/G (n = 313), or G/G (n = 76) genotypes of the top eQTL variant rs4656959. Two-sided p-values were obtained from a Wald test in DESeq2. Box plots as defined in b. f Box plots of log2-normalized ITLN1 expression in GALA II, stratified by T2 inflammation status and the genotypes of the top eQTL variant rs4656959 (T2-low n: A/A = 141, A/G = 148, G/G = 35 and T2-high n: A/A = 151, A/G = 165, G/G = 41). Two-sided p values were obtained from a Wald test in DESeq2. Box plots as defined in b. Source data are provided as a Source Data file.
Fig. 5
Fig. 5. ITLN1 rs4656959 variant eliminates ITLN-1 protein expression in airway epithelia.
a Normalized ITLN1 gene expression from paired HBEC ALI cultures (n = 19 donors) stratified by treatment (control vs. IL-13) and by ITLN1 rs4656959 genotype for both treatments (n: A/A = 9, A/G = 7, and G/G = 3). Two-sided p values for indicated differences are based on an exact test (edgeR). Box centers = median, upper and lower box bounds = 1st and 3rd quartiles, whiskers extend from these bounds up to 1.5 × IQR (inter-quartile range). All data points are overlain. b Box plots showing normalized ITLN-1 protein secretion measured in aqueous (left; n: A/A = 5, A/G = 6, and G/G = 3) and mucus (right; n: A/A = 3, A/G = 3, and G/G = 3) fractions from apical washes of IL-13-stimulated HBEC ALI cultures. Two-sided p values are based on an exact test (edgeR). Box plots as defined in a. c Normalized ITLN1 and MUC5AC expression measured by qPCR from tracheal mucociliary ALI cultures stratified by treatment (control-white or IL-13-gray) and by ITLN1 rs4656959 genotype (n = 5 donors/genotype). Two-sided p-values are based on linear mixed model t tests with donor as random intercept using Satterthwaite approximation of degrees of freedom. Box plots as defined in a. d Western blot analysis measuring ITLN-1 in apical washes from control or IL-13-stimulated tracheal ALI cultures with the A/A or G/G genotype of rs4656959 (n = 5 donors/genotype). Western blot image is representative of data from all donors. Band intensity data reflect all conditions from all donors (n = 5 donors/genotype). Data represent mean value ± SEM; Two-sided p values calculated using Student’s t test. e Immunofluorescent labeling of IL-13-treated tracheal ALI cultures for ITLN-1 (green), MUC5AC (red), and nuclei (DAPI); images are representative of all 10 donors analyzed; scale bar 50 μm. Source data are provided as a Source Data file.
Fig. 6
Fig. 6. ITLN1 rs4656959 is associated with lower mucus plug scores in T2-high asthmatics.
a Box plots of log2-normalized ITLN1 expression from 249 participants in the SARP asthma cohort stratified by T2 status and ITLN1 rs4656959 genotype; n: T2-low participants n: A/A = 43, A/G = 61, G/G = 13 and T2-high participants n: A/A = 37, A/G = 77, G/G = 18. Two-sided p values for indicated differences were obtained from a Wald test in DESeq2. Box centers = median, upper and lower box bounds = 1st and 3rd quartiles, whiskers extend from these bounds up to 1.5 × IQR (inter-quartile range). All data points are overlain. b Box plots of mucus plug scores (2 measurements per participant) from SARP, stratified into T2-low (n = 41 participants) and T2-high (n = 71 participants) groups based on sputum RNA-seq expression profiles. Two-sided p values were obtained by fitting negative binomial mixed model implemented in SAS PROC GLIMMIX (METHOD = RSPL; DDFM = KENWARDROGER2) with subjectID as random effect. Box plots as defined in a. c Box plots of mucus plug scores (2 measurements per participant) from SARP, stratified by both T2 status and ITLN1 rs4656959 variant genotype; T2-low participants n: A/A = 13, A/G = 26, G/G = 2 and T2-high participants n: A/A = 18, A/G = 43, G/G = 10. Two-sided p values were obtained by fitting a negative binomial mixed model implemented in SAS PROC GLIMMIX (METHOD = RSPL; DDFM = KENWARDROGER2) with subjectID as random effect. Box plots as defined in a. Source data are provided as a Source Data file.

Similar articles

Cited by

References

    1. Fahy JV. Type 2 inflammation in asthma–present in most, absent in many. Nat. Rev. Immunol. 2015;15:57–65. doi: 10.1038/nri3786. - DOI - PMC - PubMed
    1. Wesolowska-Andersen A, Seibold MA. Airway molecular endotypes of asthma: dissecting the heterogeneity. Curr. Opin. Allergy Clin. Immunol. 2015;15:163–168. doi: 10.1097/ACI.0000000000000148. - DOI - PMC - PubMed
    1. Woodruff PG, et al. T-helper type 2-driven inflammation defines major subphenotypes of asthma. Am. J. Respir. Crit. Care Med. 2009;180:388–395. doi: 10.1164/rccm.200903-0392OC. - DOI - PMC - PubMed
    1. Sajuthi SP, et al. Type 2 and interferon inflammation regulate SARS-CoV-2 entry factor expression in the airway epithelium. Nat. Commun. 2020;11:5139. doi: 10.1038/s41467-020-18781-2. - DOI - PMC - PubMed
    1. Jackson ND, et al. Single-cell and population transcriptomics reveal pan-epithelial remodeling in type 2-high asthma. Cell Rep. 2020;32:107872. doi: 10.1016/j.celrep.2020.107872. - DOI - PMC - PubMed

Publication types