. 2024 May 9;7(1):554.
doi: 10.1038/s42003-024-06112-w.

Super-resolution proximity labeling with enhanced direct identification of biotinylation sites

Affiliations

Super-resolution proximity labeling with enhanced direct identification of biotinylation sites

Sanghee Shin et al. Commun Biol. .

Abstract

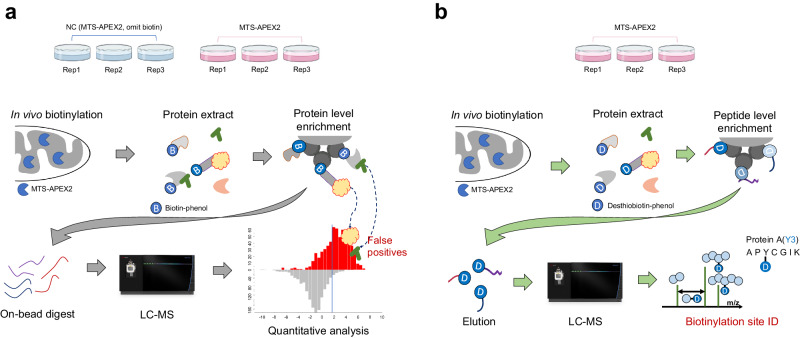
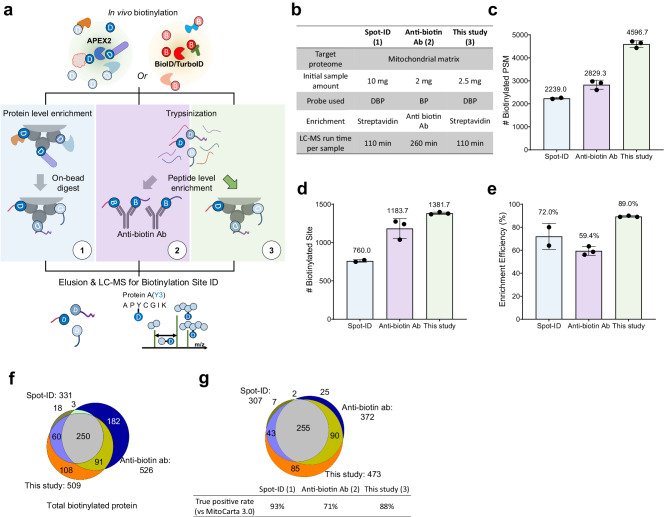
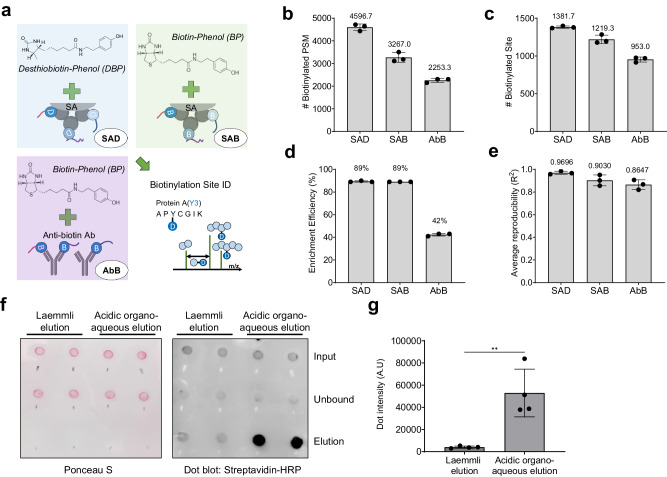
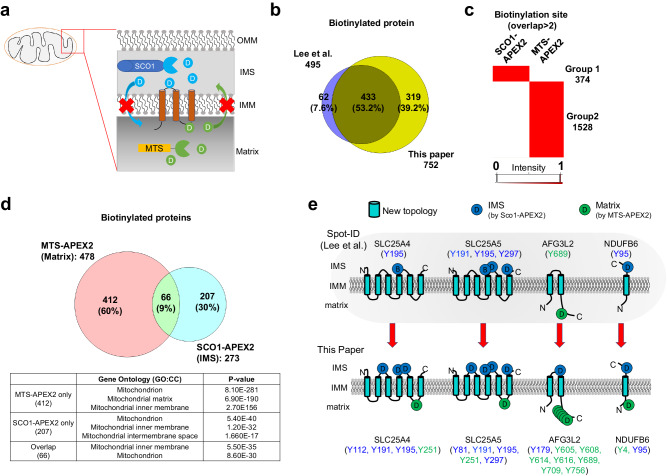
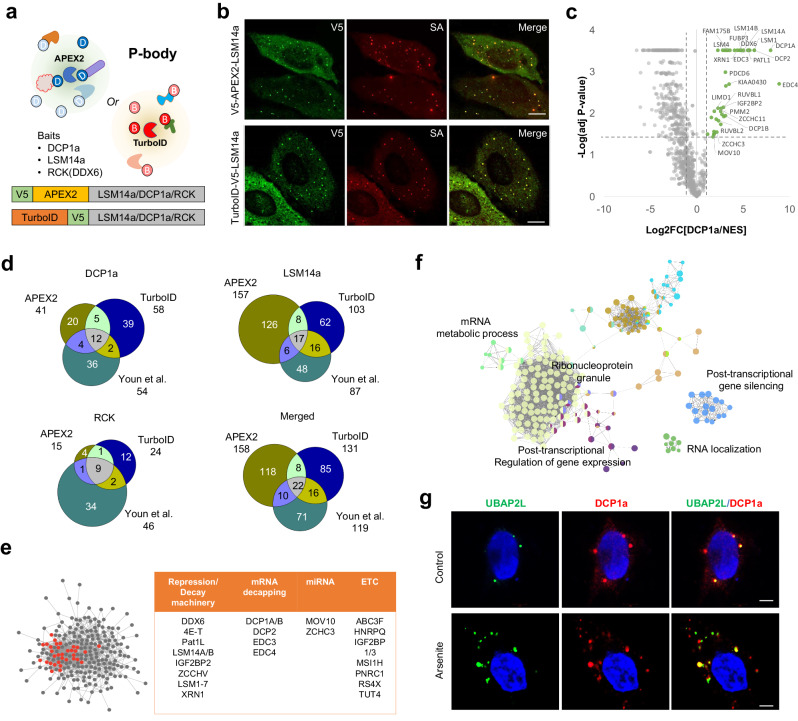
Promiscuous labeling enzymes, such as APEX2 or TurboID, are commonly used in in situ biotinylation studies of subcellular proteomes or protein-protein interactions. Although the conventional approach of enriching biotinylated proteins is widely implemented, in-depth identification of specific biotinylation sites remains challenging, and current approaches are technically demanding with low yields. A novel method to systematically identify specific biotinylation sites for LC-MS analysis followed by proximity labeling showed excellent performance compared with that of related approaches in terms of identification depth with high enrichment power. The systematic identification of biotinylation sites enabled a simpler and more efficient experimental design to identify subcellular localized proteins within membranous organelles. Applying this method to the processing body (PB), a non-membranous organelle, successfully allowed unbiased identification of PB core proteins, including novel candidates. We anticipate that our newly developed method will replace the conventional method for identifying biotinylated proteins labeled by promiscuous labeling enzymes.


Conflict of interest statement

The authors declare no competing interests.

Figures

Fig. 1
Fig. 1. Schematic workflow of conventional and enhanced direct identification of biotinylation sites.
a Schematics of the conventional workflow of biotinylated protein enrichment and identification through liquid chromatography–mass spectrometry. b Schematics of the biotinylated site identification method through enrichment of biotinylated peptides.
Fig. 2
Fig. 2. Comparison of conventional workflow and super-resolution proximity labeling with enhanced direct identification of biotinylation sites.
a Filtering scheme for mass spectrometric data for conventional ratiometric approach (left) and biotinylation site identification method (right). b Establishing a cutoff threshold for conventional ratiometric approach. True positive (TP) rate (TPR) was plotted versus the false positive (FP) rate (FPR) in a receiver operating characteristic curve (left). TP proteins were curated using the MitoCarta 3.0 database. The optimal cutoff threshold was determined from the maximum value of TPR-FPR result (right). c Histograms showing the distribution of TP and FP proteins. d Detailed results of the conventional approach and newly developed biotin site identification method. e Total number of identified proteins from each method and a corresponding number of TP proteins. f Evaluation of data reliability. g Venn diagram of identified biotinylated proteins. h Composition of TP proteins among all identified proteins within a dataset of each method based on the quantified value (n = 3). i Comparison of streptavidin abundance measured from different approaches (n = 3).
Fig. 3
Fig. 3. Comparison of related approaches of biotinylation site identification.
a Schematic illustrating the difference in related approaches of biotinylation site identification. b Summary table of related approaches for biotinylation site identification. Identification results of biotinylated peptide spectrum match (PSM) (c), site (d), and enrichment efficiency (e) of different approaches in biotinylation site identification methods. f Identification overlaps of total identified biotinylated proteins among different methods. g Identification overlaps of identified true positive proteins and their true positive rates among different methods. True positive proteins were curated using the MitoCarta 3.0 database.
Fig. 4
Fig. 4. Comparison of different probe-capture combinations for identifying biotinylated sites.
a Schematic illustrating the differences in probe-capture combinations for the biotinylated peptide enrichment strategy. Identification results of biotinylated PSM (b), site (c), enrichment efficiency (d), and average reproducibility among replicates (e) of different probe-capture combinations of biotinylated peptide enrichment approaches. f dot blot result by streptavidin-HRP for comparing different elution buffers. g quantitative comparison of dot blot result of eluted samples from Figs. 4f and  S2g, n = 4, p-value < 0.004.
Fig. 5
Fig. 5. Analysis of the mitochondrial matrix and intermembrane space proteome via super-resolution proximity labeling with enhanced direct identification of biotinylation sites.
a Schematic figure of biotin-labeling mitochondrial matrix, inner membrane, and intermembrane space proteome via proximity labeling using APEX2 construct. b Identification comparison is done between Lee et al.’s and this study. c Heatmap of clustered identified biotinylation sites. d Overlapping and corresponding Gene Ontology terms of biotinylated proteins identified using MTS-APEX2 and SCO1-APEX2. e previously mapped topology of membrane proteins by Lee et al. (upper panel). Advanced identification of biotinylation sites applied on topology mapping by this paper (lower panel).
Fig. 6
Fig. 6. Application of super-resolution proximity labeling to map p-body proteome.
a Schematic illustration of processing body (PB) proteome profiling via proximity labeling and a list of bait with schematics of bait-APEX2/TurboID construct. b Representative immunofluorescence (IF) images of expressed APEX2/TurboID conjugated baits and biotin-labeled patterns. Scale bar = 10 μm. c Volcano plot of differentially expressed proteins identified from DCP1a-APEX2 and NES-APEX2 construct. PB candidate proteins are marked green, and gene names of known PB proteins are labeled. d Identification overlaps of identified PB candidates among different bait-APEX2/TurboID constructs and published results based on BioID. e Network analysis of identified PB protein candidates. Listed core PB proteins (right) are marked red. f Gene Ontology analysis of identified PB protein candidates and their network using Clue-go analysis. g Representative IF images of UBAP2L localization to PB under various conditions. Arsenite was treated for 30 min. Scale bar = 5 μm.

References

    1. Cho KF, et al. Split-TurboID enables contact-dependent proximity labeling in cells. Proc. Natl Acad. Sci. USA. 2020;117:12143–12154. doi: 10.1073/pnas.1919528117. - DOI - PMC - PubMed
    1. Choi CR, Rhee HW. Proximity labeling: an enzymatic tool for spatial biology. Trends Biotechnol. 2022;40:145–148. doi: 10.1016/j.tibtech.2021.09.008. - DOI - PubMed
    1. Fazal FM, et al. Atlas of subcellular RNA localization revealed by APEX-Seq. Cell. 2019;178:473–490.e426. doi: 10.1016/j.cell.2019.05.027. - DOI - PMC - PubMed
    1. Kwak C, et al. Contact-ID, a tool for profiling organelle contact sites, reveals regulatory proteins of mitochondrial-associated membrane formation. Proc. Natl Acad. Sci. USA. 2020;117:12109–12120. doi: 10.1073/pnas.1916584117. - DOI - PMC - PubMed
    1. Rhee H-W, et al. Proteomic mapping of mitochondria in living cells via spatially restricted enzymatic tagging. Science. 2013;339:1328–1331. doi: 10.1126/science.1230593. - DOI - PMC - PubMed

Publication types