. 2024 Nov;29(11):3330-3343.
doi: 10.1038/s41380-024-02576-8. Epub 2024 May 9.

Genetic regulation of human brain proteome reveals proteins implicated in psychiatric disorders

Affiliations

Genetic regulation of human brain proteome reveals proteins implicated in psychiatric disorders

Jie Luo et al. Mol Psychiatry. 2024 Nov.

Abstract

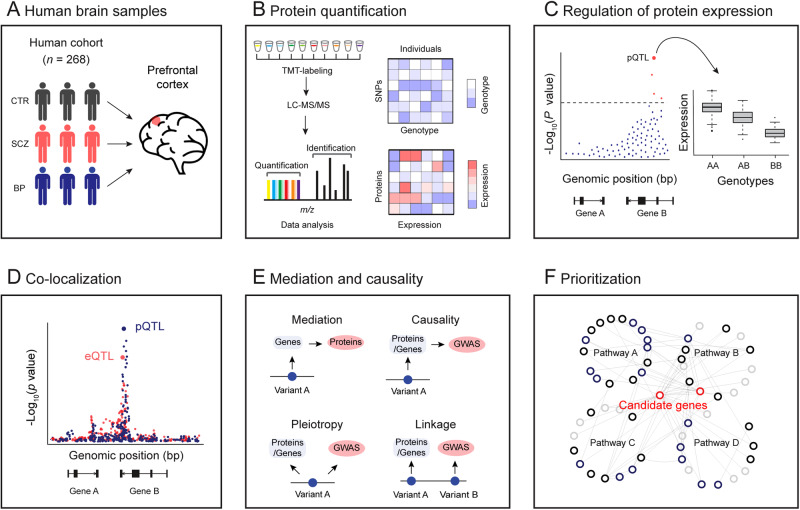
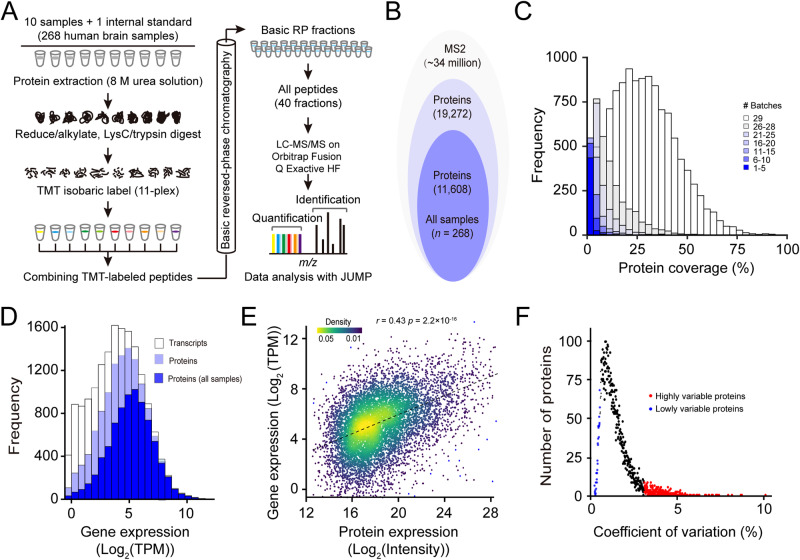
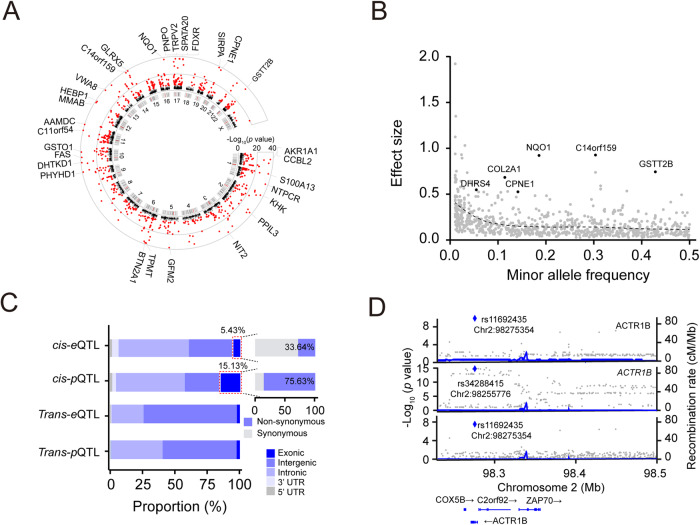
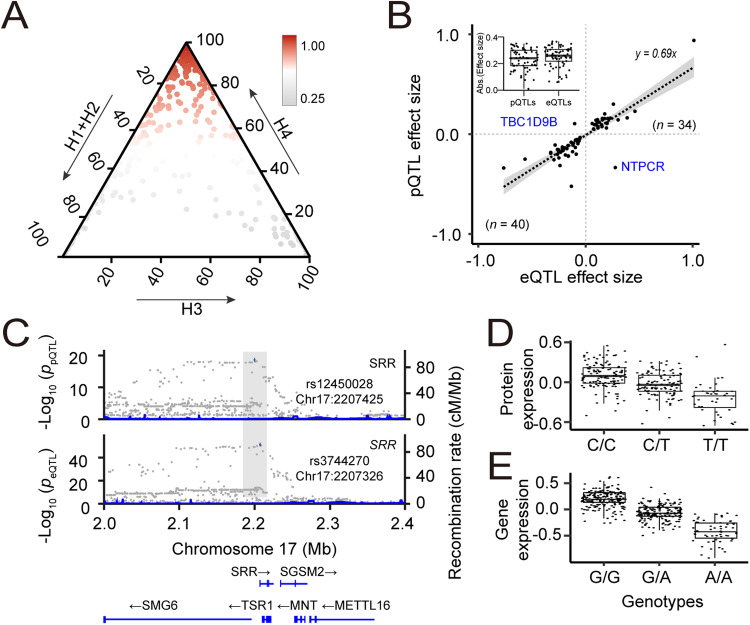
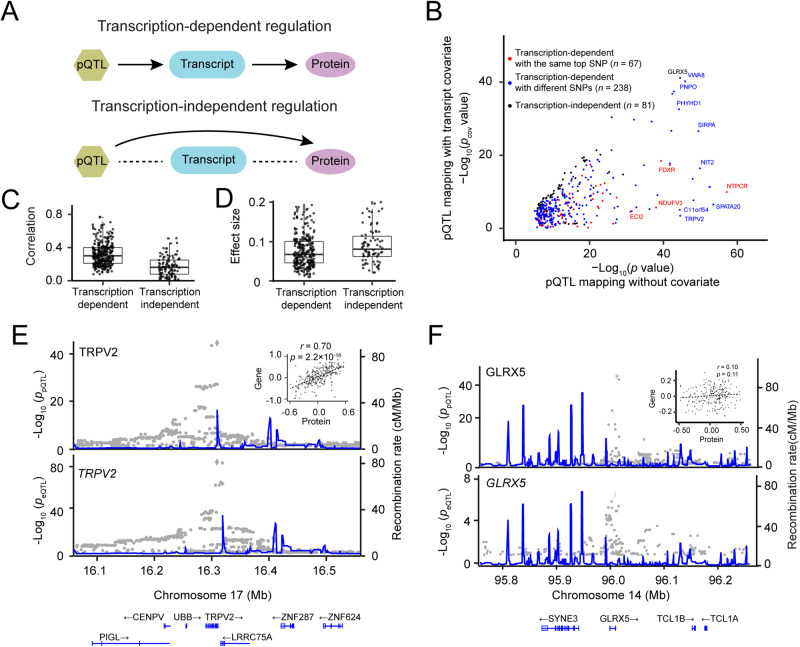
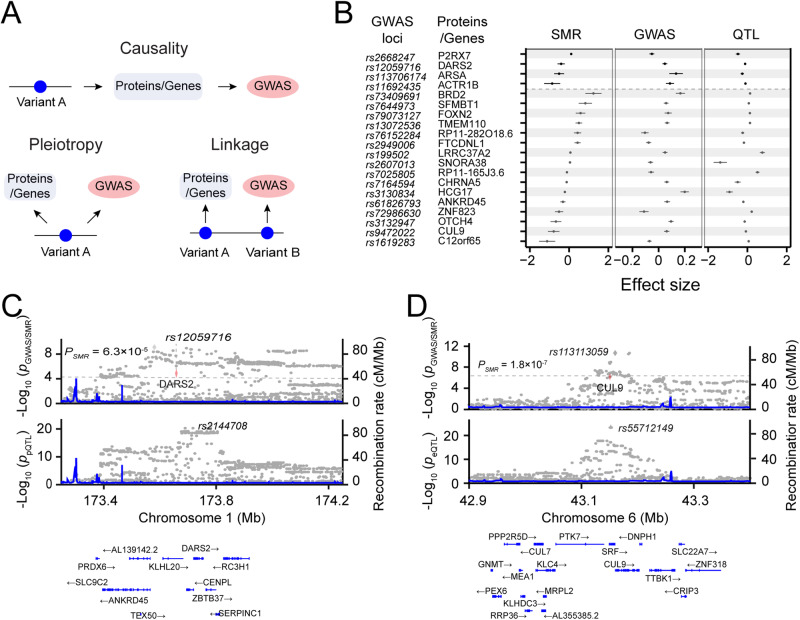
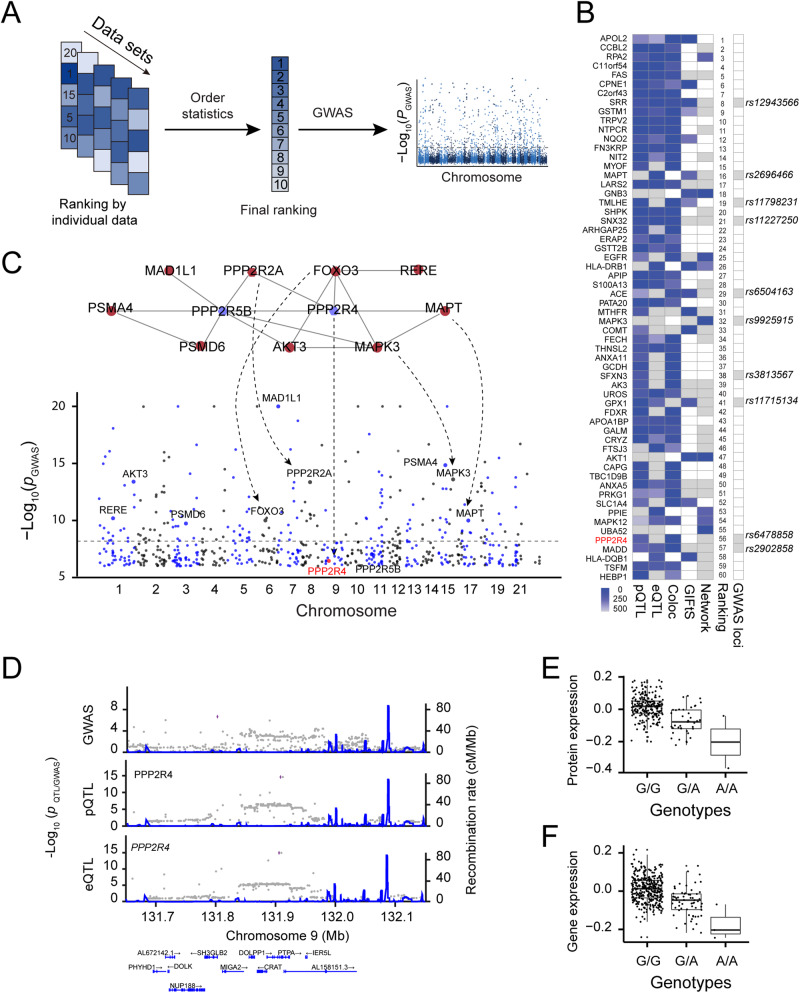
Psychiatric disorders are highly heritable yet polygenic, potentially involving hundreds of risk genes. Genome-wide association studies have identified hundreds of genomic susceptibility loci with susceptibility to psychiatric disorders; however, the contribution of these loci to the underlying psychopathology and etiology remains elusive. Here we generated deep human brain proteomics data by quantifying 11,608 proteins across 268 subjects using 11-plex tandem mass tag coupled with two-dimensional liquid chromatography-tandem mass spectrometry. Our analysis revealed 788 cis-acting protein quantitative trait loci associated with the expression of 883 proteins at a genome-wide false discovery rate <5%. In contrast to expression at the transcript level and complex diseases that are found to be mainly influenced by noncoding variants, we found protein expression level tends to be regulated by non-synonymous variants. We also provided evidence of 76 shared regulatory signals between gene expression and protein abundance. Mediation analysis revealed that for most (88%) of the colocalized genes, the expression levels of their corresponding proteins are regulated by cis-pQTLs via gene transcription. Using summary data-based Mendelian randomization analysis, we identified 4 proteins and 19 genes that are causally associated with schizophrenia. We further integrated multiple omics data with network analysis to prioritize candidate genes for schizophrenia risk loci. Collectively, our findings underscore the potential of proteome-wide linkage analysis in gaining mechanistic insights into the pathogenesis of psychiatric disorders.


Conflict of interest statement

The authors declare no competing interests.

Figures

Fig. 1
Fig. 1. Schematic diagram showing the experimental design and analysis pipeline used in this study.
A Postmortem brain samples from a human cohort with 268 participants were used, including 198 normal individuals (CTR), 45 patients with schizophrenia (SCZ), and 25 patients with bipolar (BP). B Deep brain proteome was profiled by 11-plex TMT-based proteomics, followed by extensive quality control and data analysis. Brain proteomic data and comparable genotype data were prepared for subsequent linkage analysis. C Genome-wide association analysis to identify genetic regulations of protein expression and gene expression. D Co-localization analysis to investigate the same variant underlying cis-eQTLs and cis-pQTLs. E Mediation analysis to identify transcript-dependent and -independent regulations and causality analysis to link eGenes and pGenes to SCZ GWAS loci. F Prioritization of proteins for SCZ GWAS loci.
Fig. 2
Fig. 2. Deep profiling of human brain proteome.
A Workflow of 11-plex TMT-based proteome analysis. A total of 10 samples and 1 internal standard (i.e., 10 pooled samples) were analyzed by LC/LC-MS/MS. MS raw data were analyzed using JUMP software. B Stacked Venn diagram showing the numbers of proteins identified in all 268 samples. C Histogram showing the coverage of quantified proteins across 29 batches of TMT experiments. D Histogram showing the coverage of proteomic data compared to RNA-seq data. The open bar represents the distribution of protein-coding genes detected by RNA-seq, the light blue bar indicates the distribution of protein-coding genes from proteomic data, and the navy bar indicates the distribution of protein-coding genes from no missing value proteomic data. Protein coverage is defined as the determination of whether a transcript is expressed in one or more samples. E Scatter plot showing a comparison of gene expression levels and protein abundance. Expression levels are averaged across all samples. F Distribution of coefficient of variation (CV) for all proteins across all samples.
Fig. 3
Fig. 3. Genetic regulation of the brain proteome.
A Circos plot showing genome-wide cis-pQTLs. Significant cis-pQTLs (q < 0.05) are highlighted in red color. B Scatter plot showing the relationship between minor allele frequency (MAF) and effect size of significant cis-pQTLs. SCZ risk genes with a large effect size (β > 0.5) are also labeled in the plot. C Stacked bar chart illustrating the proportions of each class of QTLs found in different genomic regions. D LocusZoom plot illustrating the colocalization of cis-eQTL, cis-pQTL, and GWAS locus.
Fig. 4
Fig. 4. Co-localized QTLs modulating the expression levels of genes and proteins.
A Ternary plot showing colocalization posterior probabilities of QTLs of gene and protein expression. We considered H0 + H1 + H2 as evidence for the lack of test power. H0: no causal variant, H1: causal variant for PD GWAS only, H2: causal variant for QTL only, H3: two distinct causal variants, H4: one common causal variant. B Scatter plot showing the distribution of effect sizes of 76 matched SNP-eQTLs and SNP-pQTLs colocalized pairs. C LocusZoom plot showing a colocalized QTL regulating SRR gene and protein expression. D Box plot showing normalized SRR protein expression and its cis-pQTL allele dosage. E Box plot showing normalized SRR gene expression and its cis-eQTL allele dosage.
Fig. 5
Fig. 5. Genetic regulation of protein expression mediated by mRNA.
A Two mediation models of protein expression: transcription-dependent protein regulation and transcription-independent protein regulation. B Scatter plot showing negative log-transformed p values of cis-pQTL before and after conditioning on mRNA. C Box and whisker plot showing Pearson correlation coefficient between expression levels of proteins and transcripts in both transcript-mediated and transcript-independent groups. The plot shows the mean (horizontal lines), 5th–95th percentile values (boxes), and SEM (whiskers). D Box and whisker plot showing effect sizes of transcription-dependent and transcription-independent regulations. E An example of transcription-dependent regulation is exemplified by TRPV2. LocusZoom plots show a significant localization of cis-pQTL (top) and cis-eQTL (bottom). The inset shows the scatter plot of a high correlation (r = 0.70) between the expression of gene and protein. F Transcription-independent regulation is exemplified by GLRX5. LocusZoom plots show a significant cis-pQTL but not a cis-eQTL. The inset shows the scatter plot of a low correlation (r = 0.10) of GLRX5 expression levels between gene and protein.
Fig. 6
Fig. 6. Causal relationship between pGenes and SCZ.
A Schematic diagram showing three putative mechanistic controls of a QTL: causality, pleiotropy, and genetic linkage. B Forest plots showing effect sizes of 4 and 19 SCZ GWAS loci causally controlled by pGenes and eGenes, respectively. The causality relationship was estimated by the SMR/HEIDI method. Center values mark effect size point estimates, error bars the 95% confidence intervals. C LocusZoom plot showing an example of an SCZ GWAS is controlled by a cis-pQTL. D LocusZoom plot showing an example of an SCZ GWAS is controlled by a cis-eQTL.
Fig. 7
Fig. 7. Prioritization of candidate genes for SCZ GWAS loci by integrating multiple data sets.
A Schematic diagram of candidate gene prioritization using order statistics. B Heatmap showing the top 60 proteins ranked by combining five data sets. The missing values are indicated by white boxes. C Network-based reprioritizing candidate genes for SCZ GWAS associations with small effect. Sub-network (top) was derived from the STRING PPI network. Significant GWAS risk genes are indicated by red nodes, whereas candidate genes (PPP2R4 and PPP2R5B) for suggestive GWAS loci are indicated by blue nodes. D LocusZoom plot showing a SCZ GWAS locus (rs6478858), a colocalized QTL regulating PPP2R4 gene and protein expression levels. E Box plot showing normalized SRR protein expression and its cis-pQTL allele dosage. F Box plot showing normalized SRR gene expression and its cis-eQTL allele dosage.

References

    1. Cardno AG, Owen MJ. Genetic relationships between schizophrenia, bipolar disorder, and schizoaffective disorder. Schizophr Bull. 2014;40:504–15. - PMC - PubMed
    1. Sullivan PF, Agrawal A, Bulik CM, Andreassen OA, Borglum AD, Breen G, et al. Psychiatric genomics: an update and an agenda. Am J Psychiatry. 2018;175:15–27. - PMC - PubMed
    1. Saha S, Chant D, Welham J, McGrath J. A systematic review of the prevalence of schizophrenia. PLoS Med. 2005;2:e141. - PMC - PubMed
    1. Merikangas KR, Jin R, He JP, Kessler RC, Lee S, Sampson NA, et al. Prevalence and correlates of bipolar spectrum disorder in the world mental health survey initiative. Arch Gen Psychiatry. 2011;68:241–51. - PMC - PubMed
    1. Carvalho AF, Firth J, Vieta E. Bipolar disorder. N Engl J Med. 2020;383:58–66. - PubMed

MeSH terms

LinkOut - more resources