. 2024 May 9;7(1):106.
doi: 10.1038/s42004-024-01187-2.

Deciphering the factors influencing electric field mediated polymerization and depolymerization at the solution-solid interface

Affiliations

Deciphering the factors influencing electric field mediated polymerization and depolymerization at the solution-solid interface

Zhinan Fu et al. Commun Chem. .

Abstract

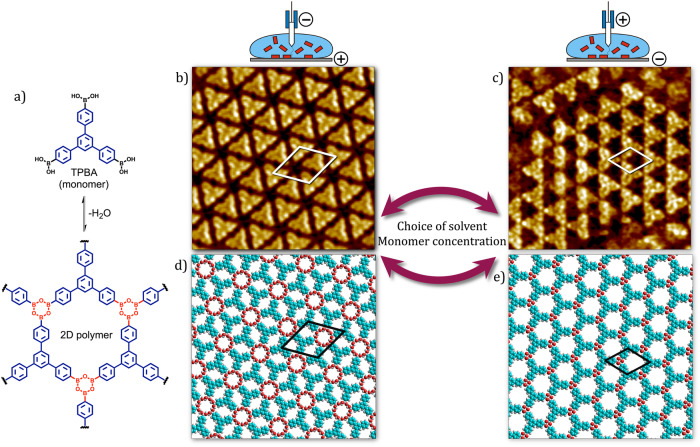
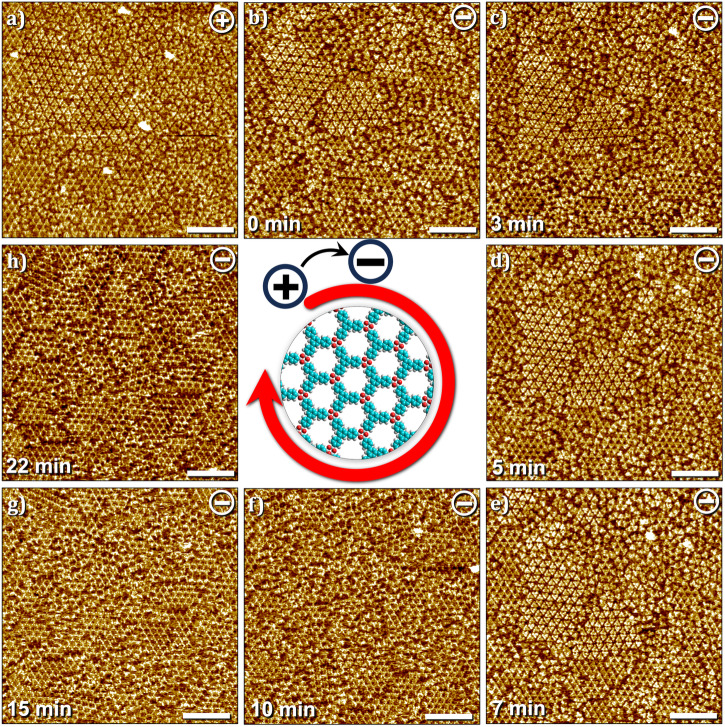
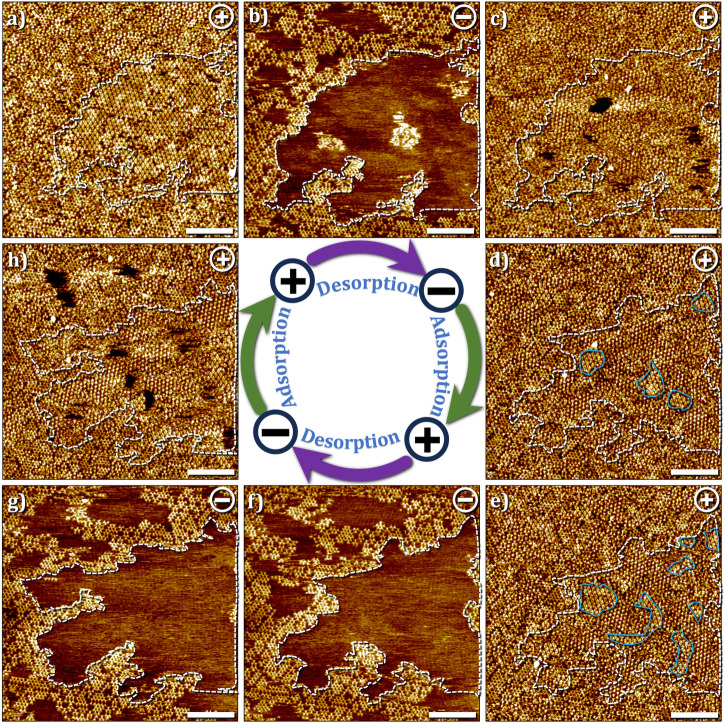
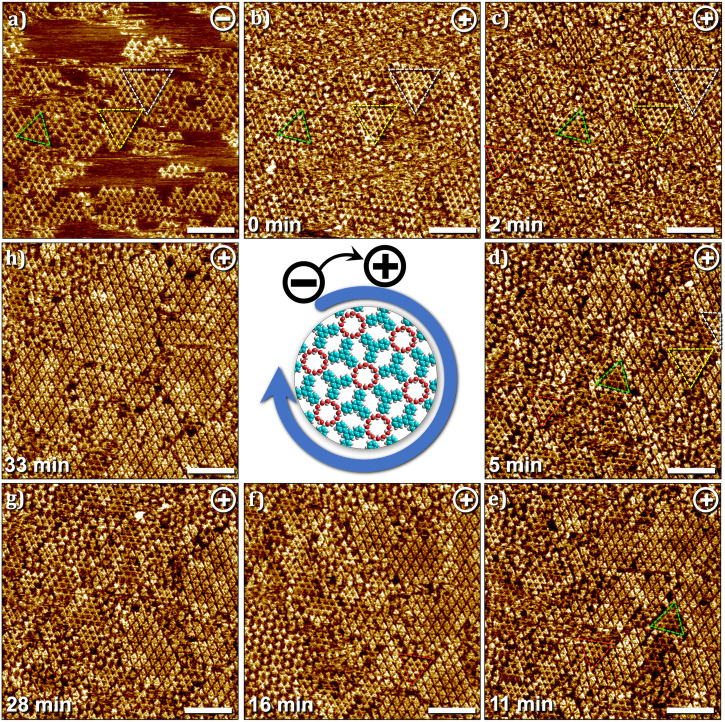
Strong and oriented electric fields are known to influence structure as well as reactivity. The strong electric field (EF) between the tip of a scanning tunneling microscope (STM) and graphite has been used to modulate two-dimensional (2D) polymerization of aryl boronic acids where switching the polarity of the substrate bias enabled reversible transition between self-assembled molecular networks of monomers and crystalline 2D polymer (2DP) domains. Here, we untangle the different factors influencing the EF-mediated (de)polymerization of a boroxine-based 2DP on graphite. The influence of the solvent was systematically studied by varying the nature from polar protic to polar aprotic to non-polar. The effect of monomer concentration was also investigated in detail with a special focus on the time-dependence of the transition. Our experimental observations indicate that while the nucleation of 2DP domains is not initiated by the applied electric field, their depolymerization and subsequent desorption, are a consequence of the change in the polarity of the substrate bias within the area scanned by the STM tip. We conclude that the reversible transition is intimately linked to the bias-induced adsorption and desorption of the monomers, which, in turn, could drive changes in the local concentration of the monomers.


Conflict of interest statement

The authors declare no competing interests.

Figures

Fig. 1
Fig. 1. Bias-induced polymerization and depolymerization at the solution–solid interface.
a Schematic showing the 2D polymerization TPBA. STM images depicting the bias-dependent polymerization and depolymerization of TPBA at the OA–graphite interface. At positive substrate bias, a SAMN is formed (b, 11 nm × 11 nm) whereas at negative bias, the formation of boroxine-linked 2D polymer (c, 11 nm × 11 nm) is observed. The bias-induced (de)polymerization also depends on the choice of the solvent and the concentration of monomers in the solution. Corresponding molecular models for SAMN (d) and 2DP (e).
Fig. 2
Fig. 2. Bias-induced (de)polymerization of TPBA at the HA–graphite interface.
a SAMN formed at positive sample bias. Imaging conditions: Iset = 0.1 nA, Vbias = + 0.7 V. White circles highlight the presence of small islands of 2DP in between the SAMN domains. b Boroxine-linked 2DP at the negative substrate bias. Imaging conditions: Iset = 0.1 nA, Vbias = –0.7 V. [TPBA] = 250 μM, scale bar = 20 nm.
Fig. 3
Fig. 3. Bias-induced (de)polymerization of TPBA at the polar aprotic solvent-graphite interface.
Bias-induced (de)polymerization of TPBA at the MO–graphite (a, b) and TCB–graphite (c, d) interface. a SAMN formed at the MO–graphite interface with small islands of the 2DP (white arrows) in between the SAMN domains at positive sample bias. b 2DP formed at negative bias. c SAMN formed at the TCB–graphite interface at positive sample bias. d Co-existence of 2DP and SAMN at the TCB–graphite interface at negative sample bias. We hypothesize that the SAMN is formed on top of the 2DP which is adsorbed on the graphite surface. See also Fig. S4 in the supplementary information. Imaging conditions: Iset = 0.1 nA, Vbias = – 0.7 V or + 0.7 V. [TPBA] = 250 μM, Image size = 100 × 100 nm2, scale bar = 20 nm.
Fig. 4
Fig. 4. Time-dependence of depolymerization within and outside of the scanned area at the HA–graphite interface at [TPBA] = 250 μM.
a Relatively large scale STM image showing domains of 2DP within the scanned area (100 × 100 nm2, scale bar = 20 nm). b Smaller scan within the highlighted area in (a) immediately after switching the sample bias from negative to positive. bg Sequential STM images obtained in the same general area as (a) showing the local depolymerization process (50 × 50 nm2, scale bar = 10 nm). h A larger scale image obtained after zooming out from (g) shows the locally depolymerized region (white square). The region outside of the scanned area still shows the presence of 2DP (100 × 100 nm2, scale bar = 20 nm). Imaging conditions: Iset = 0.1 nA, Vbias = –0.7 V or +0.7 V. Similar local depolymerization was also observed when OA was used as the solvent (see Fig. S8 in the Supplementary information).
Fig. 5
Fig. 5. Time-dependence of polymerization within the scanned area at the OA–graphite interface at [TPBA] = 250 μM.
Starting with a mixed composition of SAMN and 2DP in (a) this image sequence shows how the domains of SAMN are removed upon scanning at negative bias (be) with subsequent formation of 2DP (fh). (50 × 50 nm2, scale bar = 10 nm). Imaging conditions: Iset = 0.1 nA, Vbias = –0.7 V or +0.7 V.
Fig. 6
Fig. 6. Adsorption–desorption dynamics of TPBA monomers at the HA–graphite interface.
ah Sequential STM images obtained in approximately the same area showing the instantaneous and reversible desorption and adsorption of TPBA monomers at the HA–graphite interface. As evident from the sequence, desorption of monomers occurs at negative bias while the domains of 2DP and the network of hydrogen-bonded trimers remain on the surface (white dashed lines, ab, ef). On the other hand, a change in the sample bias from negative to positive leads to instantaneous re-adsorption of the monomers (bc, gh), although the monomer assembly is relatively amorphous. This amorphous structure transforms into ordered domains if the scanning is continued at positive sample bias (area highlighted in blue, cde). (100 × 100 nm2, scale bar = 20 nm). Imaging conditions: Iset = 0.1 nA, Vbias = – 0.7 V or + 0.7 V. [TPBA] = 25 μM. (see also Fig. S11 in the supplementary information).
Fig. 7
Fig. 7. Depolymerization dynamics at the HA–graphite interface.
ah Sequential STM images showing the gradual removal of the 2DP domains from the surface of graphite and the concomitant adsorption of TPBA monomers and growth of SAMN domains at the HA–graphite interface. As evident from the image sequence, the 2DP domains between those marked by colored triangles gradually shrink and are removed from the surface. The position of marked triangles shifts in subsequent images due to the drift of the scanner which is larger in this sequence. Imaging conditions: Iset = 0.1 nA, Vbias = – 0.7 V or + 0.7 V. [TPBA] = 25 μM. (see also Fig. S12 in the supplementary information).

References

    1. Tan KT, et al. Covalent organic frameworks. Nat. Rev. Methods Prim. 2023;3:1. doi: 10.1038/s43586-022-00181-z. - DOI
    1. Evans AM, et al. Two-dimensional polymers and polymerizations. Chem. Rev. 2022;122:442–564. doi: 10.1021/acs.chemrev.0c01184. - DOI - PubMed
    1. Qian C, et al. Imine and imine-derived linkages in two-dimensional covalent organic frameworks. Nat. Rev. Chem. 2022;6:881–898. doi: 10.1038/s41570-022-00437-y. - DOI - PubMed
    1. Segura JL, Mancheno MJ, Zamora F. Covalent organic frameworks based on Schiff-base chemistry: synthesis, properties and potential applications. Chem. Soc. Rev. 2016;45:5635–5671. doi: 10.1039/C5CS00878F. - DOI - PubMed
    1. Côté AP, et al. Porous, crystalline, covalent organic frameworks. Science. 2005;310:1166–1170. doi: 10.1126/science.1120411. - DOI - PubMed