. 2024 May;30(5):1349-1362.
doi: 10.1038/s41591-024-02895-x. Epub 2024 May 9.

Single-cell transcriptomic analyses reveal distinct immune cell contributions to epithelial barrier dysfunction in checkpoint inhibitor colitis

Affiliations

Single-cell transcriptomic analyses reveal distinct immune cell contributions to epithelial barrier dysfunction in checkpoint inhibitor colitis

Molly Fisher Thomas et al. Nat Med. 2024 May.

Abstract

Immune checkpoint inhibitor (ICI) therapy has revolutionized oncology, but treatments are limited by immune-related adverse events, including checkpoint inhibitor colitis (irColitis). Little is understood about the pathogenic mechanisms driving irColitis, which does not readily occur in model organisms, such as mice. To define molecular drivers of irColitis, we used single-cell multi-omics to profile approximately 300,000 cells from the colon mucosa and blood of 13 patients with cancer who developed irColitis (nine on anti-PD-1 or anti-CTLA-4 monotherapy and four on dual ICI therapy; most patients had skin or lung cancer), eight controls on ICI therapy and eight healthy controls. Patients with irColitis showed expanded mucosal Tregs, ITGAEHi CD8 tissue-resident memory T cells expressing CXCL13 and Th17 gene programs and recirculating ITGB2Hi CD8 T cells. Cytotoxic GNLYHi CD4 T cells, recirculating ITGB2Hi CD8 T cells and endothelial cells expressing hypoxia gene programs were further expanded in colitis associated with anti-PD-1/CTLA-4 therapy compared to anti-PD-1 therapy. Luminal epithelial cells in patients with irColitis expressed PCSK9, PD-L1 and interferon-induced signatures associated with apoptosis, increased cell turnover and malabsorption. Together, these data suggest roles for circulating T cells and epithelial-immune crosstalk critical to PD-1/CTLA-4-dependent tolerance and barrier function and identify potential therapeutic targets for irColitis.


Conflict of interest statement

From August 9, 2021, B.L. is an employee of Genentech. M.D. has received consulting fees from Genentech, Partner Therapeutics, SQZ Biotech, AzurRx, Eli Lilly, Mallinckrodt Pharmaceuticals, Aditum, Foghorn Therapeutics, Palleon, Sorriso Pharmaceuticals, Generate Biomedicines, Asher Bio, Neoleukin Therapeutics, Moderna, Alloy Therapeutics, Third Rock Ventures, DE Shaw Research, Agenus, and Curie Bio; he is a member of the Scientific Advisory Board for Veravas, Monod Bio, Axxis Bio, and Cerberus Therapeutics. R.J.S. is a consultant to BMS, Marengo, Merck, Novartis, Pfizer, and Replimune. H.K. received research funding from Pfizer and Takeda. H.J. received consulting fees from Aditium Bio, Abbvie, and Takeda. H.J. serves on scientific advisory board of Vivante Health. D.J. reports grants and personal fees from Novartis, Genentech, Syros, Eisai. D.J. reports personal fees from Vibliome, PIC Therapeutics, Mapkure, Relay Therapeutics. D.J. reports grants from Pfizer, Amgen, InventisBio, Arvinas, Takeda, Blueprint, AstraZeneca, Ribon Therapeutics, Infinity that are outside the submitted work. G.M.B. has sponsored research agreements through her institution with: Olink Proteomics, Teiko Bio, InterVenn Biosciences, Palleon Pharmaceuticals. G.M.B. served on advisory boards for: Iovance, Merck, Nektar Therapeutics, Novartis, and Ankyra Therapeutics. G.M.B. consults for: Merck, InterVenn Biosciences, Iovance, and Ankyra Therapeutics. She holds equity in Ankyra Therapeutics. KP is a consultant to Santa Ana Bio. N.H. holds equity in and advises Danger Bio/Related Sciences, is on the scientific advisory board of Repertoire Immune Medicines and CytoReason, owns equity and has licensed patents to BioNtech, and receives research funding from Bristol Myers Squibb and Calico Life Sciences. KLR has received advisory board fees from SAGA diagnostics and institutional research support from BMS. A.C.V. received consulting fees from Merck and BMS. A.C.V. has a financial interest in 10X Genomics. The company designs and manufactures gene sequencing technology for use in research, and such technology is being used in this research. Dr. Villani’s interests were reviewed by The Massachusetts General Hospital and Mass General Brigham in accordance with their institutional policies. M.F.T., K.S., K.M., P.S., N.S., J.T., M.N., L.Z., N.P.S., A.T., S.R., B.Y.A., L.T.N., J.H.C., T.E., Y.S., K.H.X., V.J., C.J.P., T.S., R.G., P.Y.C., do not have competing interest to declare.

Figures
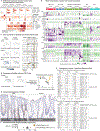
Extended Data Figure 1.
Extended Data Figure 1.. Detailed cell type composition of each donor for immune cells from colon tissue.
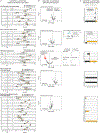
(A) Estimated number of cells per biopsy in each CD8 T/GDT/NK cell cluster for cases (n=5) and controls (n=7). (B) Detailed composition of each patient across cell clusters for CD8 T/GDT/NK cells. (C) Estimated number of cells per biopsy in each CD4 T cell cluster for cases (n=5) and controls (n=7). (D) Detailed composition of each patient across cell clusters for CD4 T cells. Cell clusters depicted with different colors in UMAP embeddings of the (E) eight mononuclear phagocyte subsets and (G) 13 B cell subsets from colon tissue. Detailed composition of each patient across cell clusters for (F) mononuclear phagocytes and (H) B cells from colon tissue. For panels B, D, F, and H, every column represents one individual donor referenced, labeled at the bottom of the heatmap. Boxplots show median and interquartile range. Heatmap color indicates percent of a patient’s cells assigned to each cell cluster. NK natural killer. GDT gamma delta T cells. Related to Figures 2–4.
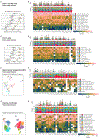
Extended Data Figure 2.
Extended Data Figure 2.. Tissue cell type abundance associated with control patients on anti-PD-1 versus no therapy.
(A) Abundance analysis of tissue cell clusters in control patients on anti-PD-1 therapy (n=4) versus healthy controls not on ICI therapy (n=8) (i.e., those undergoing screening colonoscopy). Each dot represents a patient. Composition of each donor is reported as a percent of cells from each patient in each cluster, and box plots show median and interquartile range. Error-bars indicate logistic regression OR 95% CI for differential abundance of cells from controls on anti-PD-1 versus healthy controls not on ICI therapy for each cell cluster. Unadjusted likelihood ratio test p-values are shown. MNP cell cluster 8 was detected in only one patient in the control anti-PD-1 group, so the logistic regression model was not fit for this cluster. (B) Volcano plots show log fold-change (x-axis) and negative log10 P-value (two-sided) (y-axis) for each gene. Number of differentially expressed genes (FC > 1.5 and FDR < 10%) is shown, and some of the top genes are labeled. ADAR expression is shown for cluster 9 CD4 Tregs. Dots represent individual patients. Feature plots for HLA-DOB and ATP11A expression in MP cells is shown. (C) Number of differentially expressed genes in each cell cluster (FC > 1.5 and FDR < 10%).
Extended Data Figure 3.
Extended Data Figure 3.. TCR and BCR detection and diversity analysis for immune cells from colon tissue and paired blood specimens.
UMAP embedding with color depicting cells with TCR (A, B, E, F) or BCR (C, D) are shown (left most column) for (A) CD8 T cells from colon tissue, (B) CD4 T cells from colon tissue (C) B cells from colon tissue (D) B cells from blood, (E) CD4 T cells from blood, and (F) CD8 T cells from blood. TCR (A, B, E, F) or BCR (C, D) diversity plots are shown in the remaining three columns including the number of distinct clones per patient (second column from the left), cumulative percent of cells with the top N unique TCR or BCR clones (second column from the right), and Hill diversity index (right most column). Related to Figures 2 and 4.
Extended Data Figure 4.
Extended Data Figure 4.. Detailed analysis of CD8 T/Gamma Delta T/NK cells and CD4 T cells from blood
(A) UMAP embedding, (B) normalized gene expression, and (C) cell subset abundance difference between irColitis cases and controls for CD8 T/GDT/NK cells. (D) Percent of alpha beta CD8 T cell TCR clones shared between paired blood and tissue for each individual patient. Dots represent patients. irColitis case versus control two-sided t-test p-value is shown. (E) Volcano plot of pseudobulk differential gene expression with all cells for the contrast of irColitis cases versus controls for CD8 T/GDT/NK cells. The x-axis indicates the fold-change and y-axis indicates negative log10 p-value (two-sided) reported by limma. (F) Spearman correlation between each cluster and each of the reported CD8 T cell subsets from Giles et al, Immunity, 2022. (G) UMAP embedding, (H) normalized gene expression, and (I) cell subset abundance difference between irColitis cases and controls for CD4 T cells. (J) Volcano plot of pseudobulk differential gene expression with all cells for the contrast of irColitis cases versus controls for CD4 T cells. (K) Spearman correlation between each cluster and each of the reported CD4 T cell subsets from Giles et al, Immunity, 2022. Panels B, H show normalized gene expression (mean zero, unit variance) for selected genes, showing relative expression across cell clusters. Panels C, I show cell subset abundance differences between irColitis cases in orange and controls in gray, unadjusted likelihood ratio test p-values. Boxplots show median and interquartile range of patient cell type compositions where each dot represents a patient. The cellular composition of each patient is reported as the percentage of cells from a patient in each cell cluster. Error-bars indicate logistic regression OR 95% CI for differential abundance of cells from irColitis cases for each cell cluster. GDT gamma delta T cell. NK natural killer. Related to Figure 4.
Extended Data Figure 5.
Extended Data Figure 5.. Detailed analysis of MP cells from colon tissue.
(A) UMAP embedding of 2,242 MP cells. Colors indicate cell cluster identities, which are listed on the right. (B) Normalized expression (mean zero, unit variance) of selected genes showing relative expression across cell clusters. Heatmap rows are aligned to every cluster defined in the UMAP. (C) Cell subset abundance differences between cases in orange (n=13) and controls in gray (n=14) across all MP cell subsets. Boxplots show patient cell type compositions where each dot represents a patient. Mononuclear phagocyte composition of each patient is reported as the percent of cells from a patient in each cell cluster, and box plots show median and interquartile range. Error bars indicate logistic regression 95% CI of OR for differential abundance of case cells for each cell cluster, and unadjusted likelihood ratio test p-values are shown. (D) Volcano of pseudobulk differential gene expression with all cells for the contrast of irColitis cases versus controls. The x-axis indicates the fold-change and y-axis indicates negative log10 p-value reported by limma (two-sided). (E) Bar plots showing differentially expressed (DE) genes per MP cluster (fold-change > 1.5 and FDR < 5%). (F) MP cell gene expression fold-change and log2CPM for cases (orange) and controls (black) is reported for selected genes across T cells (left and middle columns). Heatmap color indicates FC differences between irColitis cases and controls (right column). White dot indicates FDR < 5%. Panels show representative genes across multiple biological themes. (G) Gene expression for PD-1 ligands PD-L1 (CD274) and PD-L2 (PDCD1LG2) in each respective UMAP embedding (left panels). Estimated fold-changes between case and control for each myeloid cell cluster (middle). Gene expression values for the cells from each patient in each myeloid cell cluster where dots represent individual patients (right). Error bars show 95% CI and box plots show median and interquartile range. Related to Figure 1.
Extended Data Figure 6.
Extended Data Figure 6.. Detailed analysis of B cells from colon tissue.
(A) UMAP embedding of 40,352 B cells. Colors indicate cell cluster identities, which are listed on the right. (B) Normalized expression (mean zero, unit variance) of selected genes showing relative expression across cell clusters. Heatmap rows are aligned to every cluster defined in the UMAP. (C) Cell subset abundance differences between cases in orange (n=13) and controls in gray (n=14) across all B cell subsets. Boxplots show patient cell type compositions where each dot represents a patient. B cell composition of each patient is reported as the percent of cells from a patient in each cell cluster. Error-bars indicate 95% CI of logistic regression OR for differential abundance of case cells for each cell cluster, and unadjusted likelihood ratio test p-values are shown. (D) Volcano of pseudobulk differential gene expression with all B cells for the contrast of irColitis cases versus controls. The x-axis indicates the fold-change and y-axis indicates negative log10 p-value reported by limma. (E) Bar plots showing differentially expressed (DE) genes per B cluster (fold-change greater than 1.5 and FDR less than 5%). (F) Ratio of IgG to IgA plasma cells across individual irColitis cases and controls. Each dot represents an individual patient. P-value for Wilcoxon rank sum test is shown. (G-H) irColitis in a B cell-depleted patient receiving ICI therapy for lymphoma. (G) Multispectral immunofluorescence staining of fixed colon mucosal tissue from patient C14* with a 7-color panel: DAPI (blue), panCK (gray), CD8A (aqua), PD-1 (orange), FOXP3 (yellow), CD68 (pink), and PD-L1 (green). (H) tSNE-embedding of 3,295 CD45+-sorted cells from a patient depleted of B cells. Cell cluster identity and top three AUC genes in parentheses are shown. MP: mononuclear phagocyte. Box plots show median and interquartile range. Related to Figure 1.
Extended Data Figure 7.
Extended Data Figure 7.. Detailed analysis of epithelial and mesenchymal cells from tissue.
(A) Detailed composition of each patient across cell clusters for epithelial and mesenchymal nuclei from colon tissue. Heatmap color indicates percent of a patient’s cells assigned to each cell cluster. Every column represents one individual donor, referenced at the bottom of the heatmap. Upper right panel shows unique cell clusters depicted with different colors in UMAP embedding, which match the color scheme of the cell subset identities listed on the right side of the heatmap. (B) Schematic representing computationally-predicted cell-cell interactions between T cells expressing PD-1 (PDCD1) and cells expressing the PD-1 receptors PD-L1 (CD274) and PD-L2 (PDCD1LG2) (top cartoon). Three middle panels show differential expression analysis of means of gene pairs in indicated tissue cell types with cases (orange) and controls (black). Dots represent individual patients. Box plots show median and interquartile range. Limma fold-changes (FC) and two-sided p-values are shown. Bottom panels show feature plots of gene expression (Log2CPM) level in the UMAP embedding for MP cells from Extended Data Fig. 5A (left two panels) and CD8/GDT/NK cells from Fig. 2A (right two panels) presented separately for cells from cases and controls. Number and percentage of cells (from cases or from controls) with detected expression are reported at the bottom of each feature plot. (C) Feature plots use color to indicate gene expression (Log2CPM) level for selected epithelial and mesenchymal genes in the UMAP embedding in panel A. Number and percentage of nuclei with detected expression of each candidate gene are reported at the bottom of each feature plot. (D) FC, 95% CI, and gene expression (Log2CPM) (two left columns) for cases (orange) (n=12) and controls (black) (n=14) is reported for a set of genes organized across 7 biological themes. Heatmap (five right columns) indicates FC differences between cases and controls. White dot indicates FDR < 5%. (E) Feature plots show gene expression in nuclei from cases (left) and controls (right) using UMAP embedding in panel A. All feature plots shown in panels B, C, and E use color to indicate gene expression (Log2CPM). Number and percentage of cells with detected expression of each candidate gene are reported at the bottom of each feature plot. Related to Figure 5.
Extended Data Figure 8.
Extended Data Figure 8.. Receptor-ligand interactions predict altered cellular communication in irColitis
(A) Schematic of cell-cell communication inference. Predicted communication between two cell types is defined as proportional to the transcript levels of ligand and receptor genes in the two cell types. (B) Left: PDCD1 (log2CPM) (encoding PD-1) in tissue CD8 T cells (x-axis) and CD274 (encoding PD-L1) in epithelial and mesenchymal nuclei (y-axis). Right: Gene expression of PDCD1 and its ligands CD274 and PDCD1LG2 (encoding PD-L2) across blood immune cell types (top panels) and tissue immune, epithelial, and mesenchymal cells/nuclei (epi./mes.) (lower panels). Error-bars show 95% CI of fold-changes (black indicates FDR < 5%), cases (orange) and controls (black). Box plots show median and interquartile range. (C) Gene expression for ligand-receptor gene pairs, dots represent patients. X-axis indicates expression of HAVCR2, ITGB2, ITGAL, IL17A, IL26, CXCL13 in CD8 T cluster 3 cells (top row) or cluster 5 cells (bottom row). Y-axis indicates expression in epithelial cluster 2 cells (CEACAM1, ICAM1, IL17RA, IL17RC, IL20RA, IL10RB) or CD4 T cluster 6 cells (CXCR5). Unadjusted p-value and FDR (q-value) from differential expression (t-test) of the mean of each gene pair between cases and controls. (D) Differential expression analysis of means of gene pairs, focusing on putative communication between CD8 T cell clusters from Figure 2A–B and other immune, epithelial, and mesenchymal cell lineages (Methods). Top: Tissue ITGB2HI circulatory (CD8-11, 3). Bottom: Activated effector CD8 TRM (ITGAEHI GZMBHI) (CD8-7, 2, 5). Heatmap color indicates FC between irColitis cases and controls. White dot indicates FDR < 5%. (E) DE analysis with five major tissue cell lineages (columns). Gene pairs are in five biological themes. White dots indicate FDR <5%. (F) Left: correlations of cell cluster abundances within cases (x-axis) and within controls (y-axis), signed Spearman p-values. Right: abundance of tissue CD8-5 cells (x-axis) vs E-18 cells (y-axis). (G) Left: correlations of cell cluster abundances (cases and controls), x-axis Spearman correlation, y-axis −log10 p-value. Right: abundance of tissue CD8-11 (x-axis) vs E-13 (y-axis). E/M: epithelial and mesenchymal nuclei, B: B cells, MP: mononuclear phagocytes, CD8: CD8 T/gamma delta T/NK cells, CD4: CD4 T cells. Related to Figures 2–5.
Extended Data Figure 9.
Extended Data Figure 9.. Spearman analysis of ligand-receptor gene pairs across multiple colon mucosal cell types.
(A) Volcano plot of Spearman correlations of percent of cells expressing pairs of genes, for all 10,101 gene-and-cell-type pairs (1,441 total unique gene pairs, tested for each pair of cell lineages). X-axis indicates correlation coefficient and y-axis p-value. (B) Number of gene pairs with FDR < 5% is depicted as an edge connecting each pair of cell lineages. Edge thickness and color is proportional to the number of gene pairs. (C) Spearman correlation of percent of cells with gene expression for selected pairs of genes for each pair of major cell lineages. (D) Heatmap color depicts the signed Spearman p-value for each pair of genes, for each pair of cell lineages. White dots indicate FDR < 5%. Columns indicate pairs of different cell lineages. E: epithelial and mesenchymal nuclei, B: B cells, MP: mononuclear phagocytes, CD8: CD8 T/GDT/NK cells, CD4: CD4 T cells. Pairs of genes in boldface are shown in panel (C). Related to Figures 2–5.
Extended Data Figure 10.
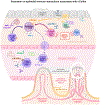
Extended Data Figure 10.. Illustration of epithelial-immune interactions associated with irColitis.
Cartoon illustrating the major findings of our study showing that irColitis is defined by the colon mucosal expansion of ITGAEHI CD8 TRM T cells expressing CXCL13 and Th17 gene programs, ITGB2Hi CD8 T cells that may recirculate, Tregs, CD4 T cells expressing CXCL13 and IL17A, and ISGHi MP cells. Putative ligand/receptor pathways that recruit circulating cells to the endothelium (CX3CR1-CX3CL1, ITGAL/ITGB2-ICAM-1/2, CXCR3-CXCL9/10/11) and retain expanded CD8 T cells in tissue (ITGAL/ITGB2-ICAM-1, CXCR3-CXCL9/10/11) are shown. Epithelial defects in irColitis include decreased stem cells, increased transit amplifying cells, and top crypt epithelial cells with marked upregulation of interferon-stimulated genes (ISGs), CASP1, ZBP1, ICAM1, CD274/PD-L1, and CXCL10/11 and downregulation of aquaporin (AQP) water channel genes. Mesenchymal alterations in irColitis are notable for increased endothelial cells. The white oval at the bottom right shows the part of the crypt depicted in greater detail in the upper part of the cartoon. Related to Figures 1–6.
Figure 1.
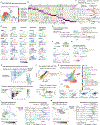
Figure 1.. Overview of checkpoint colitis cohort.
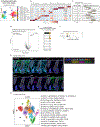
(A) Sample processing pipeline overview. Mucosal colonic biopsies along with paired serum and PBMC specimens were collected from patients at the time of endoscopy. From biopsies, we performed single-nuclei RNA-sequencing (snRNA-seq) and single-cell RNA-sequencing (scRNA-seq) with paired T cell receptor (TCR) and B cell receptor (BCR) sequencing. The uniform manifold approximation and projection (UMAP) embedding panels on the right display clustering solutions for indicated cell lineages from tissue and blood sc/snRNAseq datasets. For every collection, biopsy specimens were also fixed for immunofluorescence microscopy of up to 11 markers. Secreted factors were measured by Luminex from the serum, and scRNA-seq with paired TCR, BCR, and CITE-seq was performed on PBMCs. CITE-seq: Cellular Indexing of Transcriptomes and Epitopes by Sequencing. (B) Patient cohort overview reporting the breakdown of samples from 29 patients by clinical meta-data and experimental approach. ICI: immune checkpoint inhibitor; irColitis: ICI-related colitis; CTCAE: Common Terminology Criteria for Adverse Events; SCC: Squamous cell carcinoma. (C) Representative flow cytometry plots of CD45+ immune cells and CD45+ CD3+ T cells from endoscopic colon mucosal biopsies (upper panels) along with the frequency of these respective cell populations across three different patient cohorts (second and third panels from the top). The absolute number of all cells/biopsy, CD45+ immune cells/biopsy, and CD45+ CD3+ T cells/biopsy are shown (three bottom rows). Cells per biopsy were normalized by using identically sized endoscopic biopsy forceps for all patient samples and averaging over 6–16 biopsies per patient (Table S5, Methods). Absolute CD45+ and CD45+ CD3+ cell percentages per biopsy were then estimated from total cell numbers using immune and T cell frequencies for each respective population defined by FACS. 95% confidence intervals and two-sided t-test p-values for fold-changes are shown. (D) Table with number of differentially abundant cell clusters (left) and differentially expressed genes (right) across sc/snRNA-seq blood and colon tissue datasets. GDT: gamma delta T cells; NK: natural killer cells. Parts of the figure were drawn by using pictures from Servier Medical Art. Servier Medical Art by Servier is licensed under a Creative Commons Attribution 3.0 Unported License.
Figure 2.
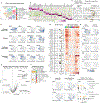
Figure 2.. Expanded ITGAEHi tissue-resident memory and ITGB2Hi CD8 T cell subsets in irColitis
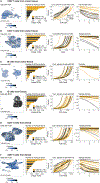
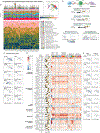
(A) Tissue UMAP of CD8 T/GDT/NK cells colored by identities and listed across major subsets: ITGB2HI, ITGAEHI, and mixed lineages. Arrows indicate direction of association. (B) Normalized gene expression (columns) across cell clusters (rows). (C,E) Cell abundance differences between (C) cases (orange; n=13) and controls (gray; n=14), and (E) controls (gray; n=12), cases on anti-PD-1 (orange; n=8) or anti-PD-1/CTLA-4 therapy (blue; n=4). (D,F,K) Gene expression (Log2CPM) in UMAP embedding, number and percentage of cells with detected expression. (F) Gene expression of DE genes between cases on anti-PD-1 (left) and anti-PD-1/CTLA-4 (right) therapy. (G) CD8T/GDT/NK pseudobulk expression level across controls (black dots), cases on anti-PD-1 (orange) or anti-PD-1/CTLA-4 (blue) therapy. Fold-change and unadjusted two-sided p-value. (H) Heatmap color indicates relative enrichment or depletion of shared TCRs between cluster pairs, normalized to the mean from shuffled data. White dot: permutation p-value<8×10⁻⁴. (I) Color indicates percent of shared TCR clones between cluster pairs. (J) Cumulative percent of cells with TCR clones, ranked by descending abundance. (K) Blood CD8 T/GDT/NK cells UMAP colored by identities and organized across four subsets, with marker gene UMAP plots (bottom). (L,M) Left: (L) tissue and (M) blood CD8 T/GDT/NK UMAP, arrows indicate enrichment or depletion of (L) blood TCRs in tissue and (M) tissue TCRs in blood. Middle: logistic regression OR for differential abundance of TCR clones observed in (L) tissue-only or in both blood and tissue, and (M) in blood-only or in both blood and tissue, red font indicates associated clusters. Right: percent of cells from each tissue cluster that do or do not share TCRs between tissue and blood. Likelihood ratio test p-values shown for clusters with FDR < 5%. (C,E,J,L,M) Box plots show median and interquartile range. Each dot represents one patient. Error-bars indicate logistic regression OR and 95% CI for differential abundance of case cells for each cell cluster. Unadjusted likelihood ratio test p-values.
Figure 3.
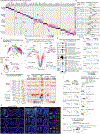
Figure 3.. IL26, IL17A, and CXCL13 are upregulated in colon mucosal ITGAEHi CD8 T cells in irColitis
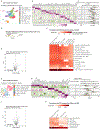
(A) Volcano plot of pseudobulk differential gene expression for all CD8 T, gamma delta T (GDT), and NK cells showing the contrast of irColitis cases (n=13) versus controls (n=14). The x-axis indicates fold-change and y-axis indicates the negative log10 p-value (two-sided) reported by limma. (B) Bar plots showing differentially expressed (DE) genes per CD8 T/GDT/NK cell cluster defined in Figure 2 and organized across 3 cellular subsets: ITGB2HI CD8 T cells, ITGAEHI CD8 T cells, and clusters with mixed cell lineages (FC > 1.5 and FDR < 5%). (C) FC and gene expression (log2CPM) for cases (orange) and controls (black) are reported for selected genes across colon tissue CD8 T and innate cytotoxic lymphocyte cell clusters (left and middle columns). Heatmap color indicates FC differences between irColitis cases and controls (right column). White dot indicates FDR < 5%. (D) Feature plots use color to indicate gene expression (Log2CPM) level in the UMAP embedding from figure 2A. Number and percentage of cells with detected expression of each candidate gene are reported at the bottom of each feature plot. (E) Multispectral fluorescence panel depicting the RNA expression level of CD3E (orange), IFNG (red), and CXCL10/11 (green), protein immunofluorescence of panCK (gray), and DAPI (blue) from one control subject in the upper panels and one irColitis case in the middle panels. Bottom right boxes highlight representative co-expression of CD3E and IFNG in the same T cell observed in tissue from one irColitis case. (F) Quantification of RNA (IFNG, CXCL10/11, CD3E) and protein (PanCK) signals from microscopy images. Fold-change (left column, where black color indicates FDR < 5% and unadjusted linear model p-value is shown) and frequency of cells positive for a given marker normalized to the area (cm2) of tissue (right column) for cases (orange) and controls (black). Dots represent individual patients and box plots show median and interquartile range. Error bars represent 95% CI intervals.
Figure 4.
Figure 4.. Expanded IL17A and CXCL13-expressing CD4 T cell effectors and TNFRSF4-expressing Tregs in patients with irColitis
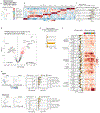
(A) UMAP embedding of CD4 T cells color coded according to cell cluster identities, which are bolded for cell subsets showing abundance differences in panel C. Arrows next to cluster numbers show the direction of observed abundance differences. (B) Normalized expression (mean zero, unit variance) of selected genes showing relative expression across cell clusters. Rows of the heatmap are aligned to each cluster. (C) Cell subset abundance differences between cases in orange (n=13) and controls in gray (n=14) across subsets. Boxplots show patient cell type compositions where each dot represents a patient. Composition of each patient is reported as the percent of cells from a patient in each cell cluster. Error-bars indicate 95% CI of logistic regression odds ratio for differential abundance of irColitis case cells for each cell cluster. Unadjusted likelihood ratio test two-sided p-values are shown. (D,H) Feature plots of candidate genes use color to indicate gene expression (Log2CPM) levels in the UMAP embedding from panel A. Number and percentage of cells with detected expression for each candidate gene are reported at the bottom of each feature plot. (E) Volcano plot of pseudobulk differential gene expression for all CD4 T cells showing the contrast of cases versus controls. The x-axis indicates fold-change and y-axis indicates the negative log10 p-value from limma. (F) Bar plots showing DE genes per CD4 T cell cluster defined in panel A (FC > 1.5 and FDR < 5%). (G) FC and gene expression (log2CPM) levels for cases (orange) and controls (black) is reported for selected genes across CD4 T cell clusters (left and middle columns). Heatmap color indicates FC differences between cases and controls (right column). White dot indicates FDR <5%. (H) Feature plots presented separately for cells from irColitis cases and controls. (I) GNLY and GZMA expression levels in cells from cases on anti-PD-1 or dual anti-PD-1/CTLA-4 therapy in the UMAP embedding from panel A. Dot plot shows pseudobulk expression where each dot represents all the CD8 T cells from a patient. Fold-change and p-value from limma for cases on dual anti-PD-1/CTLA-4 therapy versus anti-PD-1 monotherapy. Error bars represent 95% CI intervals, box plots show median and interquartile range.
Figure 5.
Figure 5.. Epithelial and mesenchymal remodeling in IrColitis
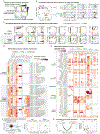
(A) Marker genes normalized relative expression for epithelial/mesenchymal subsets across five cellular families (left). (B) Error-bars indicate 95% CI of logistic regression OR for differential abundance between cases (orange; n=12) and controls (gray; n=14) for each subset, unadjusted likelihood ratio test p-values. (B,J) Boxplots show patient cell type composition reported as the percentage of nuclei from a patient in each cluster; each dot represents a patient. (C) UMAP of epithelial/mesenchymal subsets colored as in A, arrows showing direction of association. Inset shows nuclei binned into hexagons. Bin color represents fold enrichment of cells from cases. Crypt-axis score shown in UMAP (Methods). (D) Pseudobulk DGE volcano plot for all epithelial/mesenchymal nuclei for cases versus controls. X-axis indicates fold-change and y-axis the negative log10 p-value (limma). (E) Crypt-axis score boxplot for each cluster (left) (Methods). Bar plot depicts number of DE genes per subset (right) (FC>1.5 and FDR<5%), ordered as in A and B. (F,I) Feature plots show gene expression (log2CPM) level in cases (left) and controls (right) projected on panel C UMAP. Number and percentage of nuclei expressing each gene are reported. (G) FC and gene expression (log2CPM) (two left columns) for cases (orange) and controls (black) of genes organized by themes. Heatmap color indicates case vs. control FC differences. White dot indicates FDR < 5%. (H) Staining of colon mucosa from ICI-control (left) and a case (right) for DAPI (blue), panCK (gray), CD8A (aqua), FOXP3 (yellow), PD-1 (orange), PD-L1 (green), and CD68 (pink). Right panels highlight co-detection of PD-L1 +/− CD68 and PD-L1 +/− panCK in individual cells (1, 2), and co-detection of PD-1 +/− CD8A in individual cells (3, 4). (I) Left: DE genes between cases on anti-PD-1 (left) versus anti-PD-1/CTLA-4 therapy (right) across subsets. Right: Pseudobulk expression level of CXCL1, DUOX2, HIF1A, NOS2 in all epithelial/mesenchymal subsets stratified across: controls (black), cases on anti-PD-1 (orange) or anti-PD-1/CTLA-4 (blue) therapy. (J) Abundance analysis of endothelial nuclei (cluster 13) expressing VWF. Controls (black; n=13), cases on anti-PD-1 (orange; n=8) or anti-PD-1/CTLA-4 therapy (blue; n=4). (B,G,J) Box plots show median and interquartile range. Error bars represent 95% CI intervals.
Figure 6.
Figure 6.. Identification of putative therapeutic targets to treat irColitis and comparison of irColitis to diverse tumor immune microenvironments
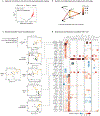
(A) Heatmap color depicts case versus control DGE fold-change for pairs of genes encoding targets of monoclonal antibodies for IBD (ustekinumab, anti-TNF, vedolizumab) in pair of cell lineages depicted in each column (E/M: epithelial and mesenchymal nuclei, B: B cells, MP: mononuclear phagocytes, CD8: CD8 T/gamma delta T/NK cells, CD4: CD4 T cells). White dots indicate FDR <5%. (B) Relative expression of candidate genes encoding IBD drug across biological themes labeled on the left (Table S13). Columns depict cell clusters organized by color-coded cell lineages – CD8 T/GDT/NK cells (red), CD4 T cells (blue), epithelial and mesenchymal cell types (green), MP cells (purple), and B cells (turquoise). Color scheme indicates scaled expression across cell types (pooled results from cases and controls). (C) Feature plots show gene expression (log2CPM) levels in cases (left) and controls (right) projected on Fig. 5C UMAP, highlighting endothelial cell cluster 13. Number and percentage of nuclei expressing each gene reported on each plot. Right-most panels show expression (log2CPM) of indicated genes. Controls in black, cases in orange. Each dot represents a patient, box plots show median and interquartile range. Composition of each donor is reported as a percent of nuclei from each patient in each cluster; box plots show median and interquartile range. (D) PCSK9 expression in nuclei from cases and controls (left). Percent of cells from each patient with PCSK9 in epithelial/mesenchymal cells and LDLR in CD8 T cells; each dot represents a patient (right). Two-sided Spearman p-value. (E) Immunohistochemistry staining of PCSK9 and hematoxylin in one representative case and one control that is (F) quantified in cases and controls, box plots show median and interquartile range. Each dot represents one patient, two-sided t-test p-values. (G) Expression of CXCL13, IL17A, and IL26 in CD8 T cells and (H) CXCR3, IL10, and TNFRSF9 in Tregs across 19 tumor types: melanoma (MELA), B-cell lymphoma (BCL), renal carcinoma (RC), nasopharyngeal carcinoma (NPC), thyroid carcinoma (THCA), squamous cell carcinoma (SCC), multiple myeloma (MM), lung cancer (LC), breast cancer (BRCA), head and neck squamous cell carcinoma (HNSCC), uterine corpus endometrial carcinoma (UCEC), hepatocellular carcinoma (HCC), basal cell carcinoma (BCC), pancreatic cancer (PACA), ovarian cancer (OV), stomach adenocarcinoma (STAD), esophageal cancer (ESCA), colorectal cancer (CRC), and cholangiocarcinoma (CHOL).

References

    1. Wolchok JD et al. Overall Survival with Combined Nivolumab and Ipilimumab in Advanced Melanoma. N. Engl. J. Med 377, 1345–1356 (2017). - PMC - PubMed
    1. Arnaud-Coffin P et al. A systematic review of adverse events in randomized trials assessing immune checkpoint inhibitors. Int. J. Cancer 145, 639–648 (2019). - PubMed
    1. Chen JH, Pezhouh MK, Lauwers GY & Masia R Histopathologic Features of Colitis Due to Immunotherapy With Anti-PD-1 Antibodies. Am J Surg Pathol 41, 643–654 (2017). - PubMed
    1. Verschuren EC et al. Clinical, Endoscopic, and Histologic Characteristics of Ipilimumab-Associated Colitis. Clin Gastroenterol Hepatol 14, 836–842 (2016). - PubMed
    1. Curran MA, Montalvo W, Yagita H & Allison JP PD-1 and CTLA-4 combination blockade expands infiltrating T cells and reduces regulatory T and myeloid cells within B16 melanoma tumors. Proc Natl Acad Sci U A 107, 4275–4280 (2010). - PMC - PubMed

MeSH terms