. 2024 Jun;56(6):1168-1180.
doi: 10.1038/s41588-024-01706-w. Epub 2024 May 9.

Systematic epigenome editing captures the context-dependent instructive function of chromatin modifications

Affiliations

Systematic epigenome editing captures the context-dependent instructive function of chromatin modifications

Cristina Policarpi et al. Nat Genet. 2024 Jun.

Abstract

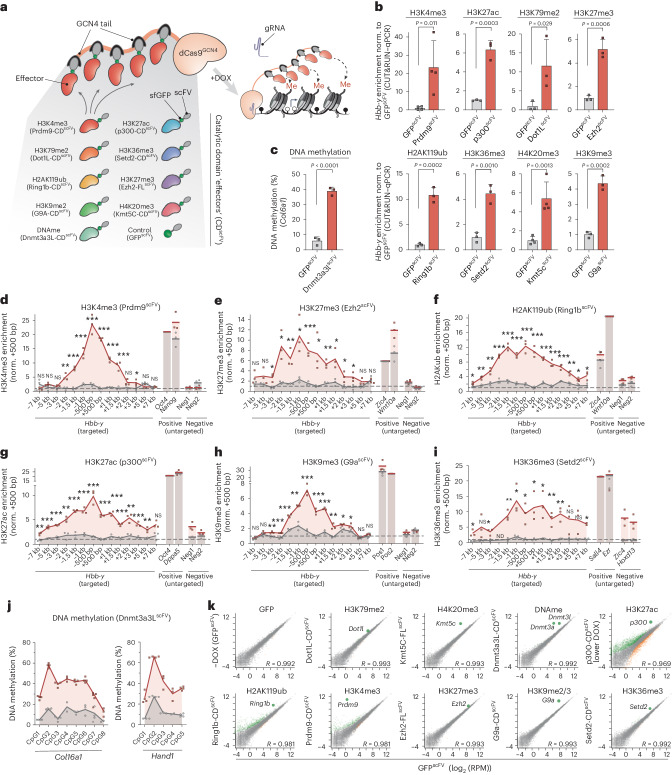
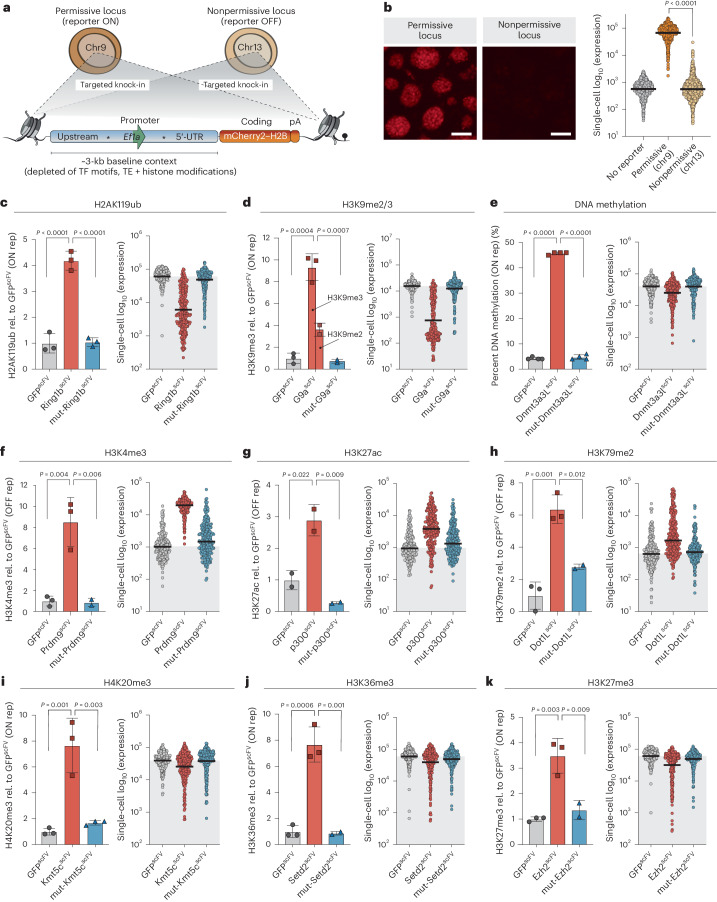
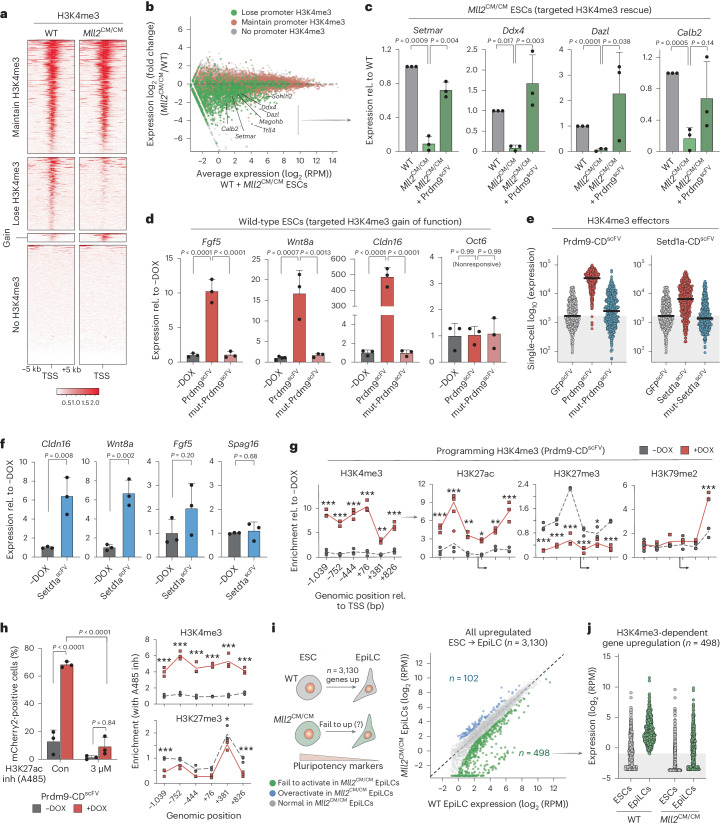
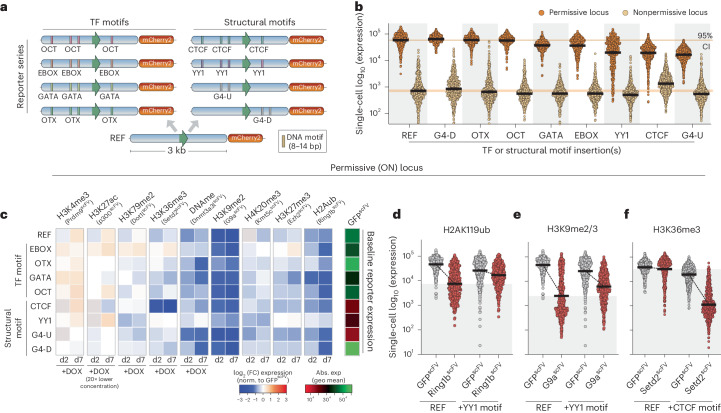
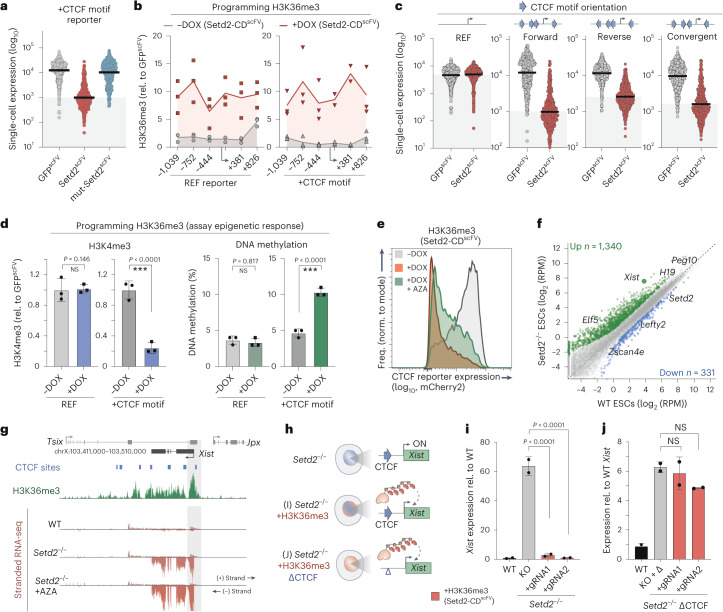
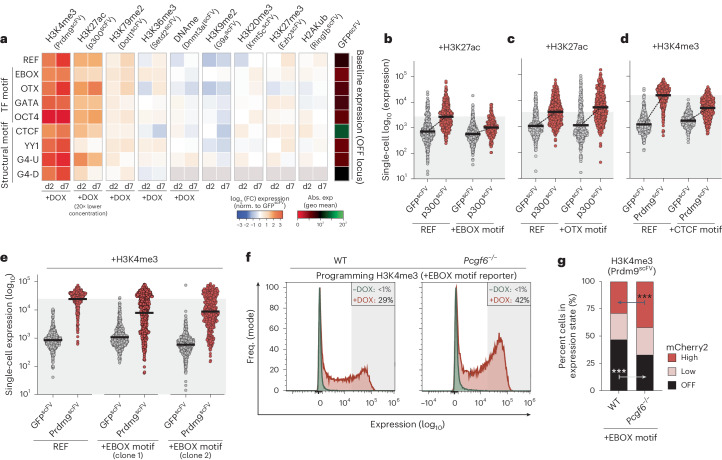
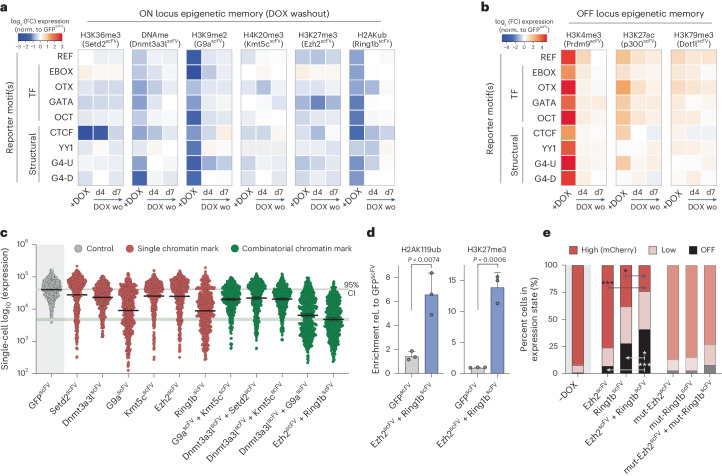
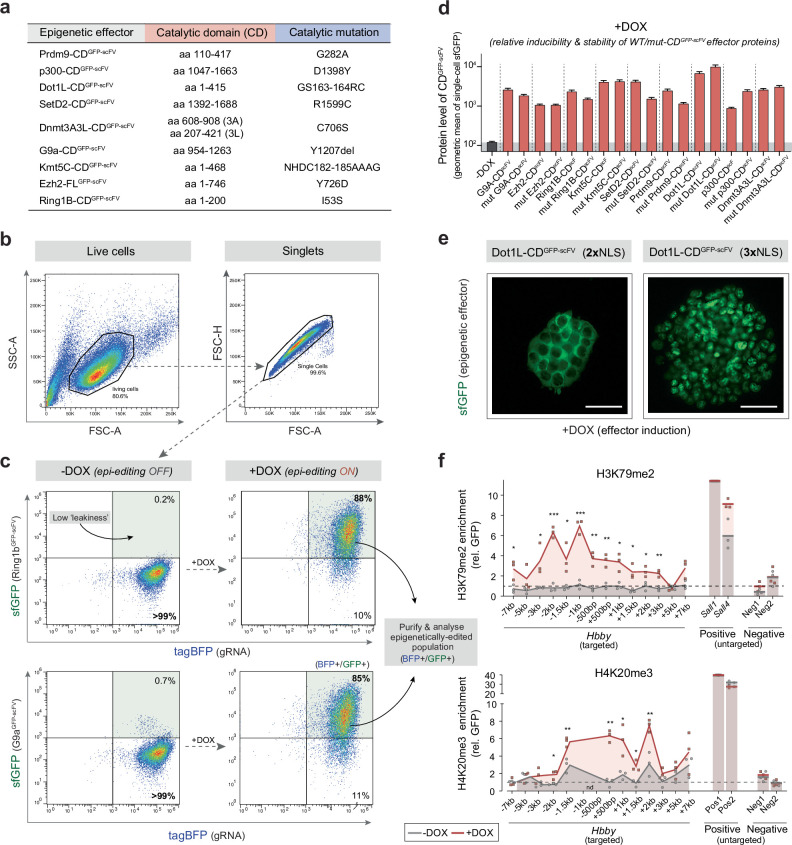
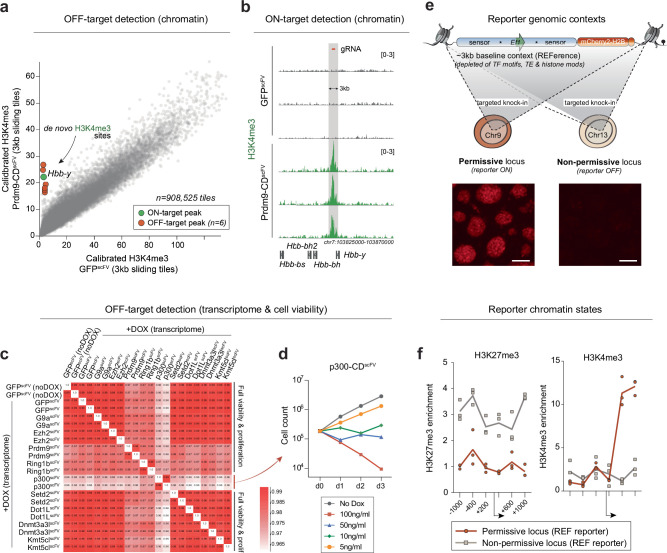
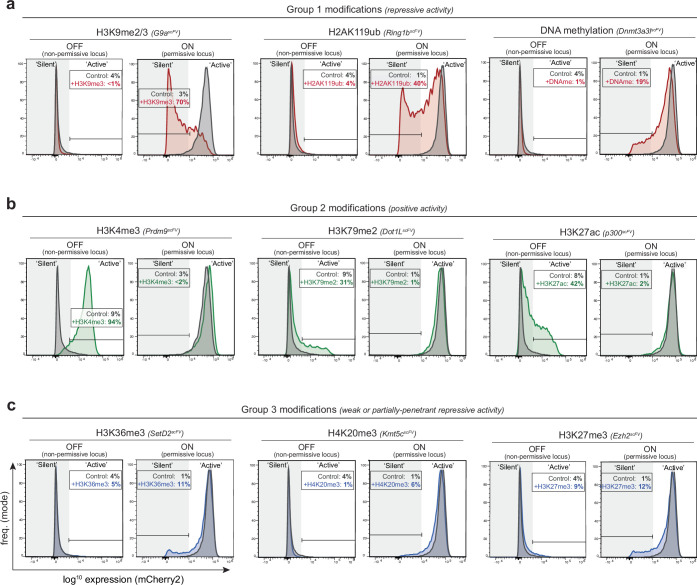
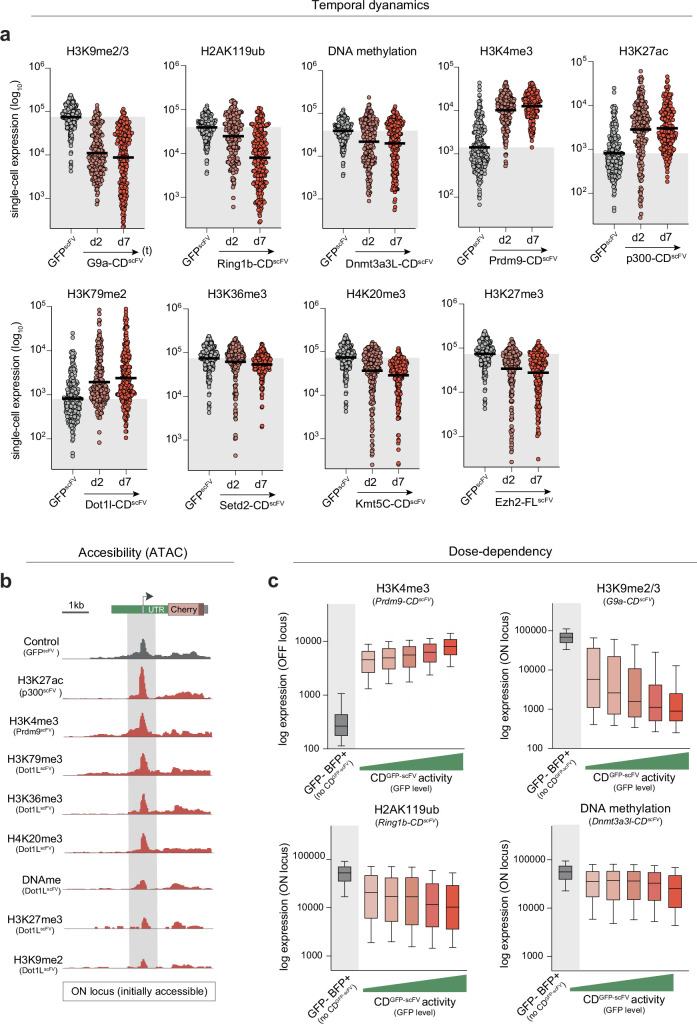
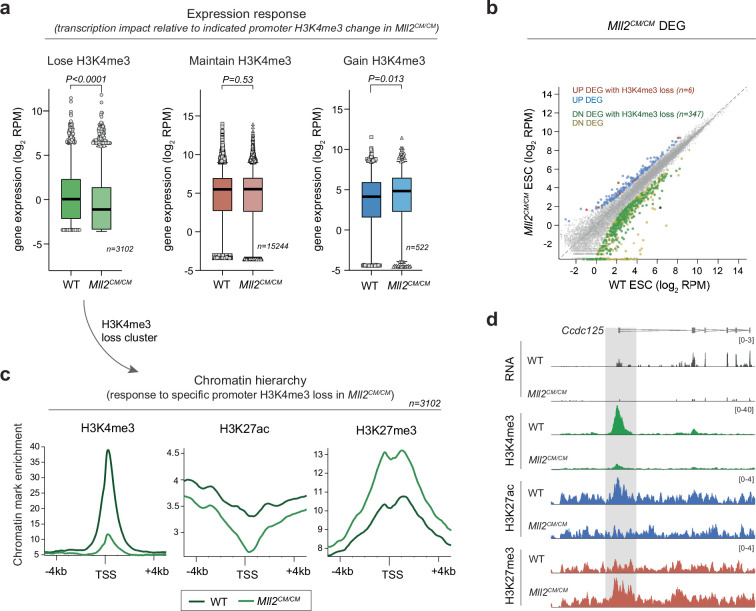
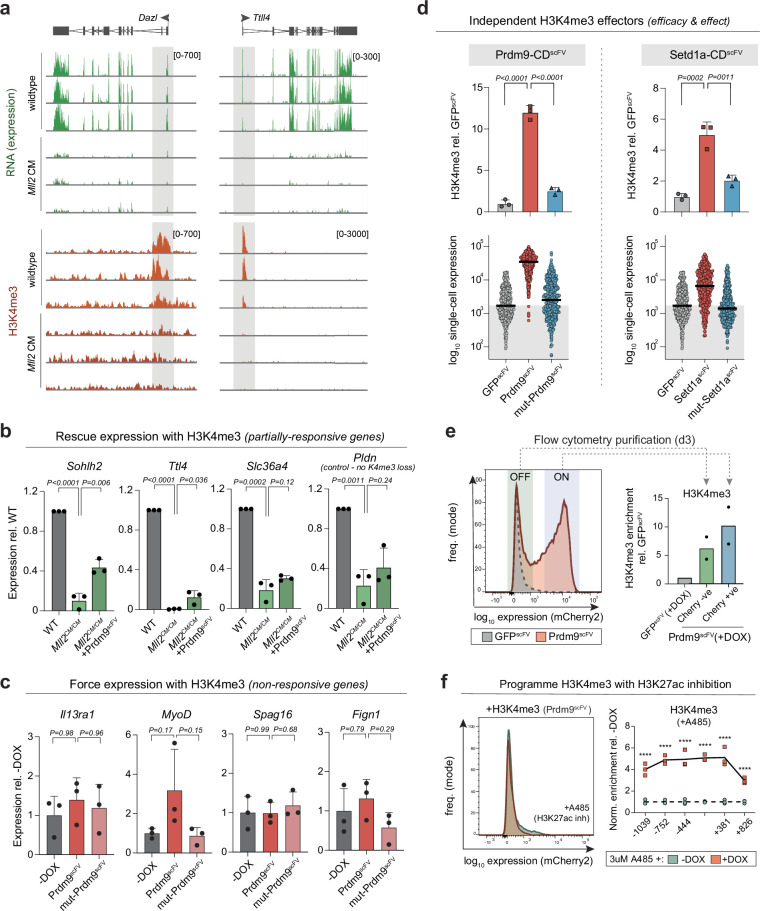
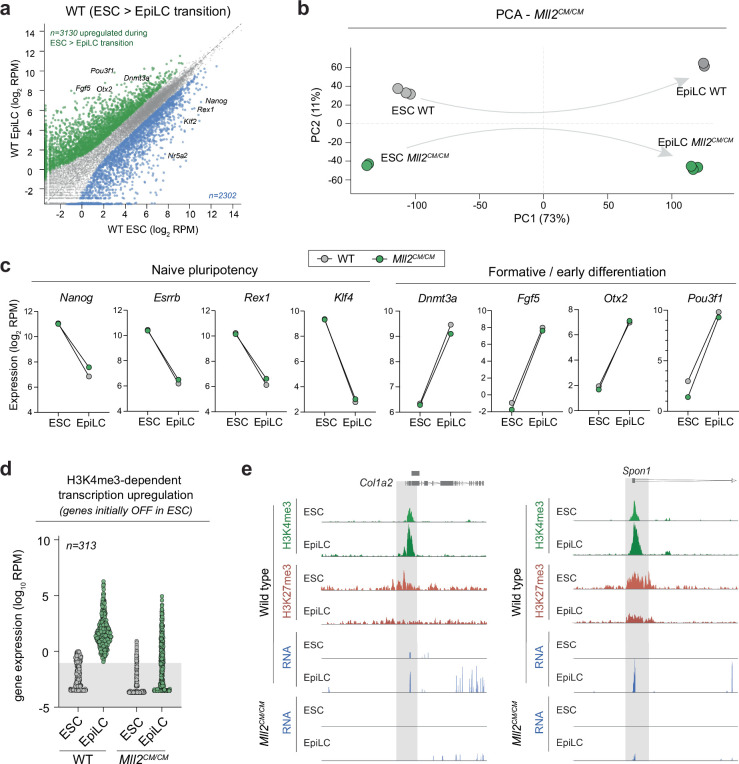
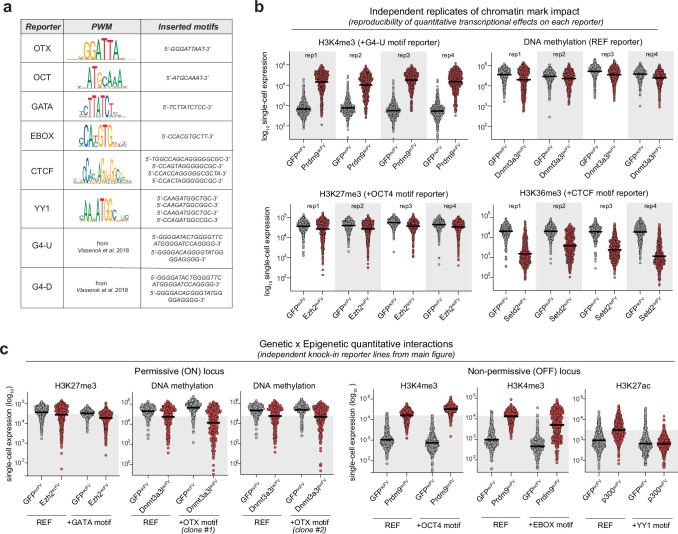
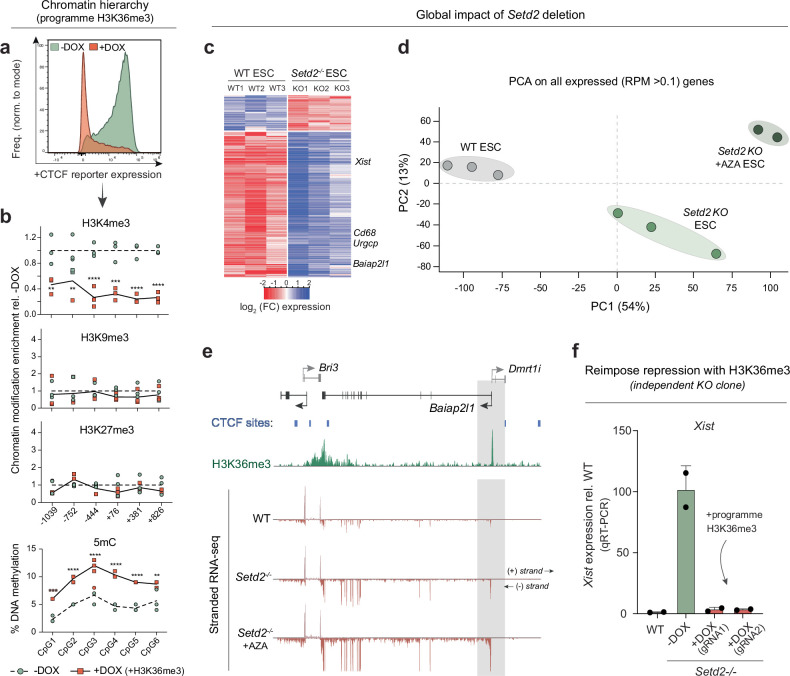
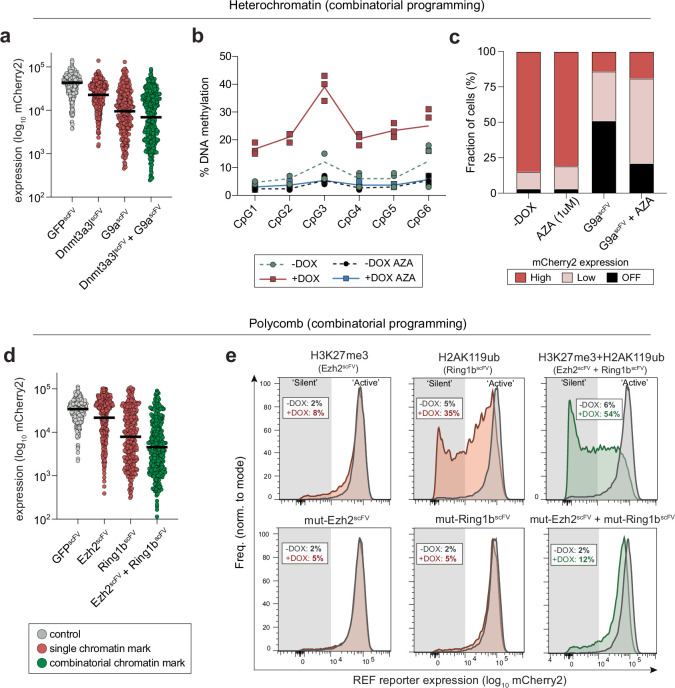
Chromatin modifications are linked with regulating patterns of gene expression, but their causal role and context-dependent impact on transcription remains unresolved. Here we develop a modular epigenome editing platform that programs nine key chromatin modifications, or combinations thereof, to precise loci in living cells. We couple this with single-cell readouts to systematically quantitate the magnitude and heterogeneity of transcriptional responses elicited by each specific chromatin modification. Among these, we show that installing histone H3 lysine 4 trimethylation (H3K4me3) at promoters can causally instruct transcription by hierarchically remodeling the chromatin landscape. We further dissect how DNA sequence motifs influence the transcriptional impact of chromatin marks, identifying switch-like and attenuative effects within distinct cis contexts. Finally, we examine the interplay of combinatorial modifications, revealing that co-targeted H3K27 trimethylation (H3K27me3) and H2AK119 monoubiquitination (H2AK119ub) maximizes silencing penetrance across single cells. Our precision-perturbation strategy unveils the causal principles of how chromatin modification(s) influence transcription and dissects how quantitative responses are calibrated by contextual interactions.


Conflict of interest statement

The authors declare no competing interests.

Figures

Fig. 1
Fig. 1. A modular toolkit for precisely programming chromatin states.
a, Schematic of the modular epigenetic editing platform. Upon DOX induction, dCas9GCN4 recruits five copies of the CD of chromatin-modifying effector(s) or control GFPscFV to target loci via a specific gRNA. DNAme, DNA methylation. b, Relative abundance of the indicated histone modification at Hbb-y assayed by either CUT&RUN–qPCR or by chromatin immunoprecipitation followed by qPCR (ChIP–qPCR) (H3K36me3, H3K79me2), following epigenetic editing or control GFPscFV recruitment in ESCs for 7 d. Shown is the mean of three biologically independent experiments; error bars indicate s.d. Norm., normalized. c, Histogram showing mean DNA methylation installed at the unmethylated Col16a1 promoter, determined by bisulfite pyrosequencing in three biologically independent experiments; error bars indicate s.d. di, Relative abundance of the indicated histone modification (H3K4me3 (d), H3K27me3 (e), H2AK119ub (f), H3K27ac (g), H3K9me3 (h), H3K36me3 (i)) across the Hbb-y locus after epigenetic programming with a specific CDscFV (Prdm9 (d), Ezh2 (e), Ring1b (f), p300 (g), G9a (h), Setd2 (i); red line) or control GFPscFV (gray line), assayed by CUT&RUN–qPCR. Mean enrichment across a ~14-kb region centered on the gRNA-binding site is shown for editing in biological triplicates as well as for endogenous positive (Pos1 and Pos2) and negative (Neg1 and Neg2) loci for each mark. NS, not significant. ND, not determined. j, Percentage of DNA methylation at CpG dinucleotides across the Col16a1 and Hand1 promoters in triplicate experiments. k, Scatterplots showing limited OFF-target gene expression changes following induction of the indicated epigenetic mark at Hbb-y for 7 d, relative to that of control GFPscFV. Differentially expressed genes are indicated in green or orange. Gray dots indicate unaffected genes. p300, ep300; G9a, Ehmt2; Ring1b, Rnf2. P values in all panels were calculated by one-tailed unpaired t-test. *P < 0.05, **P < 0.01, ***P < 0.001.
Fig. 2
Fig. 2. Distinct chromatin modifications causally instruct transcriptional responses.
a, Schematic depicting the structure of the REF reporter and its targeted integration into either a transcriptionally permissive (chr9, ON) or nonpermissive (chr13, OFF) locus. Asterisks indicate gRNA target sites within the neutral DNA context. UTR, untranslated region.; pA, poly-A tail; TE, transposable element. b, Representative fluorescence images (left) and expression from quantitative flow cytometry (right) showing activity of the REF reporter when integrated into either the permissive or nonpermissive locus. n = 1,000 individual cells; reading was performed for three independent experiments. Bars denote the geometric mean. The P value was determined by two-tailed unpaired t-test. Scale bars, 100 μm. ck, Programming of a specific chromatin modification (left) and transcriptional responses in single cells (right) for H2AK119ub (c), H3K9me2/3 (d), DNA methylation (e), H3K4me3 (f), H3K27ac (g), H3K79me2 (h), H4K20me3 (i), H3K36me3 (j) and H3K27me3 (k). Left: histogram showing relative (rel.) enrichment of the indicated chromatin modification after targeting control GFPscFV (gray bar), wild-type CDscFV (red bar) or catalytically inactive mut-CDscFV (blue bar) for 7 d. Displayed is the mean of at least two independent quantitations by CUT&RUN–qPCR or ChIP–qPCR. Error bars represent s.d. Rep, reporter. Right: dot plot showing log10 (mCherry expression) in response to epigenetic editing of the indicated chromatin mark. n = 250 individual cells; bars denote geometric mean of the population; gray shading indicates control geometric mean. Reading was performed for four independent experiments. P values were calculated by one-way ANOVA with Tukey’s multiple-test correction.
Fig. 3
Fig. 3. De novo H3K4me3 triggers transcription upregulation.
a, H3K4me3 enrichment over the transcriptional start site (TSS) ±5 kb in wild-type and Mll2CM/CM ESCs, stratified according to H3K4me3 changes in Mll2CM/CM ESCs. b, MA plot of expression change for each gene in Mll2CM/CM ESCs, colored by whether the promoter loses H3K4me3 (green) or retains H3K4me3 (red). WT, wild type. c, Bar plots showing expression of the indicated genes in wild-type, Mll2CM/CM and Mll2CM/CM + Prdm9scFV ESCs, in which H3K4me3 has been programmed back to a repressed promoter that previously lost H3K4me3. Shown is the mean of three biological replicates assayed by qPCR with reverse transcription (RT–qPCR). Error bars represent s.d., and significance of rescue was calculated by two-tailed unpaired t-test. d, Bar plots of endogenous gene expression in wild-type ESCs and upon programming H3K4me3 with Prdm9scFV or control mut-Prdm9scFV. Data are the mean of biological triplicates; error bars represent s.d. Significance was calculated by one-way ANOVA with Tukey’s correction. Oct6 (Pou3f1). e, Dot plots showing single-cell expression of the OFF reporter after targeting with different H3K4me3 effectors: Prdm9scFV (left) or Setd1ascFV (right). n = 500 individual cells; bars denote the geometric mean. Reading was performed for three independent experiments. f, Bar plots of mean gene expression in wild-type ESCs targeted with Setd1ascFV or untargeted (−DOX), assayed by RT–qPCR from biological triplicates. Error bars, s.d. with significance calculated by two-tailed unpaired t-test. g, Epigenetic landscape response at the OFF reporter before (−DOX) and after (+DOX) targeted H3K4me3 programming. Histone modification enrichment is indicated across ~2 kb. n = 3 independent experiments with significance calculated by two-tailed unpaired t-test. h, Left: bar plots showing that the mean percentage of mCherry-positive cells is restricted after (+DOX) H3K4me3 installation by Prdm9scFV in the presence or absence of the p300 inhibitor (inh) A485. Con, control. Data are biological triplicates; error bars represent s.d. P values were calculated by two-way ANOVA with Tukey’s correction. Right: relative abundance of the indicated histone modifications after programming H3K4me3 (+DOX) in the presence of A485. n = 3 independent experiments, with significance calculated by two-tailed unpaired t-test. i, Schematic of the strategy and scatterplot showing genes that depend on MLL2-mediated promoter H3K4me3 for upregulation (up) during the ESC transition to EpiLCs. Significant genes are colored. j, Dot plots showing normalized log expression of each gene (n = 498) that is normally activated in wild-type EpiLCs but fails to be upregulated in Mll2CM/CM cells. Where indicated, *P < 0.05, **P < 0.01, ***P < 0.001.
Fig. 4
Fig. 4. Functional interplay between chromatin marks and TF motifs.
a, Schematic of the reporter series in which each is identical apart from the insertion of specific short sequence motifs. b, Dot plots of mCherry2 expression from the indicated reporter type, integrated in either the permissive or the nonpermissive locus. Each data point represents a single cell (n = 500), and bars denote the geometric mean. Reading was performed for four independent experiments. CI, confidence interval. c, Heatmap showing the log2 (fold change (FC)) in transcription at the ON locus upon programming the indicated chromatin mark (x axis) to the indicated cis motif reporter (y axis), relative to control GFPscFV targeting. Data are shown after 2 d (d2) and 7 d (d7) of DOX-induced epigenetic editing and correspond to the average of four technical replicates. Abs., absolute; exp, expression; geo, geometric. df, Dot plots showing independent validations of functional interactions between programmed epigenetic marks (H2AK119ub (d), H3K9me3 (e), H3K36me3 (f)) and the underlying sequence motifs (REF versus +YY1 motif (d,e), REF versus +CTCF motif (f)). Each data point is log10 (expression) in a single cell (n = 500) carrying the indicated reporter, and bars denote geometric mean.
Fig. 5
Fig. 5. Context-dependent influence on H3K36me3 activity.
a, Dot plots showing single-cell log10 (expression) of the +CTCF reporter after GFPscFV, Setd2scFV (H3K36me3) or mut-Setd2scFV targeting for 7 d. n = 250 individual cells; bars denote the geometric mean. Reading was performed for four independent experiments. b, Relative abundance of H3K36me3 at the REF (left) or +CTCF (right) reporter assayed by ChIP–qPCR before (−DOX) or after (+DOX) Setd2scFV induction, across a ~2-kb region. Lines denote the mean of three replicates. c, log10 (expression) of knock-in reporters harboring +CTCF motif(s) in the indicated orientations following programming of H3K36me3 or control. Each data point represents a single cell (n = 250), and bars denote the geometric mean. Reading was performed for three independent experiments. d, Bar plots showing the enrichment of H3K4me3 (left) and percentage of DNA methylation (right) on either the REF or +CTCF reporter following programming of H3K36me3. Shown is the mean of three independent experiments. Error bars represent s.d., with significance calculated by two-tailed unpaired t-test. e, Representative flow cytometry plot showing expression of the +CTCF reporter before (−DOX) or after (+DOX) programming of H3K36me3 with or without the DNA methylation inhibitor AZA. Freq., frequency. f, Scatterplot of gene expression changes in Setd2−/− ESCs versus wild-type ESCs, highlighting differentially expressed genes. Down, downregulated; up, upregulated. g, Genome view of the Xist locus, showing a promoter H3K36me3 peak and expression in wild-type and Setd2−/− ESCs with or without AZA. h, Schematic of the triple (epi)genomic perturbation strategy. i, Mean expression level of Xist in Setd2−/− ESCs before and after targeted programming of H3K36me3 to the promoter with an independent gRNA. Error bars represent s.d. Significance was calculated by two-tailed unpaired t-test. KO, knockout. j, Xist expression in Setd2−/− ESCs with the promoter-proximal CTCF motif deleted, before and after programming of H3K36me3. Shown is the mean of three independent experiments. Error bars represent s.d. Significance was calculated by two-tailed unpaired t-test. ***P < 0.001.
Fig. 6
Fig. 6. Instructive activity of chromatin modifications is throttled by cis genetics.
a, Heatmap showing log2 (fold change) in transcription at the OFF locus upon programming the indicated chromatin mark (x axis) to the indicated cis motif reporter (y axis), relative to control GFPscFV targeting. Data are shown after 2 d and 7 d of DOX-induced epigenetic editing and correspond to the average of four technical replicates. bd, Dot plots showing independent validations of functional interactions between programmed epigenetic marks (+H3K27ac (b,c), +H3K4me3 (d)) and underlying sequence motifs (REF versus +EBOX motif (b), REF versus +OTX motif (c), REF versus +CTCF motif (d)). Each data point is log10 (expression) of the indicated reporter variant in a single cell (n = 500) after control GFPscFV or specific CDscFV epigenetic editing for 7 d. Bars denote the geometric mean. e, Dot plots showing that single-cell expression of +EBOX reporters in independent lines is restricted after induction of H3K4me3, relative to the control REF reporter. n = 500 individual cells; bars denote the geometric mean. f, Representative flow cytometry plot showing +EBOX reporter expression before (−DOX) or after (+DOX) Prdm9scFV targeting for 5 d in either a wild-type or a Pcgf6−/− genetic background. g, Contingency plot indicating that an elevated fraction of cells acquire the ‘high’ expression state following H3K4me3 programming in Pcgf6−/− ESCs. Significance was calculated by two-way ANOVA with Tukey’s correction. ***P < 0.001.
Fig. 7
Fig. 7. Functional synergy between H3K27me3 and H2AK119ub.
a,b, Heatmaps showing log2 (fold change) in transcription upon programming the indicated chromatin mark (x axis) to the indicated motif reporter (y axis) and then upon washout (DOX wo) for 4 d (d4) or 7 d (d7) to assay epigenetic memory. Shown are transcriptional persistence effects at the ON locus (a) and the OFF locus (b). c, Representative dot plots indicating log10 (expression) after control GFPscFV, single CDscFV or multiplex CDscFV targeting for 7 d to program combinatorial marks. Each data point represents a single cell (n = 500), and bars denote the geometric mean. d, Bar plots showing enrichment of H2AK119ub (left) and H3K27me3 (right) on the ON REF reporter assayed by CUT&RUN–qPCR following control GFPscFV or combinatorial Ezh2scFV and Ring1bscFV targeting. Shown is the mean of three biological replicates; error bars represent s.d.; significance was determined by two-tailed unpaired t-test. e, Contingency plot indicating that an elevated fraction of cells acquire the ‘OFF’ expression state following combinatorial H3K27me3–H2AK119ub programming. Significance was calculated by two-way ANOVA with Tukey’s correction. *P < 0.05, ***P < 0.001.
Extended Data Fig. 1
Extended Data Fig. 1. An optimised toolkit for precision & dynamic chromatin state perturbations.
(a) Table detailing the catalytic domains (CD) used as epigenetic ‘effectors’ in this study, and the precise point-mutant controls to specifically disrupt their catalytic activity. Each CD effector is tagged with superfolder GFP (sfGFP) and an scFV domain that specifically binds the GCN4 tail of dCas9GCN4. (b-c) Representative flow cytometry dot plots showing (b) the initial filtering and gating strategy, and (c) DOX-dependent induction of the epigenetic editing system, shown in upper panels for Ring1b-CDscFV (H2AK119ub) and lower panels for G9a-CDscFV (H3K9me2). The enhanced gRNA scaffold is constitutively expressed and marked by tagBFP (x-axis). dCas9GCN4 and each CDscFV effector is activated by +DOX, leading to nuclear GFP signal (y-axis) and epigenetic editing. Note GFP signal confirms CDscFV or mut-CDscFV stability, enables dose-dependent responses to be ascertained, and is used to flow sort pure populations of cells that have appropriately activated the editing system (GFP+). Note lack of GFP signal in -DOX conditions is consistent with minimal ‘leaky’ activity. (d) Protein levels of induced WT- and mut- CDscFV epigenetic effectors, confirming their comparable stability and relative expression level upon DOX induction relative to uninduced (-DOX). Shown is the geometric mean with 95% CI of individual cells (n = 500). (e) Representative GFP fluorescence image showing that CDscFV effectors often required additional (>2) nuclear localization sequences (NLS) for nuclear accumulation and efficient epigenetic editing. Scalebar=50μm. (f) High resolution enrichment of H3K79me2 (upper) and H4K20me3 (lower) across the entire Hbby locus after epigenetic editing, targeted with three gRNAs. Enrichment at positive control endogenous loci and negative control (untargeted) loci is shown. Error bars represent S.D. of three independent experiments. Pvalues are calculated by one-tailed unpaired t-test. *P < 0.05 **P < 0.01, ***P < 0.001.
Extended Data Fig. 2
Extended Data Fig. 2. Minimal OFF-targeting from epigenetic editing & reporter (epi)genomic features.
(a) Dot plot of genome-wide H3K4me3 enrichment across sliding 3 kb tiles by calibrated Cut&Run. Shown is genome-wide H3K4me3 upon epigenetic editing at the Hbby locus with Prdm9-CDscFV relative to control ESC with GFPscFV, demonstrating the vast majority of the genome does not acquire H3K4me3 peaks (minimal OFF-targeting). (b) Genome tracks showing ON-target enrichment of programmed H3K4me3 across the Hbby locus by Prdm9-CDscFV mediated epigenetic editing. (c) Correlation matrix of replicate transcriptomes (RNA-seq) following induction of the indicated epigenetic editing system with DOX. We routinely observed high correlation (>0.98) between global gene expression, with few OFF-target genes mis-ex- pressed, indicative of preferential ON-target activity. The exception is p300scFV, and we therefore reduced the DOX concentration to mitigate indirect effects. (d) ESC proliferation following a titration of p300-CDscFV induction levels with DOX. (e) Schematic and fluorescent images of ESC carrying the reference (REF) reporter knocked-in to distinct genomic locations; a permissive locus for transcription (left) and a non-permissive locus (right). Images were captured in two independent experiments with similar results. (f) Quantification of baseline H3K4me3 and H3K27me3 at identical reference reporters located within the each genomic context.
Extended Data Fig. 3
Extended Data Fig. 3. Transcriptional impact of programmed chromatin marks at active & inactive loci.
(a-c) Representative flow cytometry histograms of reporter gene expression following de novo programming of the indicated chromatin modification. For each modification, the transcriptional effect is shown from a inactive location (initial expression OFF; see left panels) and on an identical promoter in a permissive location (initial expression ON; see right panels). The percentage of cells that acquire a new expression state following precision chromatin editing in each context is indicated, along with control (GFPscFV) targeting. Based on reproducible transcriptional responses, we grouped chromatin modifications into functional cohorts whereby (a) deposition promotes significant gene repression amongst a major fraction of cells, from an active genomic location (b) deposition facilitates significant gene activation amongst a major fraction of cells, from a repressed location, and (c) de novo targeting has a subtle or highly partially-penetrant repressive effect.
Extended Data Fig. 4
Extended Data Fig. 4. Temporal dynamics and dose-dependent responses to epigenetic editing.
(a) Dot plots showing log expression of the reference reporter in each cell following targeted epigenetic editing with the indicated chromatin modifications. Shown is the transcriptional response at day 2 (d2) and day 7 (d7) after programming each mark with its cognate CDscFV effector relative to control targeting of the GFPscFV effector. N = 250 cells. Reading was performed in four independent experiments. (b) Promoter accessibility at the permissive reporter locus measured by ATAC-seq. Shown is the genome view of promoter accessibility following de novo programming of the indicated chromatin modification. (c) Dose-dependent transcriptional responses to the indicated chromatin modification effectors. A single population of +DOX cells was stratified based on the level of induced CDscFV expression, as determined by GFP. Shown is the transcriptional response of the reporter, which is directly correlated with the amount of epigenetic editing activity in the cell. Representative dose-dependent responses are displayed as boxplots of single-cell expression levels following programming of H3K4me3, H3K9me2/3, H2AK119ub and DNA methylation. Lines indicate median values and box 25th and 75th percentiles. Whiskers indicate 10th and 90th percentile.
Extended Data Fig. 5
Extended Data Fig. 5. Analysis of Mll2CM/CM ESC that specifically lack H3K4me3 methylase activity.
(a) Boxplots showing log expression change of genesets stratified according to their promoter H3K4me3 status in Mll2CM/CM ESC. Specifically, genes that lose H3K4me3 are significantly downregulated whilst those that maintain H3K4me3 remain unaltered (N = 3102, left; N = 15244, center; N = 522, right). Lines indicate median values and box 25th and 75th percentiles. Whiskers indicate 10th and 90th percentile. b) Scatter plot showing all significant differentially expressed genes (DEG) in Mll2CM/CM ESC. DEGs are highlighted by being up- or down- regulated and whether they lose promoter H3K4me3 in Mll2CM/CM ESC relative to WT ESC. (c) Metaplots of H3K4me3, H3K27ac and H3K27me3 enrichment in WT and Mll2CM/CM ESC, over MLL2-dependent promoters (TSS) that lose H3K4me3. Promoter H3K4me3 depletion is linked with parallel depletion of H3K27ac and gain of H3K27me3, indicating a chromatin hierarchy. (d) Representative genome view showing expression (RNA), and changes in chromatin marks H3K4me3, H3K27ac, and H3K27me3 upon specific loss of H3K4me3 in Mll2CM/CM ESC.
Extended Data Fig. 6
Extended Data Fig. 6. Programming H3K4me3 activates gene expression via H3K27ac.
(a) Genome view of replicate assays showing genes that specifically lose promoter H3K4me3 in Mll2CM/CM ESC (red), which is linked with strong expression downregulation (green). (b) qRT-PCR showing re-targeting H3K4me3 back to endogenous promoters that have lost H3K4me3 in Mll2CM/CM ESC partially rescues their expression level (see also Fig. 3c). The control Pldn gene exhibits no initial loss of H3K4me3 (indirectly affected), and accordingly was not rescued by deposition of further H3K4me3. Bar plots show the mean of n = 3 biologically independent experiments. Error bars represent S.D. Significance of rescue is calculated by two-tailed unpaired t-test. (c) Silent endogenous genes targeted for H3K4me3 epigenetic editing that do not exhibit significant transcriptional responses. Bar plots show the mean of N = 3 biologically independent experiments. Error bars represent S.D. Significance by one-way ANOVA with Tukey’s multiple test correction. (d) Comparison of two independent H3K4me3 effectors for epigenetic editing (Prdm9-CDscFV and Setd1a-CDscFV). Upper: CUT&RUN-qPCR showing the level of H3K4me3 deposited at the OFF reporter promoter by each effector and their respective catalytic-mutant controls. Note Prdm9-CDscFV deposits significantly higher levels of H3K4me3 than Setd1a-CDscFV. Lower: transcriptional impact of H3K4me3 programming in single cells to each effector reveals a dose-dependent response. Bar plots show the mean of N = 3 biologically independent experiments. Error bars represent S.D. P-values are calculated by one-way ANOVA with Tukey’s multiple test correction. (e) Flow cytometry plot at day 3 of Prdm9scFV induction, showing ~half the population have initiated a transcriptional response (activation). Active (ON) and inactive (OFF) populations were purified and the level of deposited H3K4me3 assayed by CUT&RUN-qPCR. Whilst all cells are enriched with H3K4me3, those with the higher levels are active, indicating a threshold level of H3K4me3 is necessary to trigger transcriptional activation. Bar plots show the mean of N = 3 biologically independent experiments. Error bars represent S.D. (f) Representative flow cytometry histogram showing that programming H3K4me3 no longer activates expression in the presence of an acetylation inhibitor (A485) - compare with short-term induction plot above with no A485. Shown right is CUT&RUN-qPCR confirming H3K4me3 is programmed in the presence of A485 but cannot elicit downstream effects on transcription. Significance calculated by one-tailed unpaired t-test. *P < 0.05 **P < 0.01, ***P < 0.001.
Extended Data Fig. 7
Extended Data Fig. 7. Role of H3K4me3 in de novo gene activation during cell fate transition.
(a) Scatter plot showing expression of genes in naive ESC (x-axis) and formative EpiLC (y-axis) in WT cells. This identified 3130 genes that exhibit significant transcriptional activation during cell fate transition to EpiLC under normal conditions (shown in green). (b) Principal component analysis (PCA) of all expressed genes (RPM > 1) in WT and Mll2CM/CM ESC, and upon transition to EpiLC. (c) Expression of representative marker genes showing removal of H3K4me3 by Mll2CM/CM does not impact the expression of pluripotency and formative (early differentiation) genes. This indicates that Mll2CM/CM ESC are fully competent to generate EpiLC, and that any expression changes are not indicative of impaired cell fate commitment. N = three independent experiments (d) Expression of the geneset that requires H3K4me3 for de novo activation in EpiLC. Shown are genes that are silent in ESC (RPM < 0.1) but fail to fully initiate expression (DEG) in Mll2CM/CM EpiLC that lack H3K4me3, despite normal cell fate transition. Each datapoint represents a single gene (N = 313) (e) Representative genome view plots of genes that are normally activated in WT EpiLC but fail to initiate expression in Mll2CM/CM EpiLC. These genes normally gain H3K4me3 and lose H3K27me in EpiLC during this transition.
Extended Data Fig. 8
Extended Data Fig. 8. Reproducible genetic x epigenetic functional interactions.
(a) Table illustrating the position weight matrix for each motif deployed across the reporter series, along with the actual inserted motif(s). (b) Dot plots showing log10 expression in single cells (n = 500); bars denote the geometric mean in the population. Displayed within each plot are four independent replicates of programming the same specific epigenetic modification to the same specific reporter, relative to control GFPscFV. Different marks and reporter combinations are selected to illustrate the reproducibility of both subtle and major quantitative effects elicited by epigenetic editing. (c) Examples of functional interplay between the quantitative impact of a programmed modification and the presence of an underlying TF motif in the reporter. For example, H3K27ac-mediated activation is attenuated in the context of YY1 motifs, H3K4me3 activation is strengthened in the presence of OCT4 motifs, whilst OTX motifs may enhance DNA methylation mediated repression, albeit this effect was not reproducible across all independent clones (representative samples shown). Dot plots show log10 expression in single cells (N = 500); bars denote the geometric mean in the population.
Extended Data Fig. 9
Extended Data Fig. 9. H3K36me3 interacts with cis CTCF motifs to induce silencing.
(a) Histogram showing the distribution of expression of the +CTCF motif reporter in control (-DOX) ESC and upon targeted installation of H3K36me3 at the promoter by Setd2-CDscFV (+DOX). (b) Hierarchy of chromatin modification changes following programming of H3K36me3 to the +CTCF reporter, assayed by CUT&RUN-qPCR or bisulfite pyrosequencing. Specific H3K36me3 deposition evicts H3K4me3 and promotes DNA methylation but has no downstream impact on H3K9me3 and H3K27me3. N = 3 independent experiments with significance calculated by two-tailed unpaired t-test. *P < 0.05 **P < 0.01, ***P < 0.001. (c) Heatmap showing all differentially expressed genes (DEG; p(adj)<0.05 and FC > 2)) in replicate Setd2 knockout (KO) lines. The majority are upregulated, including genes marked by promoter H3K36me3 such as Xist, Cd68, Urgcp and Baiap2l1. (d) Principal component analysis (PCA) of global transcriptomes from WT, Setd2 knockout or Setd2 knockout + 5-Aza-Deoxycytidine (AZA: DNA methylation inhibitor) ESC. (e) Representative genome view of a gene (Baiap2l1) marked by promoter H3K36me3 in ESC, that is significantly upregulated following global loss of H3K36me3 in Setd2 knockout cells. (f) qRT-PCR of de-repressed Xist expression in Setd2 knockout ESC (-DOX), and after induction of epigenetic editing to install H3K36me3 specifically back to the Xist promoter (+DOX). Programming H3K36me3 to Xist promoter leads to almost complete re-imposition of silencing. N = three biologically independent experiments. Error bars represent S.D. Significance was calculated by two-tailed unpaired t-test.
Extended Data Fig. 10
Extended Data Fig. 10. Combinatorial chromatin modifications enhance penetrance of single-cell silencing.
a) Dot plot showing log10 single-cell expression (N = 500) upon specific programming of DNA methylation, H3K9me2/3 or both modifications together relative to control. Reading was performed for three independent experiments. (b) DNA methylation pyrosequencing confirming that treatment with 1 μM 5-azacytdine (AZA) impairs DNA methylation deposition at the reporter. (c) Fraction of cellular population that is in either a ‘off’, ‘low’ or ‘high’ expression state following epigenetic editing +/− AZA. (d) Dot plot showing log10 single-cell expression (N = 500) upon specific programming of H3K27me3, H2AK119ub or both polycomb modifications together relative to control. Reading was performed for three independent experiments. (e) Representative and independent flow cytometry plots showing the distribution of gene expression across the population upon single- or combinatorial- polycomb targeting (upper), or with catalytic mutant controls (below). Note that both polycomb marks together increase the penetrance of ‘full’ silencing.

References

    1. Kouzarides T. Chromatin modifications and their function. Cell. 2007;128:693–705. - PubMed
    1. Blackledge NP, Klose RJ. The molecular principles of gene regulation by Polycomb repressive complexes. Nat. Rev. Mol. Cell Biol. 2021;22:815–833. - PMC - PubMed
    1. Allshire RC, Madhani HD. Ten principles of heterochromatin formation and function. Nat. Rev. Mol. Cell Biol. 2018;19:229–244. - PMC - PubMed
    1. Cavalli G, Heard E. Advances in epigenetics link genetics to the environment and disease. Nature. 2019;571:489–499. - PubMed
    1. Grosswendt S, et al. Epigenetic regulator function through mouse gastrulation. Nature. 2020;584:102–108. - PMC - PubMed