

Association between the stress hyperglycemia ratio and 28-day all-cause mortality in critically ill patients with sepsis: a retrospective cohort study and predictive model establishment based on machine learning
- PMID: 38725059
- PMCID: PMC11084034
- DOI: 10.1186/s12933-024-02265-4
Association between the stress hyperglycemia ratio and 28-day all-cause mortality in critically ill patients with sepsis: a retrospective cohort study and predictive model establishment based on machine learning
Abstract
Background: Sepsis is a severe form of systemic inflammatory response syndrome that is caused by infection. Sepsis is characterized by a marked state of stress, which manifests as nonspecific physiological and metabolic changes in response to the disease. Previous studies have indicated that the stress hyperglycemia ratio (SHR) can serve as a reliable predictor of adverse outcomes in various cardiovascular and cerebrovascular diseases. However, there is limited research on the relationship between the SHR and adverse outcomes in patients with infectious diseases, particularly in critically ill patients with sepsis. Therefore, this study aimed to explore the association between the SHR and adverse outcomes in critically ill patients with sepsis.
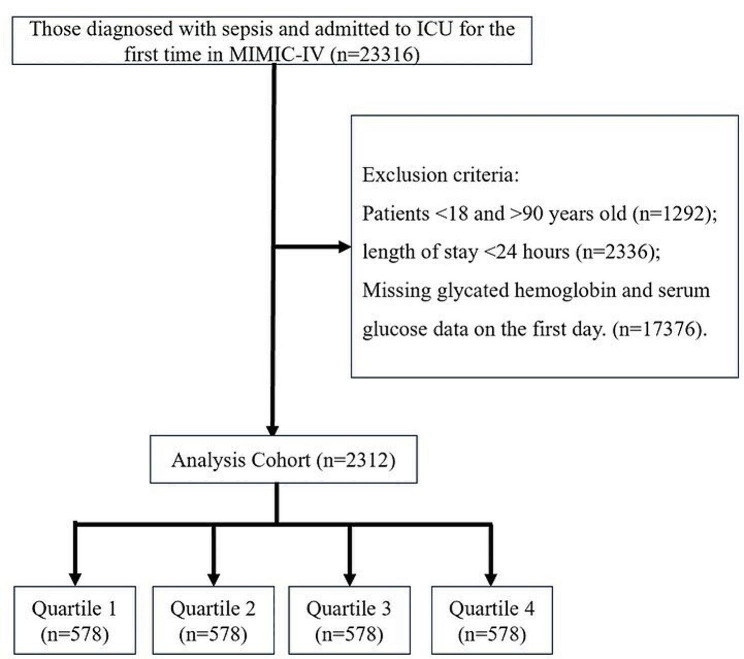
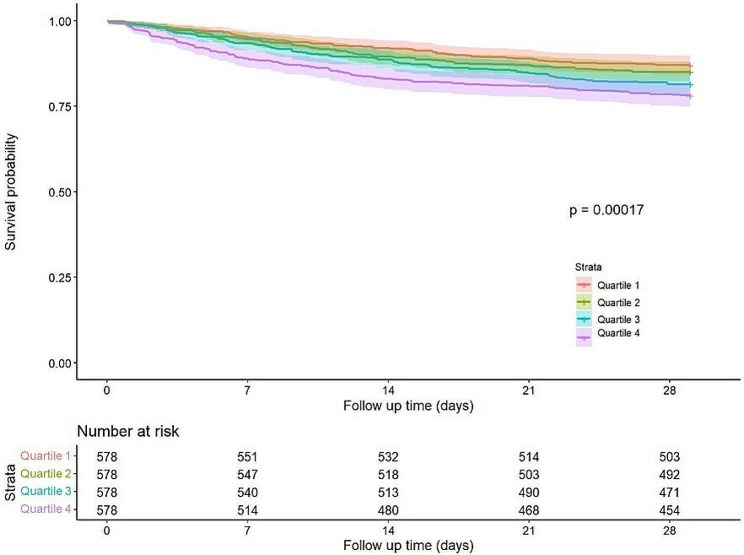
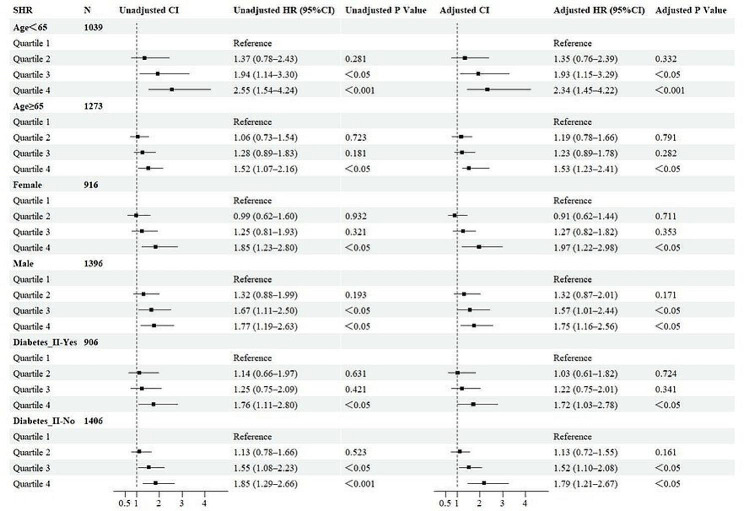
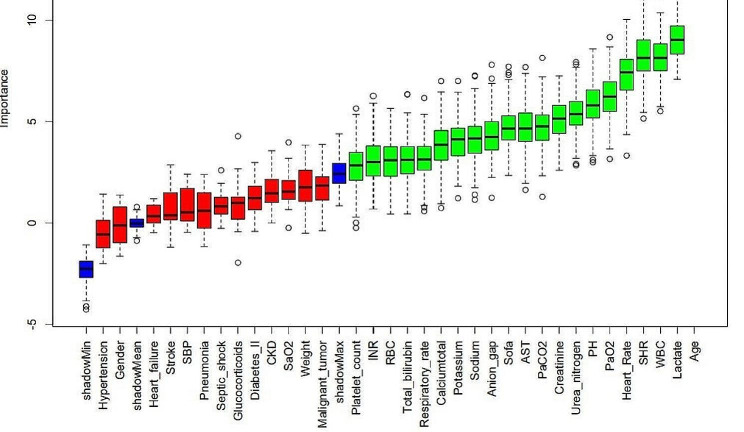
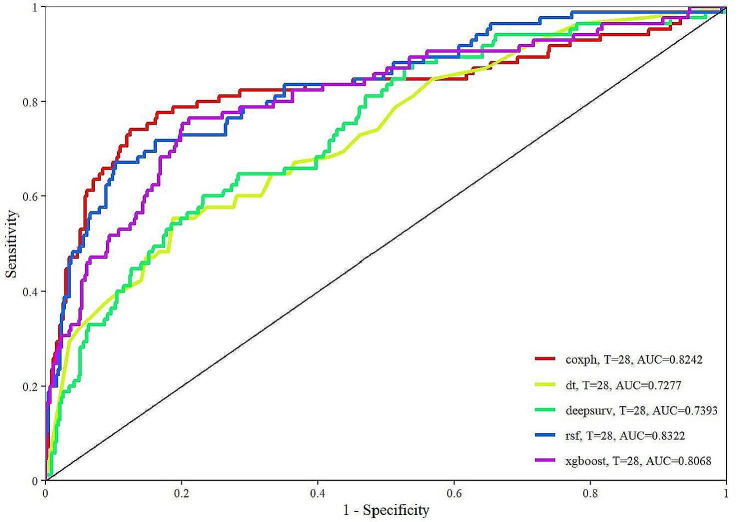
Methods: Clinical data from 2312 critically ill patients with sepsis were extracted from the MIMIC-IV (2.2) database. Based on the quartiles of the SHR, the study population was divided into four groups. The primary outcome was 28-day all-cause mortality, and the secondary outcome was in-hospital mortality. The relationship between the SHR and adverse outcomes was explored using restricted cubic splines, Cox proportional hazard regression, and Kaplan‒Meier curves. The predictive ability of the SHR was assessed using the Boruta algorithm, and a prediction model was established using machine learning algorithms.
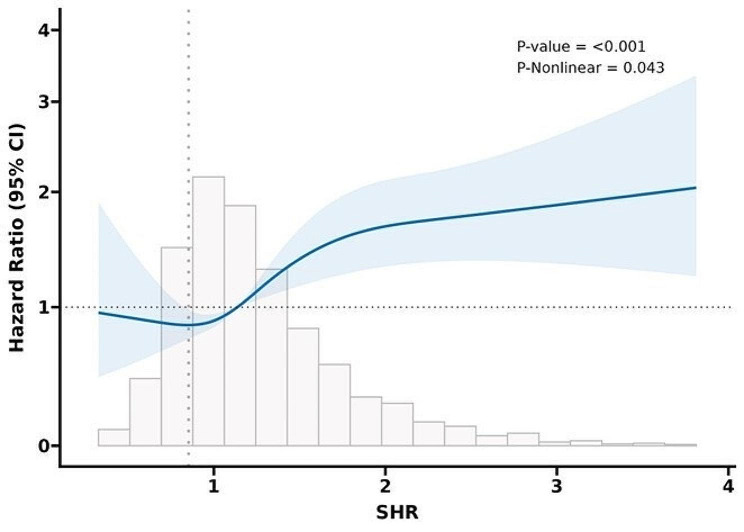
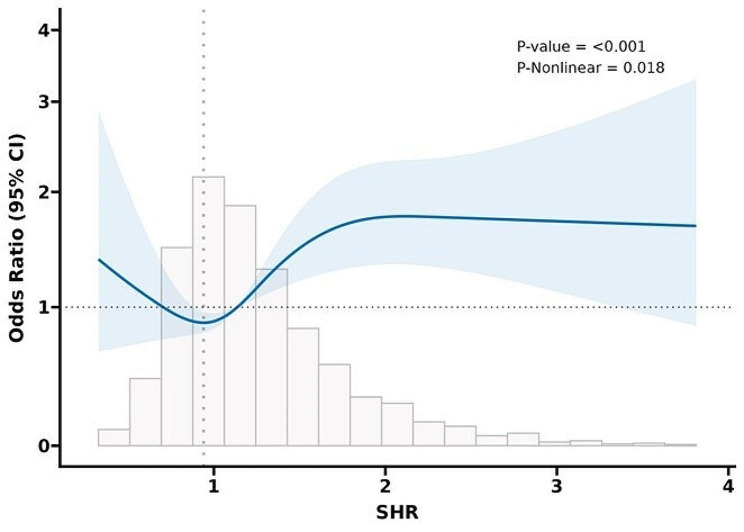
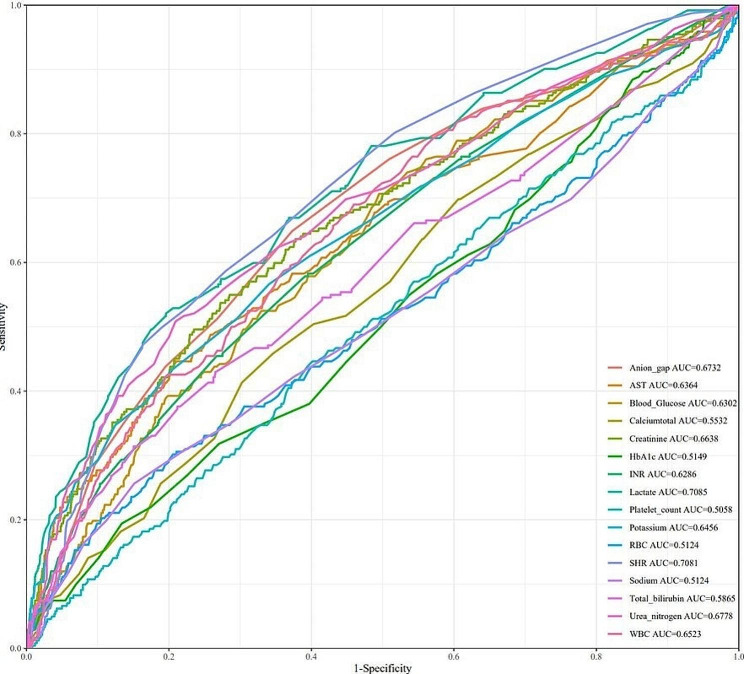
Results: Data from 2312 patients who were diagnosed with sepsis were analyzed. Restricted cubic splines demonstrated a "U-shaped" association between the SHR and survival rate, indicating that an increase in the SHR is related to an increased risk of adverse events. A higher SHR was significantly associated with an increased risk of 28-day mortality and in-hospital mortality in patients with sepsis (HR > 1, P < 0.05) compared to a lower SHR. Boruta feature selection showed that SHR had a higher Z score, and the model built using the rsf algorithm showed the best performance (AUC = 0.8322).
Conclusion: The SHR exhibited a U-shaped relationship with 28-day all-cause mortality and in-hospital mortality in critically ill patients with sepsis. A high SHR is significantly correlated with an increased risk of adverse events, thus indicating that is a potential predictor of adverse outcomes in patients with sepsis.
Keywords: Boruta algorithm; Critical illness; Machine learning; Sepsis; Stress hyperglycemia ratio.
© 2024. The Author(s).
Conflict of interest statement
The authors declare that the research was conducted in the absence of any commercial or financial relationships that could be construed as potential conflicts of interest.
Figures
References
-
- Singer M, Deutschman CS, Seymour CW, Shankar-Hari M, Annane D, Bauer M, Bellomo R, Bernard GR, Chiche JD, Coopersmith CM, Hotchkiss RS, Levy MM, Marshall JC, Martin GS, Opal SM, Rubenfeld GD, van der Poll T, Vincent JL, Angus DC. The third international consensus definitions for sepsis and septic shock (Sepsis-3) JAMA. 2016;315(8):801–10. doi: 10.1001/jama.2016.0287. - DOI - PMC - PubMed
-
- Rudd KE, Johnson SC, Agesa KM, Shackelford KA, Tsoi D, Kievlan DR, Colombara DV, Ikuta KS, Kissoon N, Finfer S, Fleischmann-Struzek C, Machado FR, Reinhart KK, Rowan K, Seymour CW, Watson RS, West TE, Marinho F, Hay SI, Lozano R, Lopez AD, Angus DC, Murray CJL, Naghavi M. Global, regional, and national sepsis incidence and mortality, 1990–2017: analysis for the Global Burden of Disease Study. Lancet. 2020;395(10219):200–211. doi: 10.1016/S0140-6736(19)32989-7. - DOI - PMC - PubMed
-
- Ferreira JA, Baptista RM, Monteiro SR, Gonçalves FM, Monteiro PF, Gonçalves LM. Admission hyperglycemia and all-cause mortality in diabetic and non-diabetic patients with acute myocardial infarction: a tertiary center analysis. Intern Emerg Med. 2021;16(8):2109–2119. doi: 10.1007/s11739-021-02693-0. - DOI - PubMed
Publication types
MeSH terms
Substances
Grants and funding
LinkOut - more resources
Full Text Sources
Medical
