. 2024 Aug;15(4):1283-1297.
doi: 10.1002/jcsm.13474. Epub 2024 May 9.

Inflammation-associated intramyocellular lipid alterations in human pancreatic cancer cachexia

Affiliations

Inflammation-associated intramyocellular lipid alterations in human pancreatic cancer cachexia

Min Deng et al. J Cachexia Sarcopenia Muscle. 2024 Aug.

Abstract

Background: Cancer cachexia is a multifactorial metabolic syndrome characterized by systemic inflammation and ongoing skeletal muscle loss resulting in weakness, poor quality of life, and decreased survival. Whereas lipid accumulation in skeletal muscle is associated with cancer cachexia as well as the prognosis of cancer patients, surprisingly little is known about the nature of the lipids that accumulate in the muscle during cachexia, and whether this is related to inflammation. We aimed to identify the types and distributions of intramyocellular lipids in patients with and without cancer cachexia.

Methods: Rectus abdominis muscle biopsies were collected during surgery of patients with pancreatic ductal adenocarcinoma (n = 10 without cachexia, n = 20 cachectic without inflammation (CRP < 10 mg/L), n = 10 cachectic with inflammation (CRP ≥ 10 mg/L). L3-CT scans were analysed to assess body composition based on validated thresholds in Hounsfield units (HU). Muscle sections were stained with Oil-Red O and H&E to assess general lipid accumulation and atrophy. Untargeted lipidomic analyses were performed on laser-microdissected myotubes using LC-MS/MS. The spatial distribution of intramyocellular lipids with differential abundance between groups was visualized by mass-spectrometry imaging. Genes coding for inflammation markers and enzymes involved in de novo ceramide synthesis were studied by qPCR.

Results: Muscle radiation attenuation was lower in cachectic patients with inflammation (median 24.3 [18.6-30.8] HU) as compared with those without inflammation (34.2 [29.3-38.7] HU, P = 0.033) or no cachexia (37.4 [33.9-42.9] HU, P = 0.012). Accordingly, intramyocellular lipid content was lower in non-cachectic patients (1.9 [1.6-2.1]%) as compared with those with cachexia with inflammation (5.5 [4.5-7.3]%, P = 0.002) or without inflammation (4.8 [2.6-6.0]%, P = 0.017). Intramyocellular lipid accumulation was associated with both local IL-6 mRNA levels (rs = 0.57, P = 0.015) and systemic CRP levels (rs = 0.49, P = 0.024). Compared with non-cachectic subjects, cachectic patients had a higher relative abundance of intramyocellular glycerophospholipids and a lower relative abundance of glycerolipids. Furthermore, increases in several intramyocellular lipids such as SM(d36:1), PC(34:1), and TG(48:1) were found in cachectic patients with inflammation and correlated with specific cachexia features. Altered intramyocellular lipid species such as PC(34:1), LPC(18:2), and TG(48:1) showed an uneven distribution in muscle sections of cachectic and non-cachectic patients, with areas featuring abundance of these lipids next to areas almost devoid of them.

Conclusions: Intramyocellular lipid accumulation in patients with cachexia is associated with both local and systemic inflammation, and characterized by changes in defined lipid species such as glycerolipids and glycerophospholipids.

Keywords: Cancer cachexia; Ceramides; Intramyocellular lipid; LC–MS/MS; Lipidomics; Mass spectrometry imaging; Muscle atrophy.


Conflict of interest statement

The authors declare no current or potential conflicts of interest.

Figures

Figure 1
Figure 1
Comparison of body composition between non‐cachectic patients and cachectic patients with or without inflammation. (A) Original cross‐sectional CT images at the third lumbar vertebra from a non‐cachectic patient (panel A, top left), a cachectic patient without inflammation (panel A, middle left), and a cachectic patient with inflammation (panel A, bottom left), and CT segmentation using SliceOmatic for these respective patients, with SMRA values displayed. Colour‐coding: skeletal muscle (red), subcutaneous adipose tissue (blue), intermuscular adipose tissue (green), and visceral adipose tissue (yellow). (B) Comparison of SMRA in PDAC patients without cachexia (n = 12) and in cachectic patients with (n = 12) or without (n = 24) inflammation. Scatter plots show the median with interquartile range and individual data points in each group. For statistical analysis, the Kruskal–Wallis test followed by Dunn's multiple comparisons test was used. Significant differences among the groups are signified by asterisks (*P < 0.05).
Figure 2
Figure 2
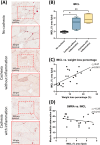
Intramyocellular lipid content and its relationship with body weight loss and CT‐derived muscle radiation attenuation in PDAC patients. (A) Representative images of Oil‐Red O stained abdominal muscle tissue from patients without cachexia (top panel), cachectic patients without inflammation (middle panel), and cachectic patients with inflammation (bottom panel). (B) Quantitation of intramyocellular lipid (IMCL) content (%) in muscle of non‐cachectic patients and cachectic patients with or without inflammation. (C) IMCL content (%) is positively correlated with body weight loss (%) but not correlated with skeletal muscle radiation attenuation (SMRA) (D) as assessed by L3‐CT‐scan analysis. No cachexia (n = 6); cachectic without inflammation (n = 9); cachectic with inflammation (n = 6). For statistical analysis, the Kruskal–Wallis test followed by Dunn's multiple comparisons test was used; significant differences among the groups are signified by asterisks (*P < 0.05, **P < 0.01). Spearman's rank correlation coefficient (r s ) and level of significance are indicated in the respective plots.
Figure 3
Figure 3
Distribution of intramyocellular lipid classes in relation to cachexia and systemic inflammation. Intramyocellular lipids in non‐cachectic PDAC patients (n = 10) (A), and cachectic PDAC patients with (n = 10) (B) or without (n = 20) (C) inflammation were analysed by LC–MS/MS. (D) Comparison of the relative quantities of major lipid classes between non‐cachectic patients and cachectic patients with or without inflammation. Statistical analyses were performed using multiple t‐tests with a false discovery rate (FDR) < 0.01. Data in the bar graph are presented as mean + SEM (***P < 0.001).
Figure 4
Figure 4
Partial least square discriminant analysis (PLS‐DA) models discriminate cachectic patients with inflammation (n = 10) from patients without inflammation (n = 20) and from non‐cachectic patients (n = 10). (A) PLS‐DA score plots showed clustering of patient groups. (B) VIP scores of top 15 lipid species identified by PLS‐DA in descending order of importance. The heatmaps on the right indicate the relative concentrations of the corresponding intramyocellular lipid species in each group under study.
Figure 5
Figure 5
Ceramide content and expression of genes encoding enzymes controlling de novo ceramide synthesis in skeletal muscle of cachectic versus non‐cachectic PDAC patients. (A) Intramyocellular ceramide species in non‐cachectic patients (n = 10) and cachectic patients with (n = 10) or without inflammation (n = 20). (B) mRNA expression of genes coding for enzymes involved in de novo ceramides synthesis in skeletal muscle of PDAC patients. Statistical analyses were performed using multiple t‐tests with a false discovery rate (FDR) < 0.01 for Figure 7A, and ***P < 0.001 indicates differences from the control group (no cachexia). Statistical comparison for multiple groups in Figure 7B was evaluated using the Kruskal–Wallis test followed by Dunn's multiple comparisons test. The line reflects the median; the hinges of the boxes are drawn at the 25th and 75th percentile. The dots, squares and triangles in panels (A) and (B) reflect the outliers as defined by the Tukey method.
Figure 6
Figure 6
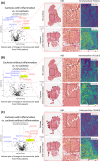
Distribution of lipid species with altered intramyocellular abundance in PDAC patients. Left panels: Volcano plots of intramyocellular lipid species identified by LC–MS/MS in the depicted patient groups. No cachexia (n = 10), cachexia without inflammation (n = 20), cachexia with inflammation (n = 10). Each point in the volcano graph represents a single lipid species. Red dots indicate upregulation and blue dots indicate downregulation, using a P‐value threshold of 0.05 (horizontal black dotted line) and a fold change of >1.5 or <−1.5 (vertical black dotted lines). Right panels: MALDI‐MSI revealed differences in the spatial distribution of PC(34:1), LPC(18:2), and TG(48:1) in the designated patient groups. Representative histological and molecular images are depicted. COV, coefficient of variation; H&E, haematoxylin and eosin staining.
Figure 7
Figure 7
Correlation matrix of altered intramyocellular lipid species as identified by LC–MS/MS and cachexia features. The peak area of altered intramyocellular lipid species was log base 10 transformed. Blue indicates positive correlations and red indicates inverse correlations. BMI, body mass index; L3‐SMI, L3‐muscle index; SMRA, skeletal muscle radiation attenuation. Significant correlation coefficients are signified by asterisks (*P < 0.05, **P < 0.01, ***P < 0.001).

References

    1. Baracos VE, Martin L, Korc M, Guttridge DC, Fearon KCH. Cancer‐associated cachexia. Nat Rev Dis Primers 2018;4:17105. - PubMed
    1. Argilés JM, Busquets S, Stemmler B, López‐Soriano FJ. Cancer cachexia: Understanding the molecular basis. Nat Rev Cancer 2014;14:754–762. - PubMed
    1. Gabiatti CTB, Martins MCL, Miyazaki DL, Silva LP, Lascala F, Macedo LT, et al. Myosteatosis in a systemic inflammation‐dependent manner predicts favorable survival outcomes in locally advanced esophageal cancer. Cancer Med 2019;8:6967–6976. - PMC - PubMed
    1. van Dijk DPJ, Zhao J, Kemter K, Baracos VE, Dejong CHC, Rensen SS, et al. Ectopic fat in liver and skeletal muscle is associated with shorter overall survival in patients with colorectal liver metastases. J Cachexia Sarcopenia Muscle 2021;12:983–992. - PMC - PubMed
    1. Aleixo GFP, Shachar SS, Nyrop KA, Muss HB, Malpica L, Williams GR. Myosteatosis and prognosis in cancer: Systematic review and meta‐analysis. Crit Rev Oncol Hematol 2020;145:102839. - PubMed