. 2024 Apr 25:15:1352766.
doi: 10.3389/fphys.2024.1352766. eCollection 2024.

In the fed state, autophagy plays a crucial role in assisting the insect vector Rhodnius prolixus mobilize TAG reserves under forced flight activity

Affiliations

In the fed state, autophagy plays a crucial role in assisting the insect vector Rhodnius prolixus mobilize TAG reserves under forced flight activity

Samara Santos-Araujo et al. Front Physiol. .

Abstract

Autophagy is a cellular degradation pathway mediated by highly conserved autophagy-related genes (Atgs). In our previous work, we showed that inhibiting autophagy under starvation conditions leads to significant physiological changes in the insect vector of Chagas disease Rhodnius prolixus; these changes include triacylglycerol (TAG) retention in the fat body, reduced survival and impaired locomotion and flight capabilities. Herein, because it is known that autophagy can be modulated in response to various stimuli, we further investigated the role of autophagy in the fed state, following blood feeding. Interestingly, the primary indicator for the presence of autophagosomes, the lipidated form of Atg8 (Atg8-II), displayed 20%-50% higher autophagic activation in the first 2 weeks after feeding compared to the third week when digestion was complete. Despite the elevated detection of autophagosomes, RNAi-mediated suppression of RpAtg6 and RpAtg8 did not cause substantial changes in TAG or protein levels in the fat body or the flight muscle during blood digestion. We also found that knockdown of RpAtg6 and RpAtg8 led to modest modulations in the gene expression of essential enzymes involved in lipid metabolism and did not significantly stimulate the expression of the chaperones BiP and PDI, which are the main effectors of the unfolded protein response. These findings indicate that impaired autophagy leads to slight disturbances in lipid metabolism and general cell proteostasis. However, the ability of insects to fly during forced flight until exhaustion was reduced by 60% after knockdown of RpAtg6 and RpAtg8. This change was accompanied by TAG and protein increases as well as decreased ATP levels in the fat body and flight muscle, indicating that autophagy during digestion, i.e., under fed conditions, is necessary to sustain high-performance activity.

Keywords: Chagas disease; Rhodnius prolixus; autophagy; flight activity; lipophagy.


Conflict of interest statement

The authors declare that the research was conducted in the absence of any commercial or financial relationships that could be construed as a potential conflict of interest. The author(s) declared that they were an editorial board member of Frontiers, at the time of submission. This had no impact on the peer review process and the final decision.

Figures

FIGURE 1
FIGURE 1
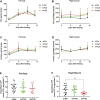
Expression of RpAtg8 and RpAtg6 and autophagosome formation during the reproductive cycle. Adult females were dissected on different days after feeding. RpAtg8 and RpAtg6 mRNA levels were determined by qPCR using Rp18S expression as a reference gene. (A) Quantification of RpAtg6 and RpAtg8 mRNA in the fat body. (B) Quantification of RpAtg6 and RpAtg8 mRNA in the flight muscle. The graphs show the means ± SEMs (n = 5–7). (C) RpAtg8 immunoblot on the 7th, 14th, and 24th days after feeding in the fat body. (D) RpAtg8 immunoblot on the 7th, 14th, and 24th days after feeding in the flight muscle. RpAtg8-I: free RpAtg8; RpAtg8-II: lipidated RpAtg8. (E and F) RpAtg8-II/RpAtg8-I densitometry on the 7th, 14th, and 24th days after feeding in the fat body and flight muscle, respectively (n = 3). p> 0.05 when compared by one-way ANOVA.
FIGURE 2
FIGURE 2
Knockdown of RpAtg6 and RpAtg8 in the fat body and flight muscle. Adult females were injected with 1 µg of dsRNA for RpAtg6, RpAtg8, or Mal (control) and fed 3 days later; the insects were dissected on the 5th and 10th days after feeding. The mRNA levels were determined by qPCR using Rp18S expression as a reference gene. (A,B) Quantification of RpAtg6 and RpAtg8 mRNA levels in the fat body. (C,D) Quantification of RpAtg6 and RpAtg8 mRNA in the flight muscle. (E) RpAtg8 immunoblot of fat body proteins on the 5th day. The graphs show the means ± SEMs of 4 independent experiments (n = 4). **p < 0.01, ***p < 0.001, ****p < 0.0001, compared with Student’s t-test. (F) Total RpAtg8 densitometry (RpAtg8-I + RpAtg8-II). (G) RpAtg8 immunoblot of fat body proteins on the 10th day. (H) Total RpAtg8 densitometry. (I) RpAtg8 immunoblot of flight muscle proteins on the 5th day. (J) Total RpAtg8 densitometry. (K) RpAtg8 immunoblot of flight muscle proteins on the 10th day. (L) Total RpAtg8 densitometry. RpAtg8-I: free RpAtg8. RpAtg8-II: lipidated RpAtg8. The graphs show the means ± SEMs of 4 independent experiments (n = 4). **p < 0.01, compared by one-way ANOVA followed by Tukey’s post hoc test.
FIGURE 3
FIGURE 3
Females knockdown for RpAtg6 and RpAtg8 did not show changes in TAG content in the fat body and flight muscle. Adult females were injected with 1 µg of dsRNA for RpAtg6, RpAtg8, or Mal (control) and fed 3 days later; the insects were dissected on different days after feeding. Fat bodies and flight muscles were obtained, washed, and individually homogenized, after which the total amounts of TAG (A and B) and protein (C and D) were determined. The graphs show the means ± SDs (n = 12–21) *p < 0.05 (Day 5, dsMal × dsAtg8) compared with two-way ANOVA followed by Tukey’s post hoc test. The total abdominal ventral fat body and all the flight muscles in the thorax were dissected, and the results are shown as µg per organ. (E and F) Intracellular ATP levels were quantified in the fat body and flight muscle 10 days after the blood meal. The graphs show the means ± SDs (n = 8–21 females; obtained from 4 independent experiments). **p < 0.01, compared by one-way ANOVA followed by Tukey’s post hoc test.
FIGURE 4
FIGURE 4
Females knockdown for RpAtg6 and RpAtg8 display alterations in the diameters of lipid droplets in the fat body. Adult females were injected with 1 µg of dsRNA for RpAtg6, RpAtg8, or Mal (control) and fed 3 days later. (A) Lipid droplets (LDs) in freshly dissected fat bodies on the 5th day or (B) the 10th day after feeding from control and knockdown females, stained with Nile Red and observed under a confocal laser scanning microscope. DAPI-stained nuclei were also observed. Bars: 40 µm. (C) Quantification of the maximum diameters of the LDs on the 5th day after feeding. Three experiments were performed, and 2 images from each experiment were quantified. (E) Quantification on the 10th day after feeding. The graphs show the medians ± 5th-95th percentiles of at least 2000 LDs per condition. ****p < 0.0001, when compared by the Kruskal‒Wallis test followed by Dunn’s post hoc test. (D and F) Histograms of the LD diameter distribution. ****p < 0.0001, when compared by chi-square test.
FIGURE 5
FIGURE 5
Knockdown of RpAtg6 and RpAtg8 slightly affects the expression of genes related to lipid metabolism. Adult females were injected with 1 µg of dsRNA for RpAtg6, RpAtg8, or Mal (control) and fed 3 days later. (A–D) Gene expression levels in the fat body were determined by qPCR using specific primers designed for target genes. (E–H) The same procedure was used for the flight muscle. Rp18S amplification was used as an endogenous control. Gene expression levels are relative to each control value (dashed lines). The graphs show the means ± SEMs of 4 independent determinations, n = 4. *p < 0.05, **p < 0.01, ***p < 0.001, ****p < 0.0001, compared by Student’s t-test. AKHr, adipokinetic hormone receptor; Bmm, Brummer lipase; CPT1, carnitine palmitoyltransferase I; GPAT1, glycerol-3-phosphate acyltransferase 1; GPAT4, glycerol-3-phosphate acyltransferase 4; ACSL2, long chain acyl-CoA synthetase 2; ACC, acetyl-CoA carboxylase; DGAT1, diacylglycerol acyltransferase 1; DGAT2, diacylglycerol acyltransferase 2.
FIGURE 6
FIGURE 6
Females knockdown for RpAtg6 and RpAtg8 present changes in the ER morphology in the fat body. Adult females were injected with 1 µg of dsRNA for RpAtg6, RpAtg8, or Mal (control) and fed 3 days later. (A–D) Expression levels of the ER chaperones BiPs and PDIs in the fat body of knockdown females determined by qPCR. (E–H) Expression levels of the ER chaperones BiPs and PDIs in the flight muscle of knockdown females determined by qPCR. Rp18S amplification was used as an endogenous control. Gene expression levels are relative to each control value (dashed lines). The graphs show the means ± SEMs of 4 independent determinations, n = 4. *p < 0.05, when compared by Student’s t-test. (I) Dissected fat bodies on the 10th day after feeding of control or knockdown females were fixed with 4% paraformaldehyde, stained with anti-Kdel and Nile Red, and observed under a confocal laser scanning microscope. DAPI-stained nuclei were also observed. Bars: 40 µm.
FIGURE 7
FIGURE 7
Females knockdown for RpAtg6 and RpAtg8 exhibit reduced flight capacity accompanied by reduced ATP levels. Adult females were injected with 1 µg of dsRNA for RpAtg6, RpAtg8, or Mal (control). Three days later, the animals were fed and subjected to a forced flight test on the 10th day after feeding. (A) The duration of flight activity until exhaustion was individually recorded. n = 9 (dsMal), n = 10 (dsAtg6) and n = 8 (dsAtg8). After the forced flight, the females were dissected, and TAG levels were quantified in (B) the fat body and (C) the flight muscle. The total protein levels after the flight were also quantified in the fat body (D) and the flight muscle (E). (F–G) Intracellular ATP levels in the fat body and flight muscle were quantified after the forced flight assays. The graphs show the means ± SDs. *p < 0.05, **p < 0.01, ***p < 0.001, ****p < 0.0001 when compared by one-way ANOVA followed by Tukey’s post hoc test.

References

    1. Almeida-Oliveira F., Santos-Araujo S., Carvalho-Kelly L. F., Macedo-Silva A., Meyer-Fernandes J. R., Gondim K. C., et al. (2023). ATP synthase affects lipid metabolism in the kissing bug Rhodnius prolixus beyond its role in energy metabolism. Insect Biochem. Mol. Biol. 158, 103956. 10.1016/j.ibmb.2023.103956 - DOI - PubMed
    1. Alves-Bezerra M., De Paula I. F., Medina J. M., Silva-Oliveira G., Medeiros J. S., Gäde G., et al. (2016a). Adipokinetic hormone receptor gene identification and its role in triacylglycerol metabolism in the blood-sucking insect Rhodnius prolixus . Insect Biochem. Mol. Biol. 69, 51–60. 10.1016/j.ibmb.2015.06.013 - DOI - PubMed
    1. Alves-Bezerra M., Gondim K. C. (2012). Triacylglycerol biosynthesis occurs via the glycerol-3-phosphate pathway in the insect Rhodnius prolixus . BBA - Mol. Cell Biol. Lipids 1821, 1462–1471. 10.1016/j.bbalip.2012.08.002 - DOI - PubMed
    1. Alves-Bezerra M., Klett E. L., De Paula I. F., Ramos I. B., Coleman R. A., Gondim K. C. (2016b). Long-chain acyl-CoA synthetase 2 knockdown leads to decreased fatty acid oxidation in fat body and reduced reproductive capacity in the insect Rhodnius prolixus . Biochim. Biophys. Acta Mol. Cell Biol. Lipids 1861, 650–662. 10.1016/j.bbalip.2016.04.007 - DOI - PMC - PubMed
    1. Alves-Bezerra M., Majerowicz D., Grillo L. A. M., Tremonte H., Almeida C. B., Braz G. R. C., et al. (2010). Serotonin regulates an acyl-CoA-binding protein (ACBP) gene expression in the midgut of Rhodnius prolixus . Insect Biochem. Mol. Biol. 40, 119–125. 10.1016/j.ibmb.2010.01.002 - DOI - PubMed

LinkOut - more resources