. 2024 May 5;20(7):2763-2778.
doi: 10.7150/ijbs.93075. eCollection 2024.

Multi-Omics profiling identifies aldehyde dehydrogenase 2 as a critical mediator in the crosstalk between Treg-mediated immunosuppression microenvironment and hepatocellular carcinoma

Affiliations

Multi-Omics profiling identifies aldehyde dehydrogenase 2 as a critical mediator in the crosstalk between Treg-mediated immunosuppression microenvironment and hepatocellular carcinoma

Zhi-Yong Liu et al. Int J Biol Sci. .

Abstract

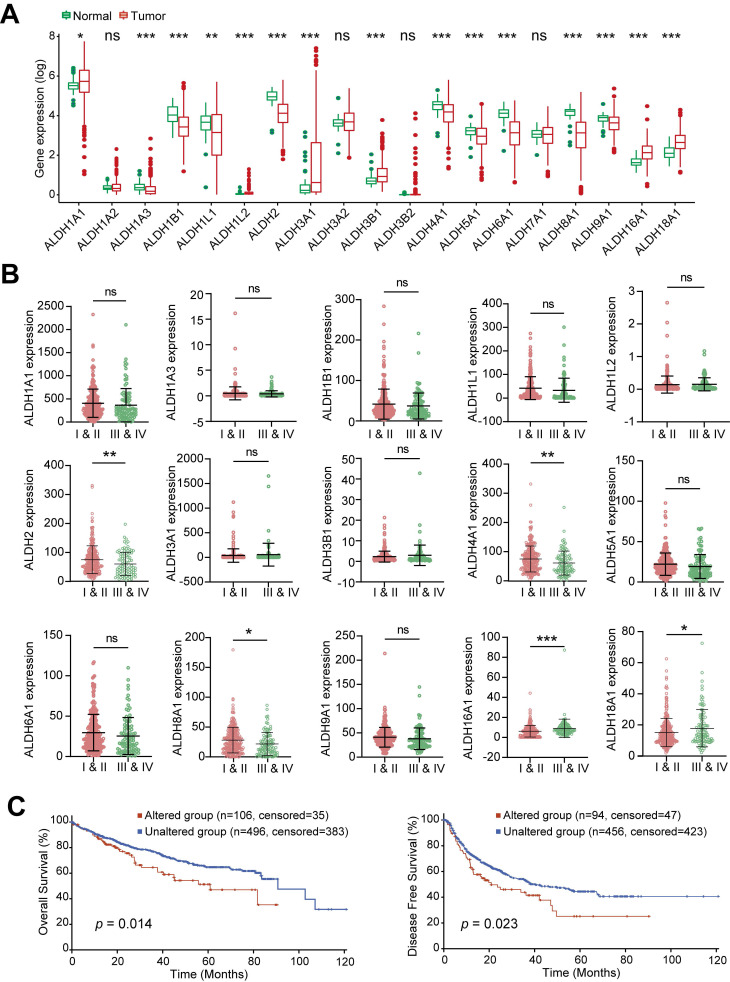
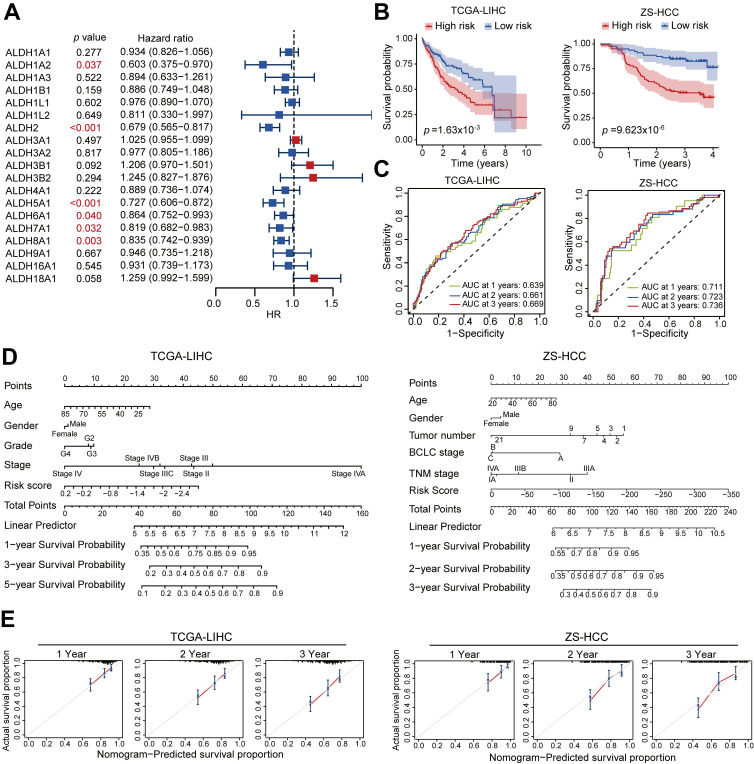
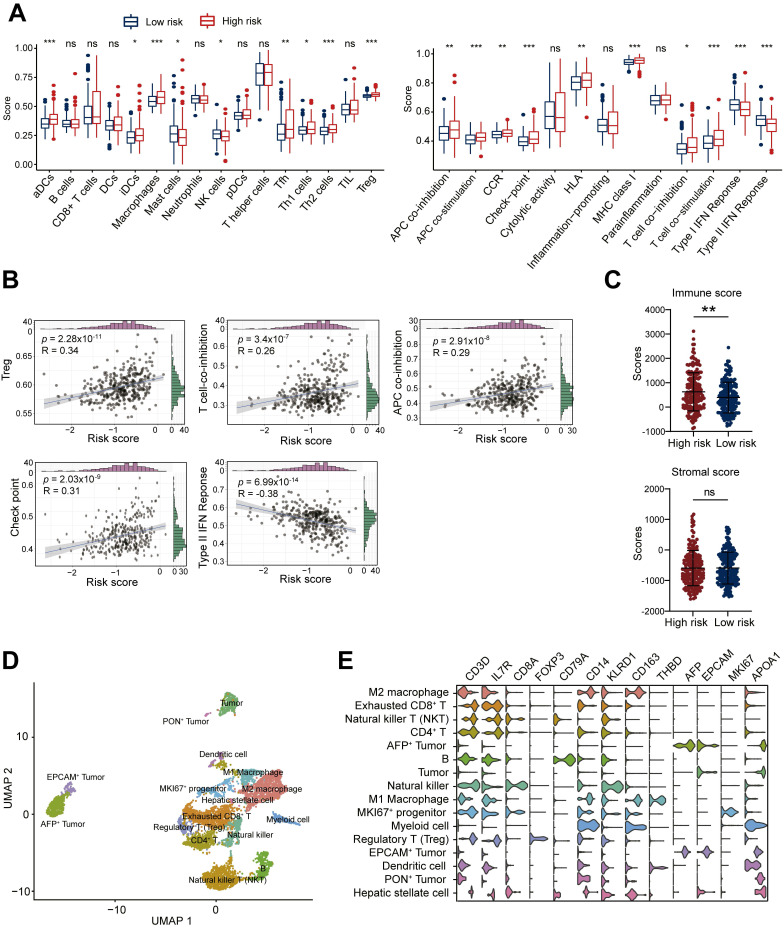
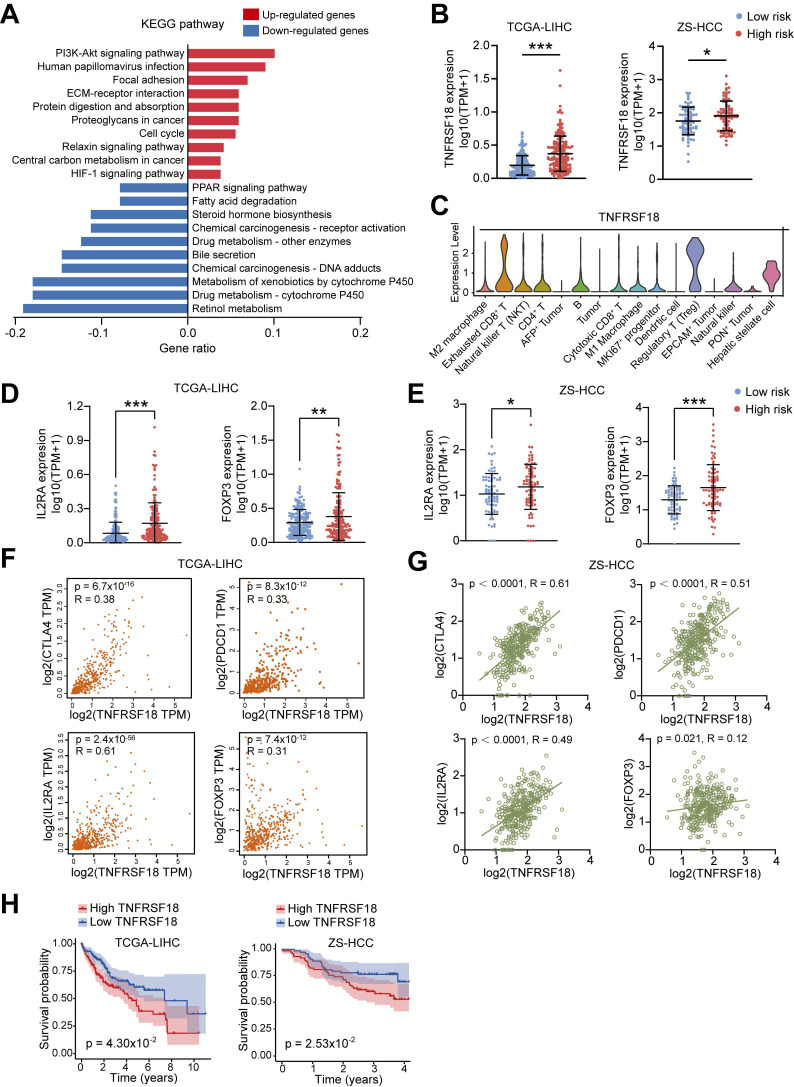
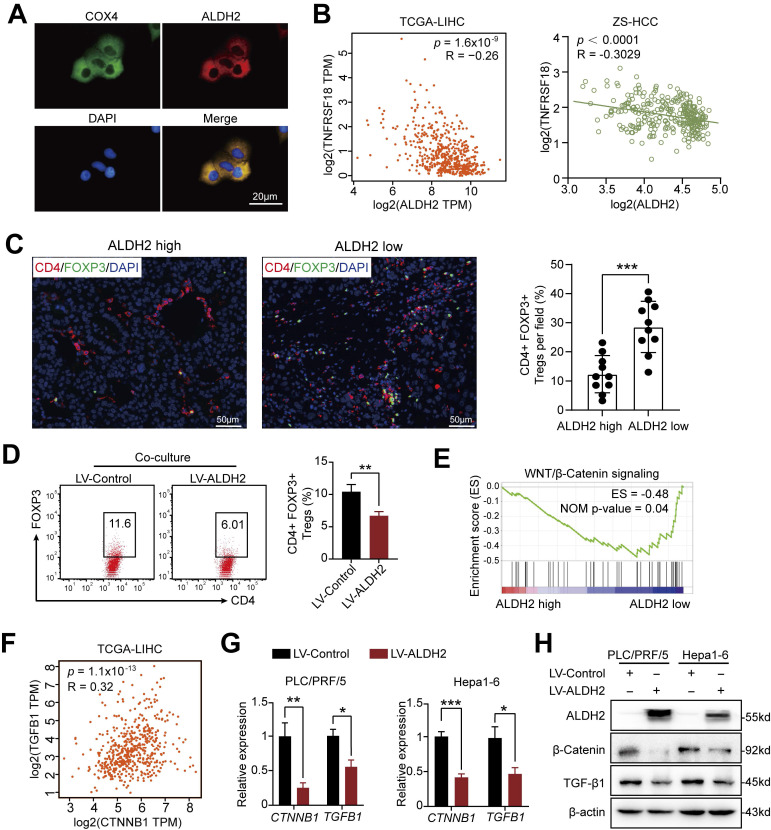
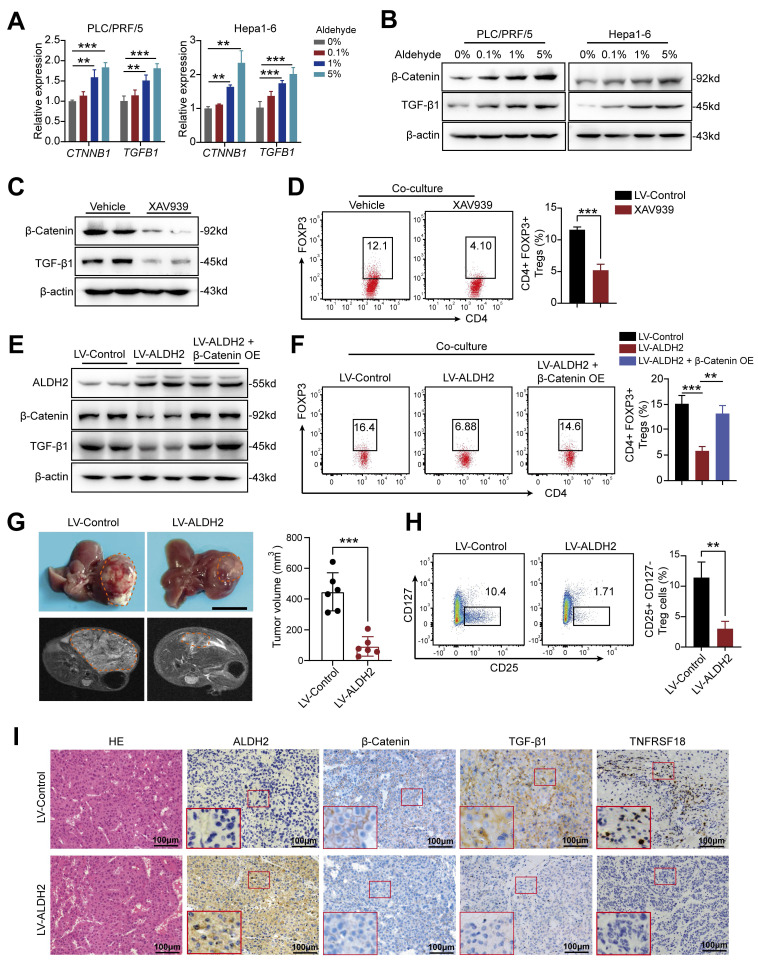
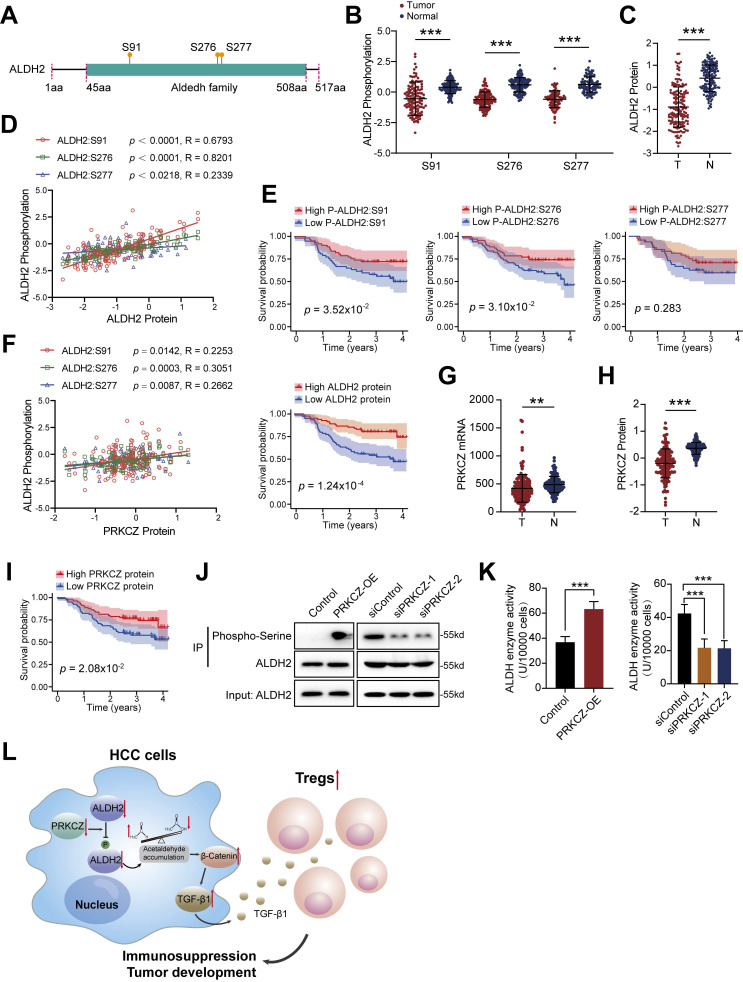
Dysregulation of the aldehyde dehydrogenase (ALDH) family has been implicated in various pathological conditions, including cancer. However, a systematic evaluation of ALDH alterations and their therapeutic relevance in hepatocellular carcinoma (HCC) remains lacking. Herein, we found that 15 of 19 ALDHs were transcriptionally dysregulated in HCC tissues compared to normal liver tissues. A four gene signature, including ALDH2, ALDH5A1, ALDH6A1, and ALDH8A1, robustly predicted prognosis and defined a high-risk subgroup exhibiting immunosuppressive features like regulatory T cell (Tregs) infiltration. Single-cell profiling revealed selective overexpression of tumor necrosis factor receptor superfamily member 18 (TNFRSF18) on Tregs, upregulated in high-risk HCC patients. We identified ALDH2 as a tumor suppressor in HCC, with three novel phosphorylation sites mediated by protein kinase C zeta that enhanced enzymatic activity. Mechanistically, ALDH2 suppressed Tregs differentiation by inhibiting β-catenin/TGF-β1 signaling in HCC. Collectively, our integrated multi-omics analysis defines an ALDH-Tregs-TNFRSF18 axis that contributes to HCC pathogenesis and represents potential therapeutic targets for this aggressive malignancy.

Keywords: ALDH2; Liver cancer; Metabolic disturbance; Regulatory T cells; TNFRSF18 (GITR).


Conflict of interest statement

Competing Interests: The authors have declared that no competing interest exists.

Figures

Figure 1
Figure 1
Dysregulated Expression and Clinical Impact of ALDHs in HCC. (A) Differential expression analysis of 19 ALDH genes in 379 HCC tumors versus 59 normal liver tissues from TCGA. Boxplots depict 6 upregulated (ALDH1A1, ALDH1L2, ALDH3A1, ALDH3B1, ALDH16A1, ALDH18A1) and 9 downregulated (ALDH1A3, ALDH1B1, ALDH1L1, ALDH2, ALDH4A1, ALDH5A1, ALDH6A1, ALDH8A1, ALDH9A1) ALDHs in HCC. (B) ALDH2, ALDH4A1, ALDH8A1 exhibited lower expression while ALDH16A1, ALDH18A1 showed higher levels in advanced stage III/IV HCC patients compared to early stages I/II. (C) Kaplan-Meier analysis demonstrating significantly reduced overall survival (left) and disease-free survival (right) in HCC patients harboring mutations in ALDH genes. Unpaired Student's t-test in (A, B); Log-rank test in (C). * p < 0.05, ** p < 0.01, *** p < 0.001.
Figure 2
Figure 2
An ALDH gene expression signature defines a robust prognostic risk model in HCC. (A) Univariate Cox regression analysis of ALDH gene expression and overall survival in TCGA-LIHC cohort. Six genes (ALDH1A2, ALDH2, ALDH5A1, ALDH6A1, ALDH7A1, ALDH8A1) were significantly associated with prognosis (red). (B) Kaplan-Meier survival curves stratified by high- vs. low-risk groups based on a 4-gene signature (ALDH2, ALDH5A1, ALDH6A1, ALDH8A1) in TCGA-LIHC training set (n = 361, left) and an independent ZS-HCC validation cohort (n= 159, right). High-risk patients exhibited significantly reduced overall survival. (C) Time-dependent receiver operating characteristic (ROC) curves demonstrate robust prognostic performance of the 4-ALDH risk model in TCGA-LIHC (left) and ZS-HCC (right) cohorts across 1-, 2-, and 3-year overall survival. (D) A nomogram integrating the ALDH risk score with clinicopathologic features to facilitate individualized survival prediction in HCC patients across TCGA-LIHC and ZS-HCC cohorts. (E) Calibration plots confirm excellent agreement between predicted and observed 1-, 2-, and 3-year overall survival probabilities using the nomogram in both TCGA-LIHC (left) and ZS-HCC (right) datasets.
Figure 3
Figure 3
High ALDH risk score defines an immunosuppressive tumor microenvironment in HCC. (A) Single-sample gene set enrichment analysis (ssGSEA) comparing immune cell infiltration and functions between high- and low-risk ALDH groups in the TCGA-LIHC cohort. High-risk tumors exhibited increased macrophages, Tregs, and suppression of anti-tumor immunity. (B) The ALDH risk score positively correlated with Treg infiltration, T cell co-inhibition, antigen-presenting cell (APC) co-inhibition, and checkpoint expression, while negatively associating with type II interferon response in HCC. (C) Immune cytolytic scoring revealed elevated immune infiltration but comparable stromal content in the high- versus low-risk ALDH groups. (D) Uniform Manifold Approximation and Projection (UMAP) of 19,126 single-cell transcriptomes from 6 HCC patients, defining 16 major cell populations in the tumor microenvironment. (E) Violin plots depicting expression of canonical marker genes across the 16 clusters, highlighting the presence of exhausted CD8+ T cells, immunosuppressive M2 macrophages, and Tregs. Unpaired student's t-test was used in (A, C). Pearson correlation analysis was used in (B). * p < 0.05, ** p < 0.01, *** p < 0.001, ns, not significant.
Figure 4
Figure 4
TNFRSF18 upregulation defines an immunosuppressive, treatment-resistant phenotype in ALDHs high-risk HCC subset. (A) Top 10 KEGG pathway enrichment of upregulated genes (red) in the high ALDH risk group showing associations with oncogenic signaling, while downregulated genes (blue) linked to metabolic processes. (B) TNFRSF18 exhibiting increased expression in the high versus low ALDH risk HCC patients across TCGA-LIHC and ZS-HCC cohorts. (C) Single-cell transcriptomics revealed selective TNFRSF18 expression within Treg cluster. (D, E) Classical Treg markers FOXP3 and IL2RA were upregulated in the high ALDH risk group in TCGA-LIHC (D) and ZS-HCC (E) cohorts. (F-G) TNFRSF18 expression positively correlated with immune checkpoint genes CTLA4, PDCD1 as well as Treg markers IL2RA, FOXP3 in TCGA-LIHC (F) and ZS-HCC (G) cohorts. (H) High TNFRSF18 expression stratified a subgroup with significantly reduced overall survival in TCGA-LIHC (left) and ZS-HCC (right) cohorts. Unpaired student's t-test was used in (B, D, E). Pearson correlation analysis was used in (F, G). Kaplan-Meier analysis was used in (H). * p < 0.05, ** p < 0.01, *** p < 0.001.
Figure 5
Figure 5
ALDH2 overexpression suppresses Tregs differentiation in HCC via Inhibition of the β-Catenin/TGF-β1 Signaling. (A) Immunofluorescence demonstrating mitochondrial localization of ALDH2 (red) in HCC cells, co-stained with mitochondrial marker COX4 (green). (B) ALDH2 mRNA levels inversely correlated with TNFRSF18 expression in TCGA-LIHC and ZS-HCC cohorts. (C) Immunofluorescence quantification of CD4+FOXP3+ Tregs infiltration in ALDH2-high and -low HCC specimens. (D) In vitro co-culture of Hepa1-6 cells overexpressing ALDH2 with CD4+ T cells revealed reduced differentiation of CD4+FOXP3+ Tregs. (E) Gene set enrichment analysis showed negative association between ALDH2 expression and the WNT/β-catenin signalling. (F) ALDH2 mRNA levels inversely correlated with CTNNB1 and TGFB1 expression in TCGA-LIHC cohort. (G-H) ALDH2 overexpression suppressed CTNNB1, TGFB1 mRNA (G) and protein (H) levels in HCC cells. Unpaired student's t-test was used in (C, D, G). Pearson correlation analysis was used in (B, F). * p < 0.05, ** p < 0.01, *** p < 0.001.
Figure 6
Figure 6
ALDH2 overexpression inhibits HCC development via suppression of the β-Catenin/TGF-β signaling. (A-B) Extrinsic aldehyde increased the mRNA (A) and protein levels (B) of CTNNB1 and TGFB1 in a concentration-dependent manner in HCC cells. (C) XAV939, a WNT/β-Catenin inhibitor, inhibited protein levels of β-Catenin and TGF-β1. (D) XAV939 treatment inhibited the differentiation of CD4+FOXP3+ Treg in a co-culture assay with Hepa1-6 cells. (E) Western blot analysis showing ALDH2 overexpression downregulated β-Catenin and TGF-β1, which was rescued by β-Catenin overexpression. (F) ALDH2 overexpression attenuated the differentiation of CD4+FOXP3+ Treg in a co-culture with CD4+ T cells, which was rescued by β-Catenin overexpression. (G) Bright-field and magnetic resonance imaging showing ALDH2 overexpression inhibited HCC development in orthotopic HCC model. Scale bar, 1cm. (H) Flow cytometry analysis revealed lower infiltration of CD4+CD25+CD127- Treg in ALDH2-overexpressing HCC tumors. (I) Immunohistochemistry staining showed decreased protein levels of ALDH2, β-Catenin, TGF-β1, and TNFRSF18 in ALDH2-overexpressing HCC tumors. Unpaired student's t-test was used in (D, G, H). one-way ANOVA analysis was used in (A, F). * p < 0.05, ** p < 0.01, *** p < 0.001.
Figure 7
Figure 7
PRKCZ mediates ALDH2 phosphorylation and is associated with prognosis in HCC. (A) Three novel phosphorylation modification sites of ALDH2 (S91, S276, S277) were identified in HCC. (B) The phosphorylation levels of these ALDH2 sites were decreased in HCC tissues compared to normal liver tissues. (C) ALDH2 protein levels were down-regulated in HCC tissues. (D) ALDH2 protein levels positively correlated with its phosphorylation levels at S91, S276, and S277. (E) Low phosphorylation levels of ALDH2 at S91 and S276, along with low ALDH2 protein levels, were associated with poor prognosis in HCC patients. (F) PRKCZ protein levels positively correlated with ALDH2 phosphorylation at S91, S276, and S277. (G-H) PRKCZ mRNA (G) and protein (H) expression were downregulated in HCC tissues compared to normal liver. (I) Low PRKCZ protein levels were associated with poor prognosis in HCC patients. (J) Immunoprecipitation assay showing PRKCZ overexpression promoted, while PRKCZ knockdown attenuated, ALDH2 serine phosphorylation in HCC cells. (K) PRKCZ overexpression increased, while PRKCZ knockdown decreased, ALDH enzymatic activity. (L) Schematic diagram illustrating that ALDH2 downregulation promotes HCC tumorigenesis by enhancing Treg differentiation through the β-Catenin/TGF-β1 signaling. Unpaired student's t-test was used in (B, C, G, H, K). Pearson correlation analysis was used in (D, F). Kaplan-Meier analysis was used in (E, I). ** p < 0.01, *** p < 0.001.

References

    1. Siegel RL, Miller KD, Fuchs HE. et al. Cancer Statistics, 2021. CA Cancer J Clin. 2021;71:7–33. - PubMed
    1. Hu B, Yu M, Ma X. et al. Interferon-a potentiates anti-PD-1 efficacy by remodeling glucose metabolism in the hepatocellular carcinoma microenvironment. Cancer Discov. 2022;12:1718–1741. - PubMed
    1. Wu Q, Li L, Miao C. et al. Osteopontin promotes hepatocellular carcinoma progression through inducing JAK2/STAT3/NOX1-mediated ROS production. Cell Death Dis. 2022;13:341. - PMC - PubMed
    1. Zhang HF, Klein Geltink RI, Parker SJ. et al. Transsulfuration, minor player or crucial for cysteine homeostasis in cancer. Trends Cell Biol. 2022;32:800–814. - PMC - PubMed
    1. Wong AM, Ding X, Wong AM. et al. Unique molecular characteristics of NAFLD-associated liver cancer accentuate β-catenin/TNFRSF19-mediated immune evasion. J Hepatol. 2022;77:410–423. - PubMed

Publication types

MeSH terms

Substances