. 2024 Apr 8;20(7):2339-2355.
doi: 10.7150/ijbs.90645. eCollection 2024.

Uncovering a Novel Functional Interaction Between Adult Hepatic Progenitor Cells, Inflammation and EGFR Signaling During Bile Acids-Induced Injury

Affiliations

Uncovering a Novel Functional Interaction Between Adult Hepatic Progenitor Cells, Inflammation and EGFR Signaling During Bile Acids-Induced Injury

Juan García-Sáez et al. Int J Biol Sci. .

Abstract

Chronic cholestatic damage is associated to both accumulation of cytotoxic levels of bile acids and expansion of adult hepatic progenitor cells (HPC) as part of the ductular reaction contributing to the regenerative response. Here, we report a bile acid-specific cytotoxic response in mouse HPC, which is partially impaired by EGF signaling. Additionally, we show that EGF synergizes with bile acids to trigger inflammatory signaling and NLRP3 inflammasome activation in HPC. Aiming at understanding the impact of this HPC specific response on the liver microenvironment we run a proteomic analysis of HPC secretome. Data show an enrichment in immune and TGF-β regulators, ECM components and remodeling proteins in HPC secretome. Consistently, HPC-derived conditioned medium promotes hepatic stellate cell (HSC) activation and macrophage M1-like polarization. Strikingly, EGF and bile acids co-treatment leads to profound changes in the secretome composition, illustrated by an abolishment of HSC activating effect and by promoting macrophage M2-like polarization. Collectively, we provide new specific mechanisms behind HPC regulatory action during cholestatic liver injury, with an active role in cellular interactome and inflammatory response regulation. Moreover, findings prove a key contribution for EGFR signaling jointly with bile acids in HPC-mediated actions.

Keywords: Bile acids; EGFR; Hepatic Progenitor Cell; Inflammation; Liver Disease; Secretome.


Conflict of interest statement

Competing Interests: The authors have declared that no competing interest exists.

Figures
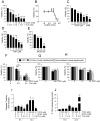
Figure 1
Figure 1
Cytotoxic effect of bile acids and the cholestatic agent ANIT in HPC. A-E. Cells were serum starved and treated or not for 24 h with: (A) different concentrations of GCDC (1-2mM) + TCA (0.5-1mM). Cell viability was analysed by crystal violet staining. Data are mean± S.E.M. of 2-6 experiments run in duplicate; (B) different concentrations of GCDC (0.1-2mM) + TCA (0.5mM). Cell viability was analysed by MTT assay. Data are mean ± S.D. from one representative experiment run in sextuplicates; (C) different concentrations of TCDC (25-1000 μM). Cell viability was analysed by crystal violet staining. Data are mean± S.E.M. of 3-6 experiments run in duplicate; (D) different concentrations of ANIT (1-50μM). Cell viability was analysed by crystal violet staining; (E) bile from 3 different mice in different dilutions (1:4; 1:6 and 1:8). Cell viability was analyzed by cell counting with Neubauer Chamber. Data are mean± S.E.M. of 3 experiments run in duplicate. F-H. HPC, primary mouse hepatocytes and immortalized mouse hepatocytes were treated with: (F) GCDC (1-1.5mM) + TCA (0.5mM); (G) TCDC (100 μM); (H) ANIT (10-25μM) for 24 h. Cell viability was analysed by crystal violet staining. Data are mean± S.E.M. of 3-8 experiments run in triplicate. I. Caspase-3 activity in HPC treated or not with GCDC (1mM) + TCA (0.5mM) or TCDC (100-200μM) for 8h or 16 h. Data are mean ± S.E.M. of 4-6 independent experiments and are expressed as fold change of untreated cells (8h). J. LDH release assay in HPC treated or not with GCDC (1mM) + TCA (0.5mM) or TCDC (100-200μM) for 15h or 24 h. Data are mean ± S.E.M. (n=6). A-J: Data were compared with the untreated group or as indicated, *p<0.05; **p<0.01 and ***p<0.001.
Figure 2
Figure 2
Effect of EGFR ligands on cell viability in HPC treated with bile acids. A-C. Cells were serum starved and treated or not for 1 or 6 h with (A-B) EGF (20 ng/mL) or (C) HB-EGF (20 ng/mL) prior to adding (A) GCDC (1mM) + TCA (0.5mM) (G+T); (B-C) TCDC (100μM). Cell viability was analysed after 24 h by crystal violet staining. Data are mean± S.E.M. of 3 experiments run in duplicate. D. Cells were serum starved and treated or not with ANIT (10 and 25μM) ± EGF (20 ng/mL) (co-treatment). Cell viability was analysed after 24 h by crystal violet staining. Data are mean± S.E.M. of 6 experiments run in duplicate. E-F. Cells were serum starved, pretreated for 1 h with gefitinib (2.5μM) and treated for 24 h with (E) GCDC (1mM) + TCA (0.5mM) (G+T) or (F) TCDC (100μM). Cell viability was analysed by crystal violet staining in (E) or by cell counting with Neubauer chamber in (F). Data are mean± S.E.M. of 4 and 3 experiments, run in duplicate or triplicate, respectively. A-F. Data were compared with the untreated group or as indicated, *p<0.05; **p<0.01 and ***p<0.001.
Figure 3
Figure 3
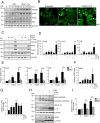
Activation of an inflammatory response by bile acids in HPC: Involvement of the EGFR pathway. A. Western blot analysis for phosphorylated STAT3 (P-STAT3), p38MAPK (P-P38) and IκBα (P-IκBα), and total IκBα, in HPC treated or not with TCDC (100μM) or GCDC (1mM) + TCA (0.5mM) for different periods of time. A representative experiment out of 5 is shown. B. Confocal microscopy images of p65 staining in cells treated or not with TCDC (100μM) or GCDC (1mM) + TCA (0.5mM) for 30 min. An Alexa 488-conjugated secondary antibody was used. Representative images out of 2 experiments are shown. Scale bar =30 μm. Arrows mark p65 nuclear translocation. C. Western blot analysis for phosphorylated STAT3 (P-STAT3), p38MAPK (P-P38) and IκBα (P-IκBα), and for total IκBα in HPC pretreated for 1h with gefitinib (2.5μM) prior to adding TCDC (100μM) (T) or GCDC (1mM) + TCA (0.5mM) (G+T) for 10 or 30 min. Representative blots are shown. D-E. RT-qPCR analysis of the expression of Cxcl2, Cxcl1 and Il6 in HPC treated or not with: (D) EGF (20ng/mL), TCDC (100μM) or GCDC (1mM) + TCA (0.5mM) (G+T) for 15 h (Cxcl2 and Cxcl1) or 1 h (Il6); (E) gefitinib (2.5μM) for 1 h prior to adding TCDC (100μM) or GCDC (1mM) + TCA (0.5mM) (G+T) for 15 h (Cxcl2 and Cxcl1) or 1 h (Il6). Gusb was used for normalization. Data are expressed relative to untreated cells (assigned an arbitrary value of 1) and are mean of 3-7 independent experiments. F. RT-qPCR analysis of the expression of Nlrp3 in HPC treated or not with EGF (20ng/mL), TCDC (100μM) or GCDC (1mM) + TCA (0.5mM) (G+T) for 1 h. Gusb was used for normalization. Data are expressed relative to untreated cells (assigned an arbitrary value of 1) and are mean of 3-7 independent experiments. G. Caspase 1 activity in cells treated or not with EGF (20 ng/mL), TCDC (100μM) or GCDC (1mM) + TCA (0.5mM) for 1 h. Data are mean ± S.E.M. of 5-10 independent experiments and are expressed as fold change of untreated cells (assigned an arbitrary value of 1). H. Western blot analysis for PRO-CASPASE 1, CLEAVED-CASPASE 1, PRO-IL-1β, IL-1β and NLRP3 in HPC treated or not with EGF (20 ng/mL), TCDC (100μM) or GCDC (1mM) + TCA (0.5mM) (G+T) for 30 min. A representative experiment out of 3 is shown. I. Caspase 1 activity in cells pretreated for 1 h with gefitinib (2.5μM) prior to adding TCDC (100μM) or GCDC (1mM) + TCA (0.5mM) (G+T) for 1 h. Data are mean ± S.E.M. of 4 independent experiments and are expressed as fold change of untreated cells (assigned an arbitrary value of 1). D, F, G, H. EGF and bile acids were added simultaneously. A-I. Data were compared with the untreated group or as indicated, *p<0.05; **p<0.01 and ***p<0.001.
Figure 4
Figure 4
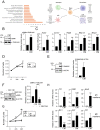
Analysis of HPC secretome. Effect on HSC and macrophages. A. Top significantly enriched reactome pathways in HPC secretome using proteomic data and PANTHER overrepresentation test (left panel). ECM components and proteins involved in intercellular communication with neutrophils, macrophages and HSC are indicated (right panel). B. Western blot analysis for αSMA in GRX cells after 24 h incubation in the absence (-) or presence (CM) of HPC conditioned medium. A representative experiment is shown (left panel). Optical density values are mean ± S.E.M. of 8 independent experiments (right panel). C. RT-qPCR analysis of the expression of HSC activation markers in GRX cells after 8h (Col1a1, Acta2, Pdgfb) or 24 h (Mmp13 and Mmp2) incubation in the absence (-) or presence (CM) of HPC conditioned medium. Gusb was used for normalization. Data are expressed relative to cells in the absence of CM (assigned an arbitrary value of 1) and are mean ± S.E.M. of 4-7 independent experiments. D. Cell counting of GRX cells incubated for 24 or 48 h in the absence (-) or presence (CM) of HPC conditioned medium. Data are expressed relative to day 0 and are mean ± S.E.M. of 3 independent experiments run in triplicate. E. Western blot analysis for phosphorylated SMAD2 (P-SMAD2) in GRX cells after 30 min incubation in the absence (-) or presence (CM) of HPC conditioned medium. A representative experiment is shown (left panel). Optical density values are mean ± S.E.M. of 4 independent experiments (right panel). F. Western blot analysis for αSMA in GRX cells after 24 h incubation in the absence (-) or presence (CM) of HPC conditioned medium with (+) or without (-) 2 h pretreatment with SB 431542 (10 μM). A representative experiment is shown (left panel). Optical density values are mean ± S.E.M. of 3 independent experiments (right panel). G. Cell counting of GRX cells incubated for 24 h or 48 h in the absence (-) or presence (CM) of HPC conditioned medium with (+) or without (-) 2 h pretreatment with SB431542 (10μM). Data are expressed relative to day 0 and are mean ± S.E.M. of 3 independent experiments run in triplicate. H. RT-qPCR analysis of the expression of M1 (Il12, Cd80, Nos2) and M2 markers (Mrc1, Arg1, Il10) in mouse peritoneal macrophages incubated for 24 h in the absence (-) or presence (CM) of HPC conditioned medium. Gusb was used for normalization. Data are expressed relative to macrophages incubated without CM (assigned an arbitrary value of 1) and are mean ± S.E.M. of 4-6 independent experiments. A-H. Data were compared with the cells without CM: *p<0.05; **p<0.01 and ***p<0.001. G: ##p<0.01: Cells incubated with CM with (CM+SB) versus without (CM) SB pretreatment.
Figure 5
Figure 5
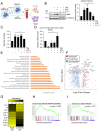
Changes in HPC secretome by treatment with EGF and bile acids. Scheme illustrating the experimental procedure applied to assess HPC-conditioned media under different culture conditions. B. Western blot analysis for αSMA in GRX cells after 24 h incubation with or without HPC conditioned medium (-/+ CM) generated after incubation in the absence (-) or presence of GCDC (1mM) + TCA (0.5mM) (G+T) and/or EGF (20ng/mL) as indicated in A. A representative experiment is shown (left panel). Optical density values are mean ± S.E.M. of 4 independent experiments (right panel). Data are expressed relative to GRX without CM. C. Cell counting of GRX cells treated for 48 h with HPC conditioned media (CM) generated as indicated in A-B. Data are mean ± S.E.M. of 3 independent experiments run in triplicate and are expressed relative to day 0 and GRX without CM. D. RT-qPCR analysis of the expression of M1 (Il12, Cd80, Nos2) and M2 markers (Mrc1, Arg1, Il10) in mouse peritoneal macrophages treated for 24 h with HPC conditioned media (CM) generated as indicated in A-B. Gusb was used for normalization. M1 and M2 markers data are analysed as a group. Data are mean ± S.E.M. of 6 different experiments and expressed relative to macrophages without CM. A-D. Data were compared with cells without CM or as indicated: *p<0.05; **p<0.01 and ***p<0.001. E. Top significantly enriched reactome pathways identified in HPC treated with GCDC + TCA and EGF (combined CM) secretome using proteomic data and PANTHER overrepresentation test. F. Volcano plot of comparative proteomics of HPC basal conditioned medium (basal CM) and HPC conditioned medium after treatment with GCDC + TCA and EGF (combined CM). Proteins significantly upregulated (in red, FC>2) or downregulated (in blue, FC<0.5) in the secretome of combined CM are indicated. Top 50 proteins with lower p value are labeled. Shift in proteins relative abundance is considered significant if p value < 0.05. G. Heatmap representing TGF-β processing and bioavailability regulation-related proteins. H-I. Gene set enrichment analysis. Y-axis represents enrichment score (ES). X-axis: each black line represents a gene represented in the gene set. Significance threshold set at p value <0.05.

References

    1. Marcellin P, Kutala BK. Liver diseases: A major, neglected global public health problem requiring urgent actions and large-scale screening. Liver Int. 2018;38(Suppl 1):2–6. - PubMed
    1. Hirschfield GM, Heathcote EJ, Gershwin ME. Pathogenesis of cholestatic liver disease and therapeutic approaches. Gastroenterology. 2010;139:1481–96. - PubMed
    1. Jansen PL, Ghallab A, Vartak N, Reif R, Schaap FG, Hampe J. et al. The ascending pathophysiology of cholestatic liver disease. Hepatology. 2017;65:722–38. - PubMed
    1. Wu H, Chen C, Ziani S, Nelson LJ, Avila MA, Nevzorova YA, Fibrotic Events in the Progression of Cholestatic Liver Disease. Cells. 2021. 10. - PMC - PubMed
    1. Yokoda RT, Rodriguez EA. Review: Pathogenesis of cholestatic liver diseases. World J Hepatol. 2020;12:423–35. - PMC - PubMed

Publication types