

Segmentation and Volume Estimation of the Habenula Using Deep Learning in Patients With Depression
- PMID: 38726037
- PMCID: PMC11078767
- DOI: 10.1016/j.bpsgos.2024.100314
Segmentation and Volume Estimation of the Habenula Using Deep Learning in Patients With Depression
Abstract
Background: The habenula is involved in the pathophysiology of depression. However, its small structure limits the accuracy of segmentation methods, and the findings regarding its volume have been inconsistent. This study aimed to create a highly accurate habenula segmentation model using deep learning, test its generalizability to clinical magnetic resonance imaging, and examine differences between healthy participants and patients with depression.
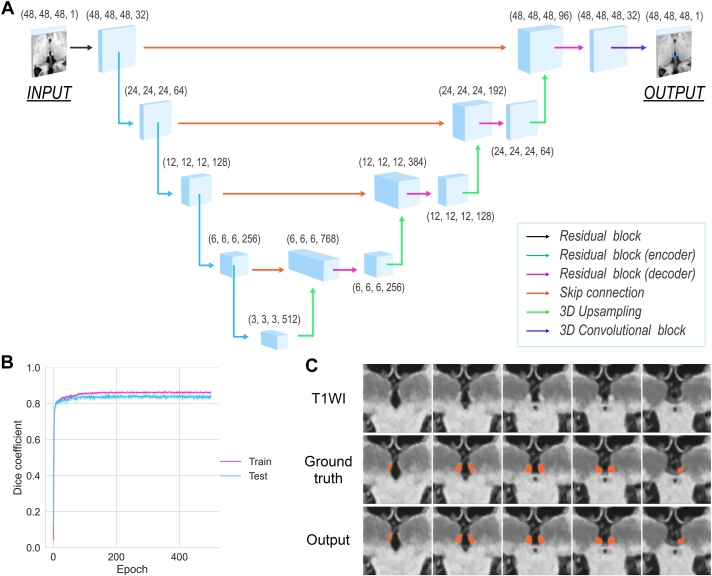
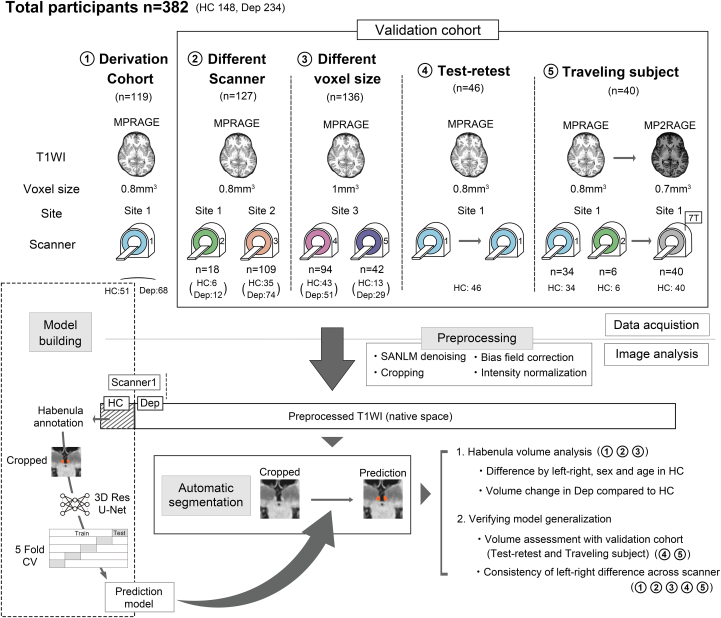
Methods: This multicenter study included 382 participants (patients with depression: N = 234, women 47.0%; healthy participants: N = 148, women 37.8%). A 3-dimensional residual U-Net was used to create a habenula segmentation model on 3T magnetic resonance images. The reproducibility and generalizability of the predictive model were tested on various validation cohorts. Thereafter, differences between the habenula volume of healthy participants and that of patients with depression were examined.
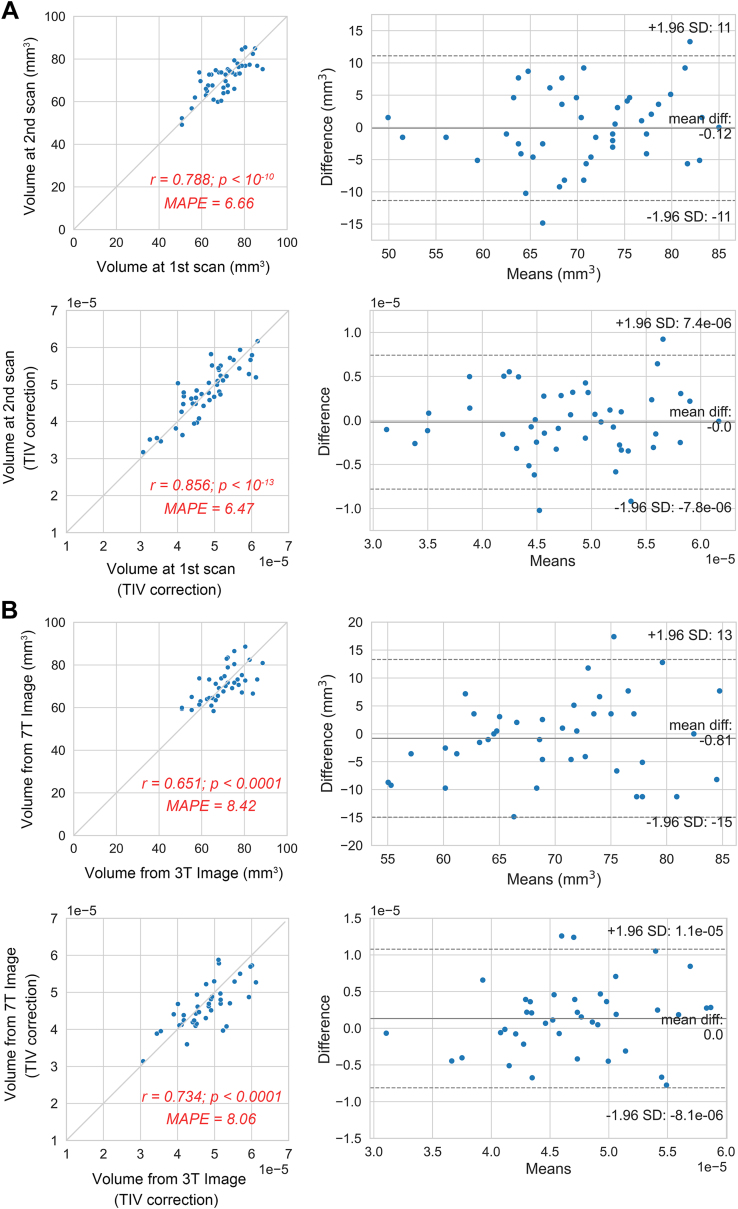
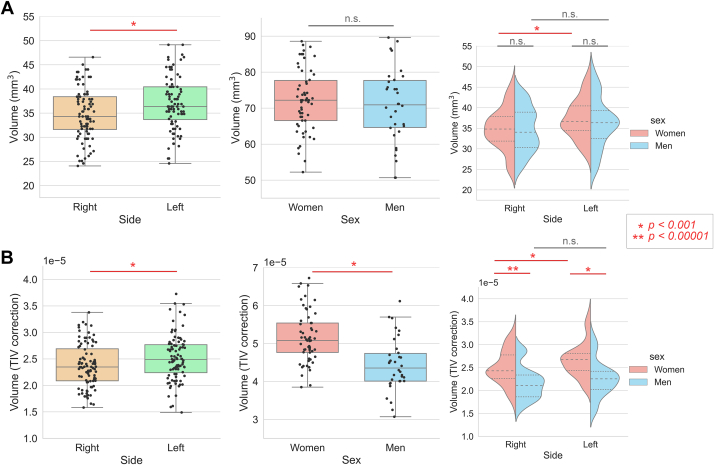
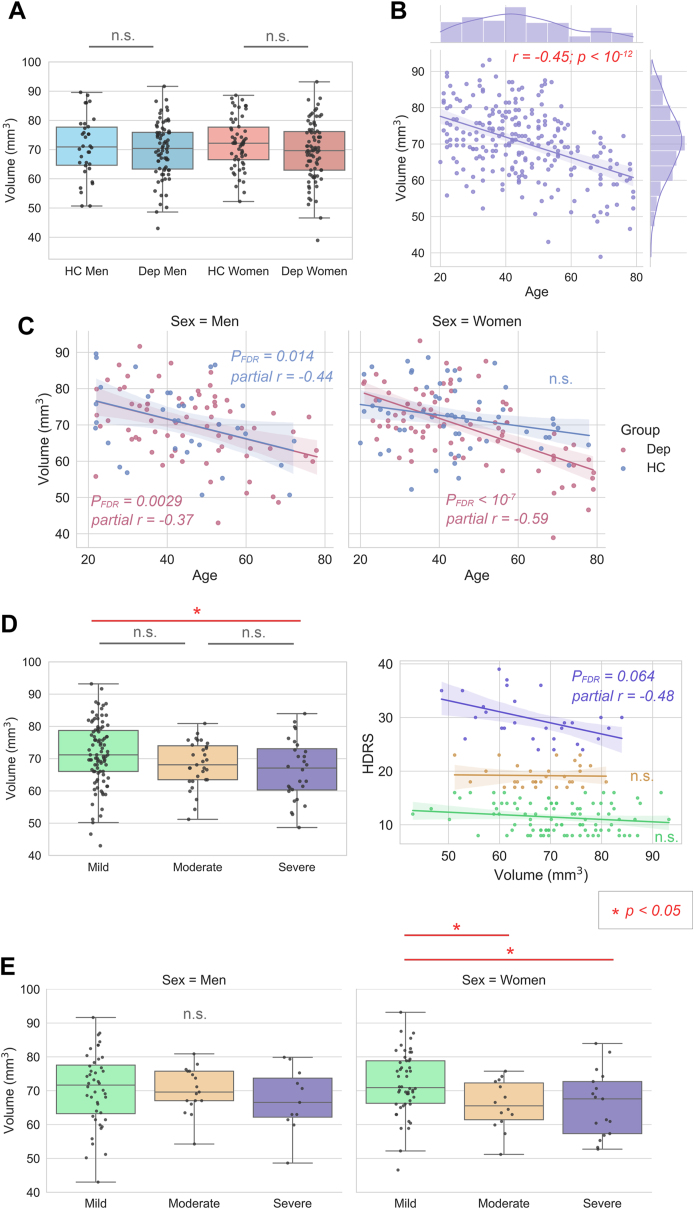
Results: A Dice coefficient of 86.6% was achieved in the derivation cohort. The test-retest dataset showed a mean absolute percentage error of 6.66, indicating sufficiently high reproducibility. A Dice coefficient of >80% was achieved for datasets with different imaging conditions, such as magnetic field strengths, spatial resolutions, and imaging sequences, by adjusting the threshold. A significant negative correlation with age was observed in the general population, and this correlation was more pronounced in patients with depression (p < 10-7, r = -0.59). Habenula volume decreased with depression severity in women even when the effects of age and scanner were excluded (p = .019, η2 = 0.099).
Conclusions: Habenula volume could be a pathophysiologically relevant factor and diagnostic and therapeutic marker for depression, particularly in women.
Keywords: Deep learning; Depression; Habenula; Image analysis; Sex differences; Structural MRI.
Plain language summary
Accurate segmentation of the habenula, a brain region implicated in depression, is challenging. In this study, we developed an automated human habenula segmentation model using deep learning techniques. The model was confirmed to be reproducible and generalizable at various spatial resolutions. Application of this model to a multicenter dataset confirmed that habenula volume decreased with age in healthy volunteers, an association that was more pronounced in individuals with depression. In addition, habenula volume decreased with the severity of depression in women. This novel model for habenula segmentation enables further study of the role of the habenula in depression.
© 2024 The Authors.
Figures
Similar articles
-
Reproducibility of automated habenula segmentation via deep learning in major depressive disorder and normal controls with 7 Tesla MRI.Sci Rep. 2021 Jun 29;11(1):13445. doi: 10.1038/s41598-021-92952-z. Sci Rep. 2021. PMID: 34188141 Free PMC article. Clinical Trial.
-
Reproducibility of myelin content-based human habenula segmentation at 3 Tesla.Hum Brain Mapp. 2018 Jul;39(7):3058-3071. doi: 10.1002/hbm.24060. Epub 2018 Mar 26. Hum Brain Mapp. 2018. PMID: 29582505 Free PMC article.
-
Automatic prostate segmentation using deep learning on clinically diverse 3D transrectal ultrasound images.Med Phys. 2020 Jun;47(6):2413-2426. doi: 10.1002/mp.14134. Epub 2020 Apr 8. Med Phys. 2020. PMID: 32166768
-
Automated Magnetic Resonance Image Segmentation of Spinal Structures at the L4-5 Level with Deep Learning: 3D Reconstruction of Lumbar Intervertebral Foramen.Orthop Surg. 2022 Sep;14(9):2256-2264. doi: 10.1111/os.13431. Epub 2022 Aug 18. Orthop Surg. 2022. PMID: 35979964 Free PMC article.
-
Significant heterogeneity in structural asymmetry of the habenula in the human brain: A systematic review and meta-analysis.Hum Brain Mapp. 2023 Jul;44(10):4165-4182. doi: 10.1002/hbm.26337. Epub 2023 May 17. Hum Brain Mapp. 2023. PMID: 37195040 Free PMC article.
Cited by
-
Electroconvulsive therapy-specific volume changes in nuclei of the amygdala and their relationship to long-term anxiety improvement in depression.Mol Psychiatry. 2025 Jun;30(6):2653-2664. doi: 10.1038/s41380-024-02874-1. Epub 2024 Dec 16. Mol Psychiatry. 2025. PMID: 39681629 Free PMC article.
-
Association between the subclinical level of problematic internet use and habenula volume: a look at mediation effect of neuroticism.Gen Psychiatr. 2025 Feb 10;38(1):e101694. doi: 10.1136/gpsych-2024-101694. eCollection 2025. Gen Psychiatr. 2025. PMID: 39944777 Free PMC article.
-
The disappointment centre of the brain gets exciting: a systematic review of habenula dysfunction in depression.Transl Psychiatry. 2024 Dec 19;14(1):499. doi: 10.1038/s41398-024-03199-x. Transl Psychiatry. 2024. PMID: 39702626 Free PMC article.
References
-
- Namboodiri V.M., Rodriguez-Romaguera J., Stuber G.D. The habenula. Curr Biol. 2016;26:R873–R877. - PubMed
-
- Hu H., Cui Y., Yang Y. Circuits and functions of the lateral habenula in health and in disease. Nat Rev Neurosci. 2020;21:277–295. - PubMed
-
- Yang Y., Cui Y., Sang K., Dong Y., Ni Z., Ma S., Hu H. Ketamine blocks bursting in the lateral habenula to rapidly relieve depression. Nature. 2018;554:317–322. - PubMed
LinkOut - more resources
Full Text Sources
