. 2024 Apr 29;13(9):760.
doi: 10.3390/cells13090760.

JAK/STAT Inhibition Normalizes Lipid Composition in 3D Human Epidermal Equivalents Challenged with Th2 Cytokines

Affiliations

JAK/STAT Inhibition Normalizes Lipid Composition in 3D Human Epidermal Equivalents Challenged with Th2 Cytokines

Enrica Flori et al. Cells. .

Abstract

Derangement of the epidermal barrier lipids and dysregulated immune responses are key pathogenic features of atopic dermatitis (AD). The Th2-type cytokines interleukin IL-4 and IL-13 play a prominent role in AD by activating the Janus Kinase/Signal Transduction and Activator of Transcription (JAK/STAT) intracellular signaling axis. This study aimed to investigate the role of JAK/STAT in the lipid perturbations induced by Th2 signaling in 3D epidermal equivalents. Tofacitinib, a low-molecular-mass JAK inhibitor, was used to screen for JAK/STAT-mediated deregulation of lipid metabolism. Th2 cytokines decreased the expression of elongases 1, 3, and 4 and serine-palmitoyl-transferase and increased that of sphingolipid delta(4)-desaturase and carbonic anhydrase 2. Th2 cytokines inhibited the synthesis of palmitoleic acid and caused depletion of triglycerides, in association with altered phosphatidylcholine profiles and fatty acid (FA) metabolism. Overall, the ceramide profiles were minimally affected. Except for most sphingolipids and very-long-chain FAs, the effects of Th2 on lipid pathways were reversed by co-treatment with tofacitinib. An increase in the mRNA levels of CPT1A and ACAT1, reduced by tofacitinib, suggests that Th2 cytokines promote FA beta-oxidation. In conclusion, pharmacological inhibition of JAK/STAT activation prevents the lipid disruption caused by the halted homeostasis of FA metabolism.

Keywords: 3D skin model; JAK/STAT; Th2 cytokines; atopic dermatitis; skin lipidomics.


Conflict of interest statement

E.C. and G.C. were, respectively, the principal investigator (PI) and the Co-PI of this research project funded by Pfizer. A.C. received a research fellowship granted by Pfizer.

Figures
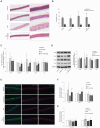
Figure 1
Figure 1
Effects of JAK/STAT inhibition by tofacitinib on the Th2-mediated changes in epidermal morphology and barrier protein/enzyme expression. (A) Hematoxylin and eosin staining (H&E) of paraffin-embedded 3D HEEs treated with vehicle Th2 (IL-4 and IL-13), and tofacitinib. Histological analysis of Th2-treated HEEs showed characteristic AD morphologic features such as epidermal thickening and increased spaces between adjacent keratinocytes (arrows). Scale bars: 50 µm, 20 µm. (B) Quantitative analysis of epidermal and SC thickness; *** p ˂ 0.001 vs. vehicle; $$ p ˂ 0.01 vs. Th2. (C) Quantitative RT-PCR analysis of K10, CASP14, FLG, LOR, and IVL, performed on 3D HEEs and HEEs treated with Th2 cytokines and tofacitinib. All values of mRNA expression were normalized against the expression of GAPDH and were expressed relative to vehicle (taken as 1). Data represented the mean ± SD of three independent experiments; * p ˂ 0.05 vs. vehicle; $ p ˂ 0.05 vs. Th2. (D) Western blot analysis of K10, FLG, LOR, and IVL protein expression performed on 3D HEEs and Th2-HEEs treated with tofacitinib. Representative blots are shown. GAPDH was used as endogenous loading control. Densitometric scanning of band intensities was performed to quantify the change in protein expression. Results were expressed as the fold change respect to vehicle (taken as 1-fold). Data represented the mean ± SD of three independent experiments; * p ˂ 0.05 vs. vehicle; $$ p ˂ 0.01 vs. Th2. (E) Immunofluorescence and (F) quantitative analyses of FLG (green), LOR (red), and IVL (red); * p ˂ 0.05 vs. vehicle; $$ p ˂ 0.01 vs. Th2, and of (G) pro-FLG and FLG on stratum granulosum and stratum corneum, respectively on serial sections of 3D HEEs and HEEs treated with tofacitinib and Th2 cytokines; * p ˂ 0.05 and *** p ˂ 0.001 vs. vehicle; $ p ˂ 0.05 vs. Th2. Nuclei were counterstained with DAPI (blue). Scale bar: 50 µm.
Figure 2
Figure 2
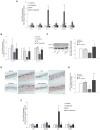
Effects of JAK/STAT inhibition by tofacitinib on the Th2-mediated changes in the expression of inflammatory and lipid genes. Quantitative RT-PCR analysis of (A) IL-1α, IL-1β, IL-6, IL-8, CCL26, and PDPN (B) ELOVL1, ELOVL3, and ELOVL4, performed on 3D HEEs and Th2-HEEs treated with tofacitinib. All values of mRNA expression were normalized against the expression of GAPDH and were expressed relative to vehicle (taken as 1). Data represented the mean ± SD of three independent experiments; * p ˂ 0.05, ** p ˂ 0.01 vs. vehicle; $ p ˂0.05, $$ p ˂ 0.01 vs. Th2. (C) Western blot analysis of ELOV1 protein expression performed on 3D HEEs and Th2-HEEs treated with tofacitinib. Representative blots are shown. GAPDH was used as the loading control. Densitometric scanning of band intensities was performed to quantify the change in protein expression. Results were expressed as the fold change respect to vehicle (taken as 1-fold). Data represented the mean ± SD of three independent experiments; * p ˂ 0.05 vs. vehicle; $ p ˂ 0.05 vs. Th2; (D) Immunohistochemical and (E) quantitative analyses of ELOVL1 on 3D HEEs and Th2-HEEs treated with tofacitinib. Nuclei were counterstained with hematoxylin. Scale bars: 20 µm, 10 µm. ** p ˂ 0.01 vs. vehicle; $$ p ˂0.01 vs. Th2. (F) Quantitative RT-PCR analysis of SPT, DEGS2, CA2, and PPARγ, performed on 3D HEEs and Th2-HEEs treated with tofacitinib. All values of mRNA expression were normalized against the expression of GAPDH and were expressed relative to vehicle (taken as 1). Data represented the mean ± SD of three independent experiments; * p ˂ 0.05, ** p ˂ 0.01 vs. vehicle; $ p ˂ 0.05, $$ p ˂ 0.01 vs. Th2.
Figure 3
Figure 3
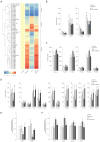
Th2 cytokines IL-4 and IL-13 induce lipid changes through the activation of JAK/STAT pathway. (A) Hierarchical clustering of 51 lipid species resulted significantly modulated in the one-way ANOVA applied to the amounts of the 300 characterized lipids. (B) Ultra-long chain SFAs determined by LCMS. Profiles of abundance of (C) PCs determined by HILIC-MS and of (D) Palmitoleic acid (FA 16:1n-7) determined by GCMS and TGs determined by RP-LCMS in lipid extracts of 3D HEEs treated with vehicle, tofacitinib, Th2 cytokines, and combined tofacitinib and Th2 cytokines. Molar amounts of individual lipids were calculated against same-class deuterated internal standards and were normalized by the protein concentration and expressed as pmol/mg protein. Real Time RT-PCR analysis of (E) PLIN1 and PLIN2, (F) CPT1α, ACAT1, ACADS, and ACOX1, performed on 3D HEEs and HEEs treated with Th2 cytokines and tofacitinib. All values of mRNA expression were normalized against the expression of GAPDH and were expressed as relative to the vehicle (taken as 1). Data represented the mean ± SD of three independent experiments; * p ˂ 0.05, ** p ˂ 0.01 vs. vehicle; $ p ˂ 0.05, $$ p ˂ 0.01 vs. Th2.
Figure 4
Figure 4
Effect of Th2 cytokines and tofacitinib on JAK/STAT signaling. (A) After stimulation with Th2 cytokines (IL-4 and IL-13), activated JAK phosphorylates STATs, which dimerize and translocate to the nucleus. Upon binding to DNA, STATs regulate the transcription of selected genes involved in keratinocyte differentiation, inflammation, and lipid metabolism. As a result, lipid profiles are altered, and the epidermis becomes thicker due to an increase of the space between adjacent keratinocytes. (B) Tofacitinib suppresses STAT phosphorylation through JAK inhibition, counteracting Th2-dependent alterations. PM: plasma membrane; SC: stratum corneum; SG: stratum granulosum; SS: stratum spinosum; SB: stratum basale.

References

    1. Wolf R., Wolf D. Abnormal epidermal barrier in the pathogenesis of atopic dermatitis. Clin. Dermatol. 2012;30:329–334. doi: 10.1016/j.clindermatol.2011.08.023. - DOI - PubMed
    1. Gandhi N.A., Pirozzi G., Graham N.M.H. Commonality of the IL-4/IL-13 pathway in atopic diseases. Expert. Rev. Clin. Immunol. 2017;13:425–437. doi: 10.1080/1744666X.2017.1298443. - DOI - PubMed
    1. Yang G., Seok J.K., Kang H.C., Cho Y., Lee H.S., Lee J.Y. Skin Barrier Abnormalities and Immune Dysfunction in Atopic Dermatitis. Int. J. Mol. Sci. 2020;21:2867. doi: 10.3390/ijms21082867. - DOI - PMC - PubMed
    1. Karim N., Phinney B.S., Salemi M., Wu P., Naeem M., Rice R.H. Human stratum corneum proteomics reveals cross-linking of a broad spectrum of proteins in cornified envelopes. Exp. Dermatol. 2019;28:618–622. doi: 10.1111/exd.13925. - DOI - PubMed
    1. Ishitsuka Y., Roop D.R. Loricrin: Past, Present, and Future. Int. J. Mol. Sci. 2020;21:2271. doi: 10.3390/ijms21072271. - DOI - PMC - PubMed

Publication types

MeSH terms