. 2024 Apr 24;14(9):743.
doi: 10.3390/nano14090743.

A Systematic Genotoxicity Assessment of a Suite of Metal Oxide Nanoparticles Reveals Their DNA Damaging and Clastogenic Potential

Affiliations

A Systematic Genotoxicity Assessment of a Suite of Metal Oxide Nanoparticles Reveals Their DNA Damaging and Clastogenic Potential

Silvia Aidee Solorio-Rodriguez et al. Nanomaterials (Basel). .

Abstract

Metal oxide nanoparticles (MONP/s) induce DNA damage, which is influenced by their physicochemical properties. In this study, the high-throughput CometChip and micronucleus (MicroFlow) assays were used to investigate DNA and chromosomal damage in mouse lung epithelial cells induced by nano and bulk sizes of zinc oxide, copper oxide, manganese oxide, nickel oxide, aluminum oxide, cerium oxide, titanium dioxide, and iron oxide. Ionic forms of MONPs were also included. The study evaluated the impact of solubility, surface coating, and particle size on response. Correlation analysis showed that solubility in the cell culture medium was positively associated with response in both assays, with the nano form showing the same or higher response than larger particles. A subtle reduction in DNA damage response was observed post-exposure to some surface-coated MONPs. The observed difference in genotoxicity highlighted the mechanistic differences in the MONP-induced response, possibly influenced by both particle stability and chemical composition. The results highlight that combinations of properties influence response to MONPs and that solubility alone, while playing an important role, is not enough to explain the observed toxicity. The results have implications on the potential application of read-across strategies in support of human health risk assessment of MONPs.

Keywords: alveolar epithelial cells; comet assay; genotoxicity; lung toxicity; metal oxide nanoparticles; micronucleus; poorly soluble nanomaterials; soluble nanomaterials.


Conflict of interest statement

The authors declare no conflicts of interest. The funders had no role in the design of the study, in the collection, analyses, or interpretation of data, in the writing of the manuscript, or in the decision to publish the results.

Figures

Figure 1
Figure 1
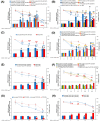
Percentage of DNA in the tail in FE1 cells after exposure to ZnO variants and ZnCl2 at 2 and 4 h. Data are presented as mean and standard error (n = 3–4). Statistically significant differences between the exposed samples and the matched negative control (4 h) were determined through one-way ANOVA with a Dunnett’s post hoc. * p < 0.05, ** p < 0.01, *** p < 0.001. Uncoated ZnO (US3580), ZnO MPs, and ZnCl2 data were previously reported [34].
Figure 2
Figure 2
Percentage of DNA in the tail in FE1 cells after exposure to CuO variants and CuCl2 at 2 and 4 h. Data are presented as mean and standard error (n = 3–4). Statistically significant differences between the exposed samples and the matched negative control (4 h) were determined through one-way ANOVA with a Dunnett’s post hoc. * p < 0.05, ** p < 0.01, *** p < 0.001. Uncoated CuO NPs (544868), CuO MPs, and CuCl2 data were previously reported [34].
Figure 3
Figure 3
Percentage of DNA in the tail in FE1 cells after exposure to MnO2 variants at 2 and 4 h. Data are presented as mean and standard error (n = 3–4). Statistically significant differences between the exposed samples and the matched negative control (4 h) were determined through one-way ANOVA with a Dunnett’s post hoc. * p < 0.05, ** p < 0.01, *** p < 0.001.
Figure 4
Figure 4
Percentage of DNA in the tail in FE1 cells after exposure to NiO variants and NiCl2 at 2 and 4 h. Data are presented as mean and standard error (n = 3–4). Statistically significant differences between the exposed samples and the matched negative control (4 h) were determined through one-way ANOVA with a Dunnett’s post hoc. * p < 0.05, ** p < 0.01, *** p < 0.001. Data in parenthesis indicates the concentration of stearic acid-coated NiO NPs.
Figure 5
Figure 5
Percentage of DNA in the tail in FE1 cells after exposure to Al2O3 variants and AlCl3 at 2 and 4 h. Data are presented as mean and standard error (n = 3–4). Statistically significant differences between the exposed samples and the matched negative control (4 h) were determined through one-way ANOVA with a Dunnett’s post hoc. *** p < 0.001.
Figure 6
Figure 6
Percentage of DNA in the tail in FE1 cells after exposure to CeO2 variants and CeCl3 at 2 and 4 h. Data are presented as mean and standard error (n = 3–4). Statistically significant differences between the exposure and the matched negative control (4 h) were determined through one-way ANOVA with Dunnett’s post hoc. * p < 0.05, ** p < 0.01, *** p < 0.001. Data in parenthesis indicates the concentration of stearic acid-coated CeO2 NPs.
Figure 7
Figure 7
Percentage of DNA in the tail in FE1 cells after exposure to Fe2O3 variants at 2 and 4 h. Data are presented as mean and standard error (n = 3–4). Statistically significant differences between the exposed samples and the matched negative control (4 h) were determined through one-way ANOVA with a Dunnett’s post hoc. ** p < 0.01, *** p < 0.001.
Figure 8
Figure 8
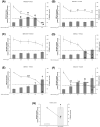
Cytotoxicity assessment (% relative survival) and MN-fold increase in FE1 cells after 40 h of exposure to MO variants. (A) ZnO variants, (B) CuO variants, (C) MnO2 variants, (D) NiO variants, (E) Al2O3 variants, (F) CeO2 variants, (G) TiO2 variants, (H) Fe2O3 variants. Data are presented as mean and standard error (n = 3–4). Data in parenthesis indicates the concentration of stearic acid-coated NiO NPs or stearic acid-coated CeO2 NPs. Statistically significant differences between the exposed samples and the matched negative controls were determined (see Section 2.9). % relative survival: # p < 0.05, ## p < 0.01, ### p < 0.001. MN-fold increase: * p < 0.05, ** p < 0.01, *** p < 0.001. The letter “a” indicates that the exposure was overtly cytotoxic, with relative survival dipping below 40%. The dashed line represents 40% of the relative survival threshold.
Figure 9
Figure 9
Cytotoxicity assessment (% relative survival) and MN-fold increase in FE1 cells after 40 h of exposure to dissolved metal analogs. (A) ZnCl2, (B) CuCl2, (C) MnSO4, (D) NiCl2, (E) AlCl3, (F) CeCl3, (G) Positive control: 500 µM MMS for 40 h. Data are presented as mean and standard error (n = 3–4). Statistically significant differences between the exposed samples and the matched negative controls were determined (see Section 2.9). % relative survival: # p < 0.05, ## p < 0.01, ### p < 0.001. MN-fold increase: * p < 0.05, ** p < 0.01. The letter “a” indicates that the exposure was overtly cytotoxic, with less than 40% relative survival. The dashed line represents 40% of the relative survival threshold.
Figure 10
Figure 10
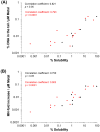
The relationship between solubility at 10 and 100 µg/mL, and (A) % DNA in the tail at 4 h and (B) MN-fold increase at 40 h when concentration is normalized to µM of constituent metal. The highest admissible concentration for each endpoint was used. Black circles: Solubility at 10 µg/mL (n = 7). Red circles: Solubility at 100 µg/mL (n = 14).
Figure 11
Figure 11
BMC analysis of (A) 4 h % DNA in tail, and (B) 40 h % MN induction endpoints for MONPs, MOMPs, and dissolved metal exposures. Concentration is expressed in terms of the mass volume of constituent metal. Black dashed lines denote the separation between MO types. BMCL: Lower 95% confidence interval of the BMC. BMCU: Upper 95% confidence interval of the BMC.
Figure 12
Figure 12
BMC analysis of (A) 4 h % DNA in tail, and (B) 40 h % MN induction endpoints for MONPs and MOMPs exposures. Concentration is expressed in terms of the SSA of the particles per surface area of the well plate. Black dashed lines denote the separation between MO types. BMCL: Lower 95% confidence interval of the BMC. BMCU: Upper 95% confidence interval of the BMC.
Figure 13
Figure 13
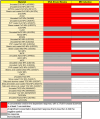
Summary of the results of 4 h comet and 40 h MN assays for all MO and dissolved metal analogs.

References

    1. Health Canada Nanomaterials. [(accessed on 13 September 2023)]. Available online: https://www.canada.ca/en/health-canada/services/chemical-substances/nano....
    1. Health Canada Policy Statement on Health Canada’s Working Definition for Nanomaterial. [(accessed on 31 March 2024)]. Available online: https://www.canada.ca/en/health-canada/services/science-research/reports....
    1. Chavali M.S., Nikolova M.P. Metal oxide nanoparticles and their applications in nanotechnology. SN Appl. Sci. 2019;1:607. doi: 10.1007/s42452-019-0592-3. - DOI
    1. Piccinno F., Gottschalk F., Seeger S., Nowack B. Industrial production quantities and uses of ten engineered nanomaterials in Europe and the world. J. Nanopart. Res. 2012;14:1109. doi: 10.1007/s11051-012-1109-9. - DOI
    1. European Commission, Directorate-General for Environment . In: Support for 3rd Regulatory Review on Nanomaterials-Environmental Legislation. Broomfield M., Foss Hansen S., Pelsy F., editors. Publications Office of the European Union; Luxembourg: 2016. - DOI

LinkOut - more resources