

Global burden of liver cirrhosis 1990-2019 and 20 years forecast: results from the global burden of disease study 2019
- PMID: 38727511
- PMCID: PMC11089929
- DOI: 10.1080/07853890.2024.2328521
Global burden of liver cirrhosis 1990-2019 and 20 years forecast: results from the global burden of disease study 2019
Abstract
Background: Cirrhosis is a disease that imposes a heavy burden worldwide, but its incidence varies widely by region. Therefore, we analysed data on the incidence and mortality of cirrhosis in 204 countries and territories from 1990-2019 and projected the disease development from 2019-2039.
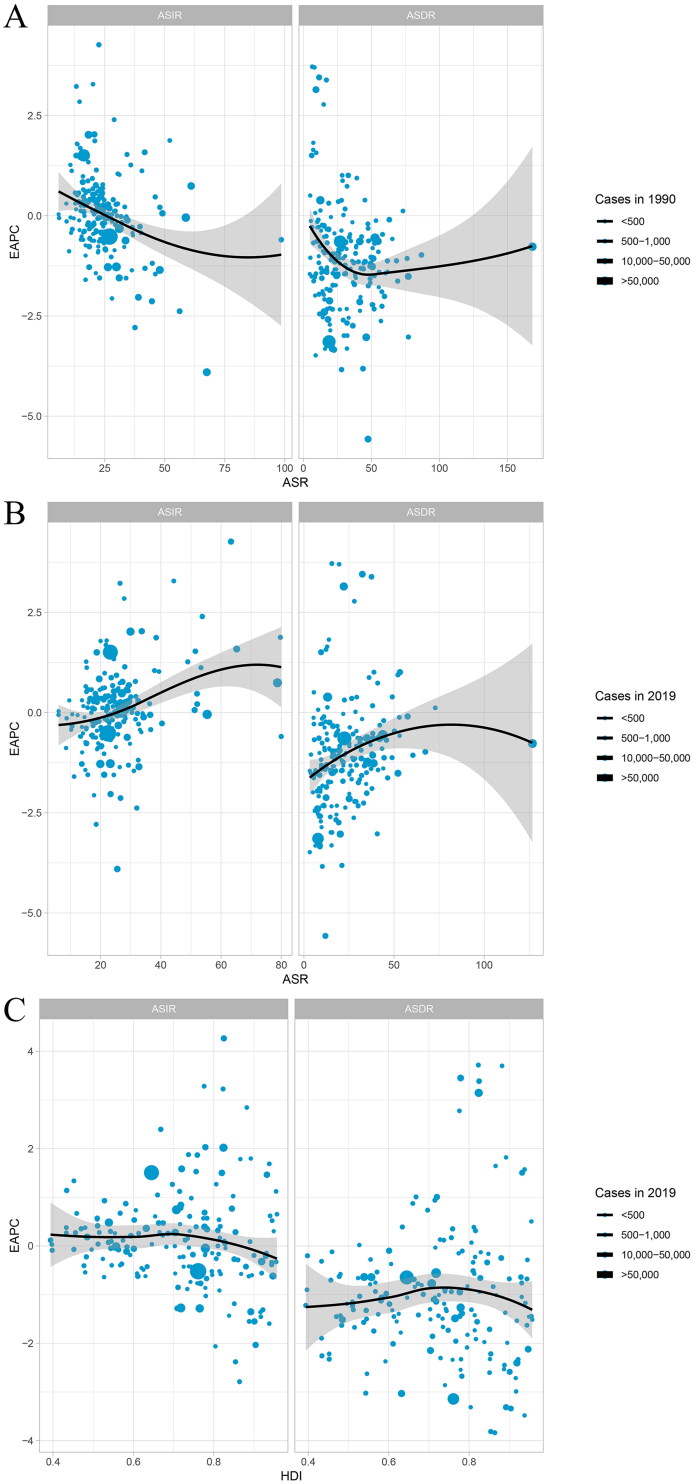
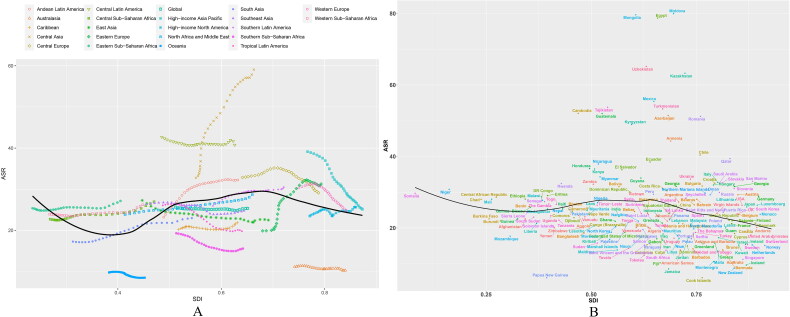
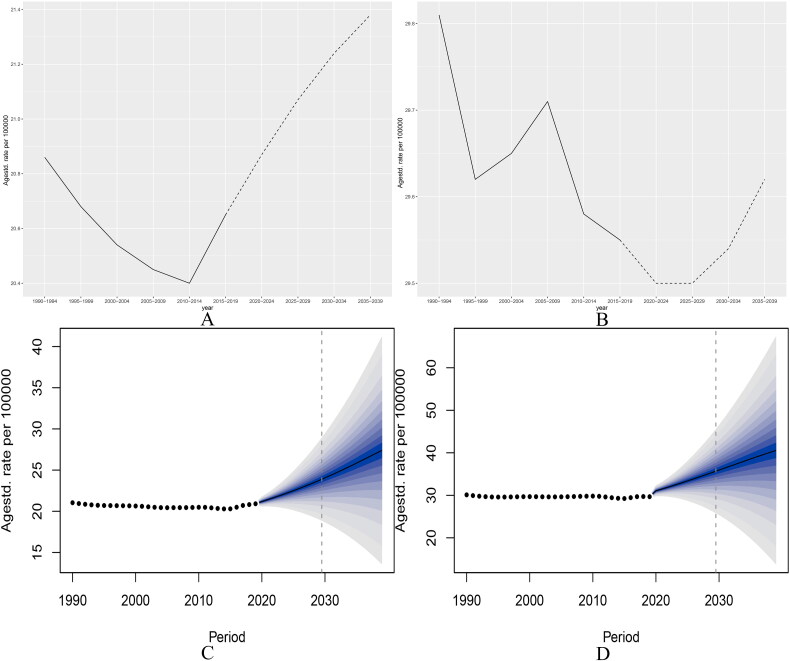
Methods: Data on the incidence and mortality of liver cirrhosis from 1990 to 2019 were acquired from the public Global Burden of Disease (GBD) study. In addition, the average annual percentage change (AAPC) and estimated annual percentage change (EAPC) of the age-standardized rate (ASR) of cirrhosis in different regions were calculated. The estimates of risk factor exposure were summarized, and the proportion of causes and risk factors of liver cirrhosis and their relationship with the human development index (HDI) and socio-demographic index (SDI) were analysed. Trends in the incidence of cirrhosis in 2019-2039 were predicted using Nordpred and BAPC models.
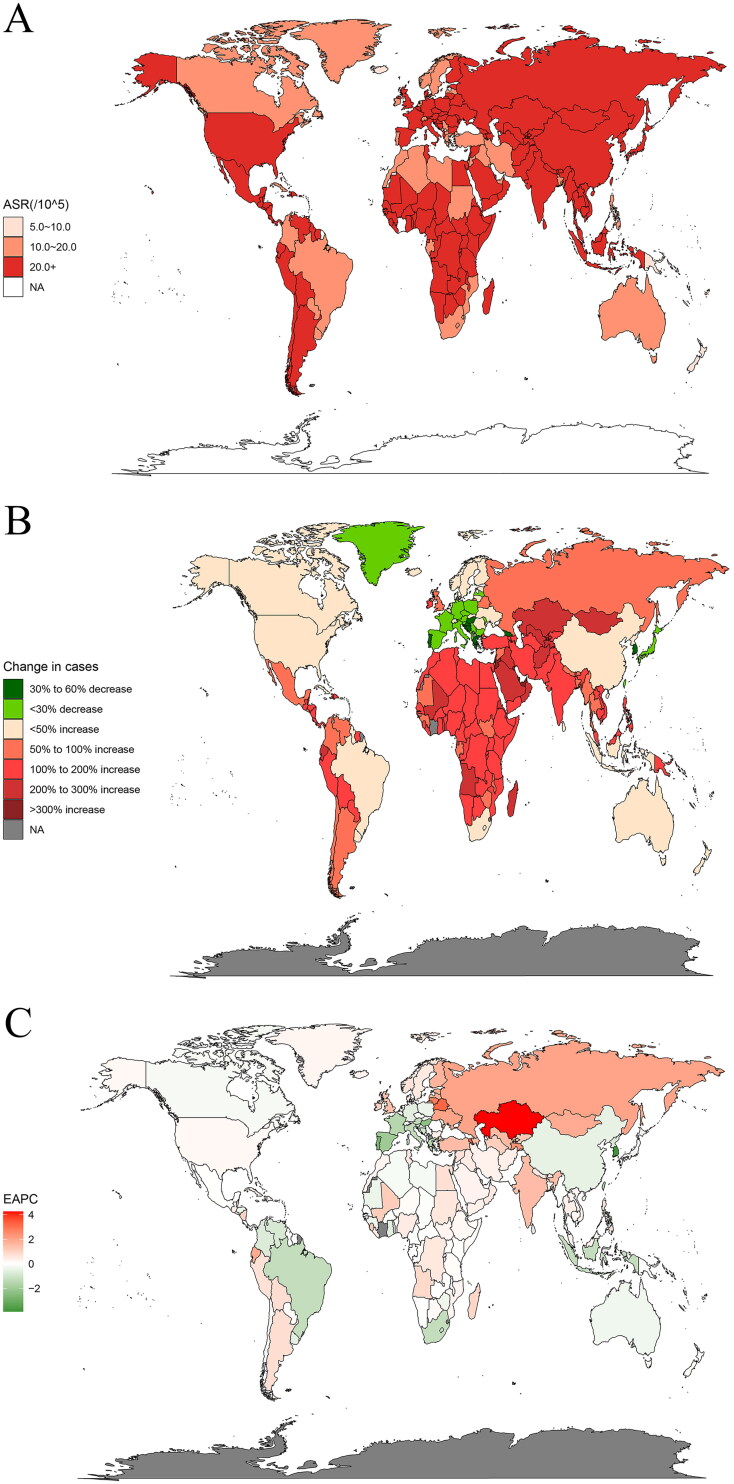
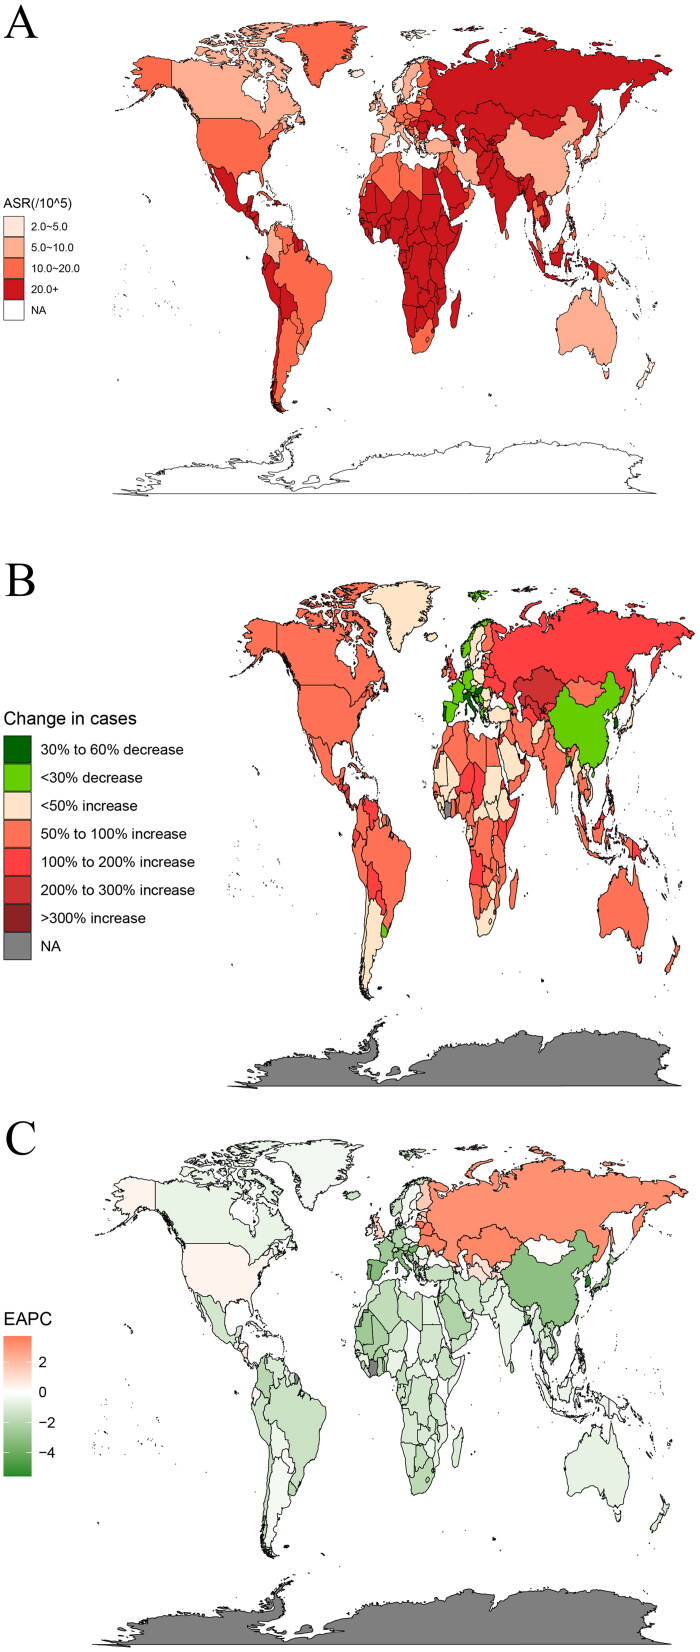
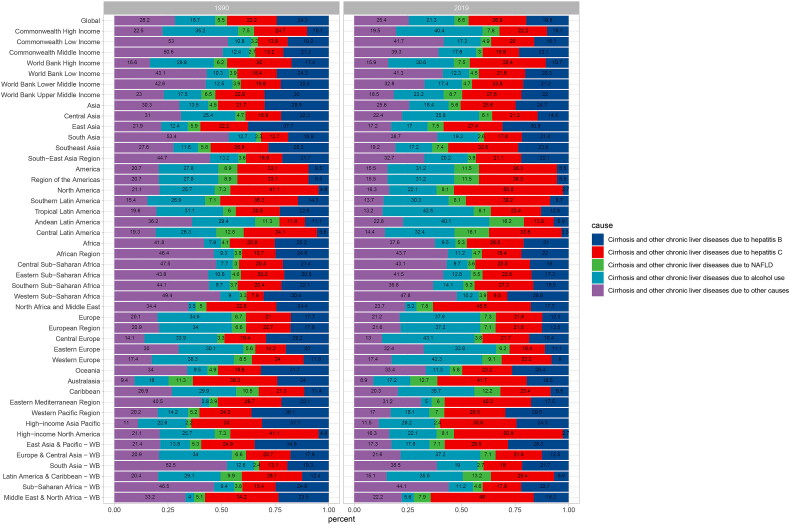
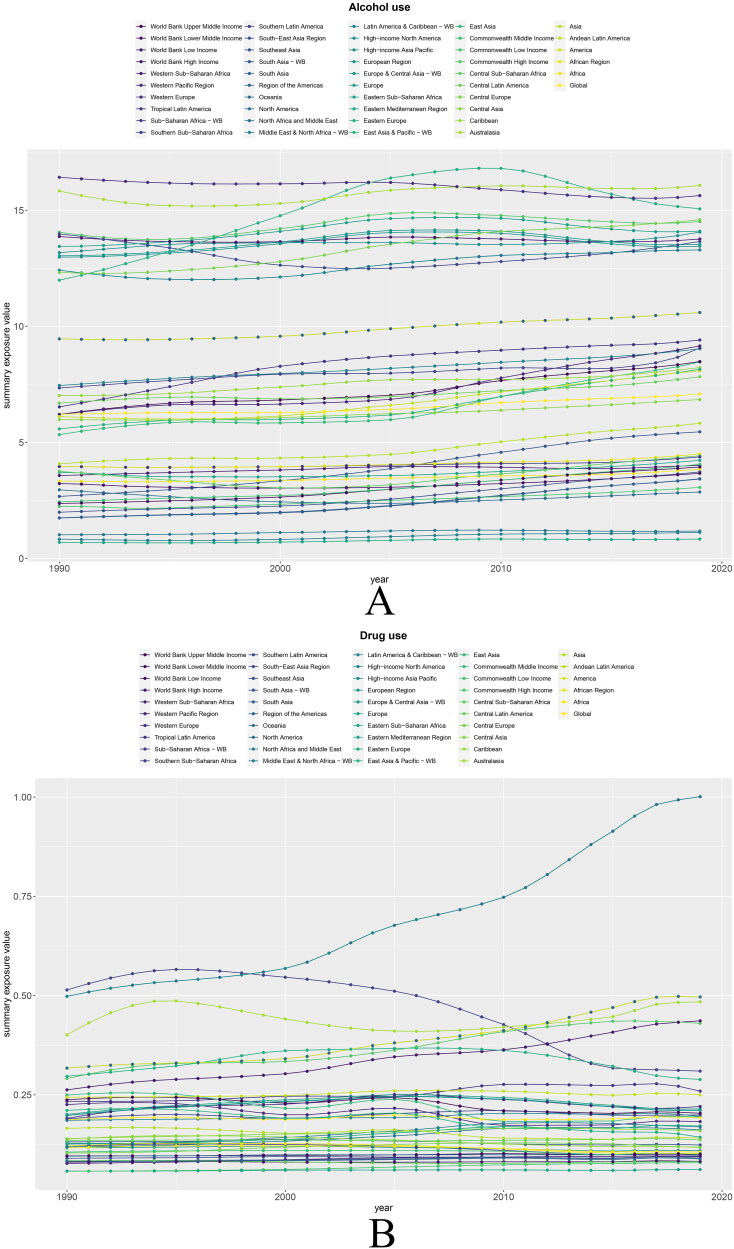
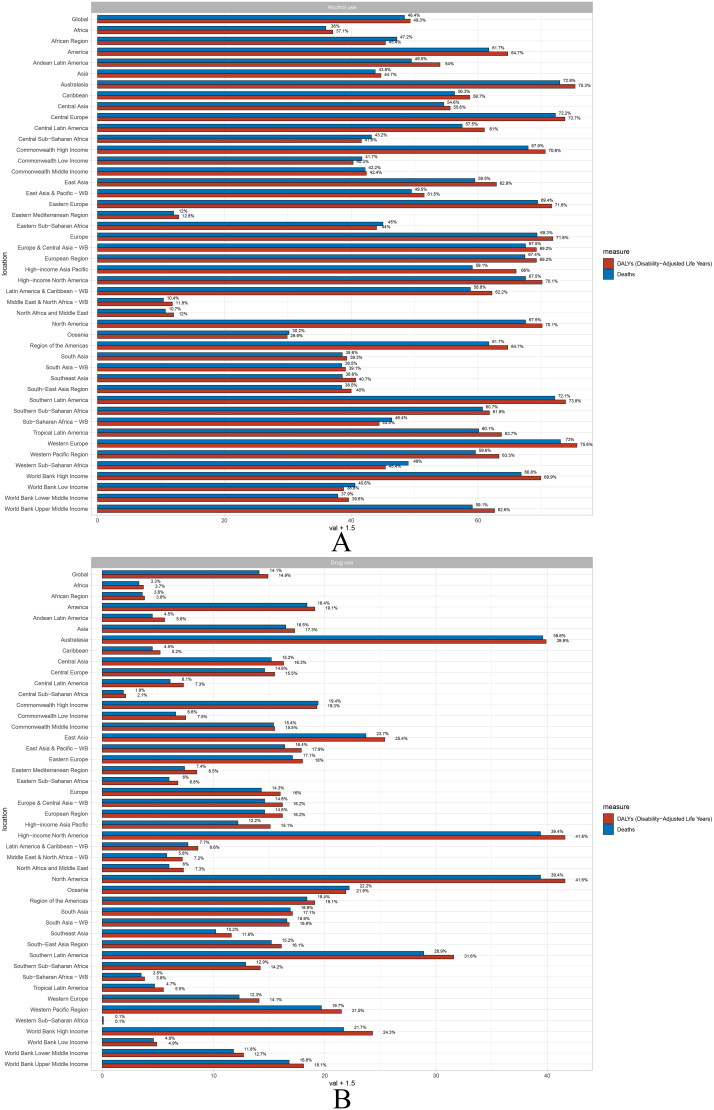
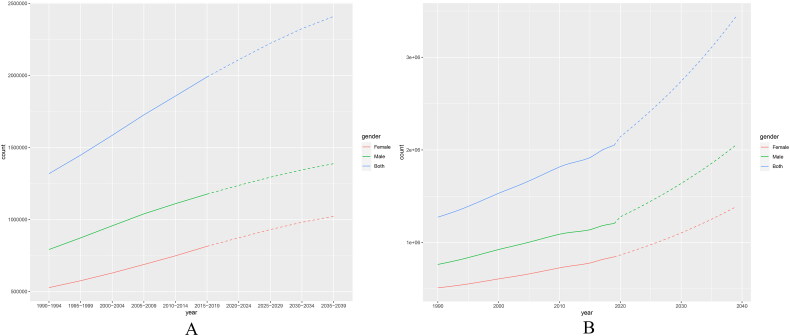
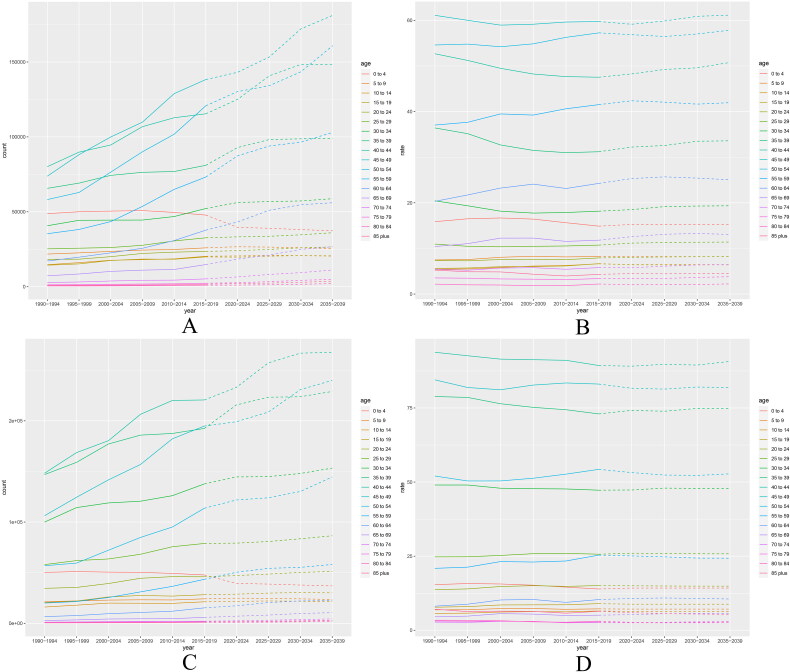
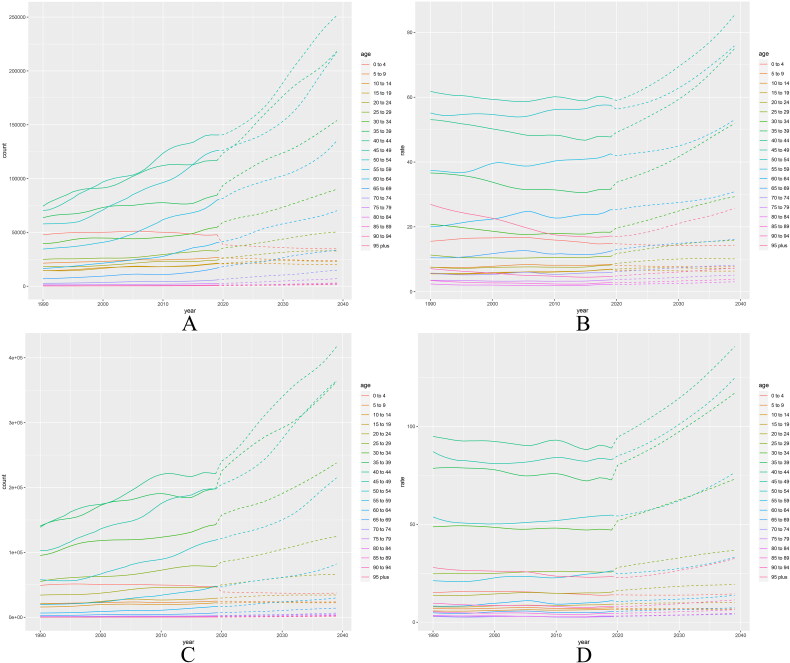
Results: Globally, the ASR of cirrhosis incidence decreased by 0.05% per year from 25.7/100,000 in 1990 to 25.3/100,000 in 2019. The mortality risk associated with cirrhosis is notably lower in females than in males (13 per 100,000 vs 25 per 100,000). The leading cause of cirrhosis shifted from hepatitis B to C. Globally, alcohol use increased by 14%. In line, alcohol use contributed to 49.3% of disability-adjusted life years (DALYs) and 48.4% of global deaths from liver cirrhosis. Countries with a low ASR in 1990 experienced a faster increase in cirrhosis, whereas in 2019, the opposite was observed. In countries with high SDI, the ASR of cirrhosis is generally lower. Finally, projections indicate that the number and incidence of cirrhosis will persistently rise from 2019-2039.
Conclusions: Cirrhosis poses an increasing health burden. Given the changing etiology, there is an imperative to strengthen the prevention of hepatitis C and alcohol consumption, to achieve early reduce the incidence of cirrhosis.
Keywords: Cirrhosis; disease burden; liver disease; prediction; trend.
Plain language summary
This study is an updated assessment of liver cirrhosis prevalence trends in 204 countries worldwide and the first to project trends over the next 20 years.The disease burden of cirrhosis is still increasing, and despite the decline in ASR, the number and prevalence of cirrhosis will continue to increase over the next two decades after 2019.It is alarming that the global surge in alcohol use is accompanied by an increase in DALYs and deaths due to liver cirrhosis.Liver cirrhosis remains a noteworthy public health event, and our study can further guide the development of national healthcare policies and the implementation of related interventions.
Conflict of interest statement
No potential conflict of interest was reported by the author(s).
Figures
Similar articles
-
The global, regional, and national burden of cirrhosis by cause in 195 countries and territories, 1990-2017: a systematic analysis for the Global Burden of Disease Study 2017.Lancet Gastroenterol Hepatol. 2020 Mar;5(3):245-266. doi: 10.1016/S2468-1253(19)30349-8. Epub 2020 Jan 22. Lancet Gastroenterol Hepatol. 2020. PMID: 31981519 Free PMC article.
-
Global, regional, and national pancreatitis burden and health inequality of pancreatitis from 1990 to 2019 with a prediction from 2020 to 2034.BMC Public Health. 2024 Nov 29;24(1):3329. doi: 10.1186/s12889-024-20796-z. BMC Public Health. 2024. PMID: 39614245 Free PMC article.
-
Projected epidemiological trends and burden of liver cancer by 2040 based on GBD, CI5plus, and WHO data.Sci Rep. 2024 Nov 15;14(1):28131. doi: 10.1038/s41598-024-77658-2. Sci Rep. 2024. PMID: 39548154 Free PMC article.
-
Global burden of myocarditis in youth and middle age (1990-2019): A systematic analysis of the disease burden and thirty-year forecast.Curr Probl Cardiol. 2024 Sep;49(9):102735. doi: 10.1016/j.cpcardiol.2024.102735. Epub 2024 Jun 29. Curr Probl Cardiol. 2024. PMID: 38950720 Review.
-
The epidemiology of pregnancy loss: global burden, variable risk factors, and predictions.Hum Reprod. 2024 Apr 3;39(4):834-848. doi: 10.1093/humrep/deae008. Hum Reprod. 2024. PMID: 38308812 Review.
Cited by
-
Mood instability and risk of gastrointestinal diseases - a univariable and multivariable mendelian randomization study.Ann Gen Psychiatry. 2024 Dec 19;23(1):50. doi: 10.1186/s12991-024-00537-7. Ann Gen Psychiatry. 2024. PMID: 39702383 Free PMC article.
-
Global burden of colorectal cancer attributable to metabolic risks from 1990 to 2021, with projections of mortality to 2035.Int J Colorectal Dis. 2025 Feb 19;40(1):46. doi: 10.1007/s00384-025-04817-w. Int J Colorectal Dis. 2025. PMID: 39969585 Free PMC article.
-
The global burden of chronic kidney disease due to glomerulonephritis: trends and predictions.Int Urol Nephrol. 2025 Aug;57(8):2613-2624. doi: 10.1007/s11255-025-04440-2. Epub 2025 Mar 5. Int Urol Nephrol. 2025. PMID: 40045051 Free PMC article.
-
Molecular Mechanisms of Fibrosis in Cholestatic Liver Diseases and Regenerative Medicine-Based Therapies.Cells. 2024 Dec 3;13(23):1997. doi: 10.3390/cells13231997. Cells. 2024. PMID: 39682745 Free PMC article. Review.
-
Global, regional, and national trends in pulmonary arterial hypertension burden, 1990-2021: findings from the global burden of disease study 2021.Front Public Health. 2025 May 29;13:1516365. doi: 10.3389/fpubh.2025.1516365. eCollection 2025. Front Public Health. 2025. PMID: 40510578 Free PMC article.
References
-
- Digestive diseases in the United States: epidemiology and Impact . NIDDK; Bethesda, MD: 1994. NIH Publication No. 94–1447.
Publication types
MeSH terms
LinkOut - more resources
Full Text Sources
Other Literature Sources
Medical