. 2024 Aug 5;223(8):e202403020.
doi: 10.1083/jcb.202403020. Epub 2024 May 10.

Binucleated human hepatocytes arise through late cytokinetic regression during endomitosis M phase

Affiliations

Binucleated human hepatocytes arise through late cytokinetic regression during endomitosis M phase

Gabriella S Darmasaputra et al. J Cell Biol. .

Abstract

Binucleated polyploid cells are common in many animal tissues, where they arise by endomitosis, a non-canonical cell cycle in which cells enter M phase but do not undergo cytokinesis. Different steps of cytokinesis have been shown to be inhibited during endomitosis M phase in rodents, but it is currently unknown how human cells undergo endomitosis. In this study, we use fetal-derived human hepatocyte organoids (Hep-Orgs) to investigate how human hepatocytes initiate and execute endomitosis. We find that cells in endomitosis M phase have normal mitotic timings, but lose membrane anchorage to the midbody during cytokinesis, which is associated with the loss of four cortical anchoring proteins, RacGAP1, Anillin, SEPT9, and citron kinase (CIT-K). Moreover, reduction of WNT activity increases the percentage of binucleated cells in Hep-Orgs, an effect that is dependent on the atypical E2F proteins, E2F7 and E2F8. Together, we have elucidated how hepatocytes undergo endomitosis in human Hep-Orgs, providing new insights into the mechanisms of endomitosis in mammals.


Conflict of interest statement

Disclosures: H. Clevers reported personal fees from F. Hoffmann-La Roche Ltd., Basel, Switzerland, outside the submitted work; in addition, H. Clevers had a patent to Application PCT/EP2019/082618 events 2019-11-26 Application filed by Koninklijke Nederlandse Akademie Van Wetenschappen 2019-11-26 Priority to US17/296,049 2020-06-04 Publication of WO2020109324A1 licensed “HUB, Utrecht, NL”; and “I am currently an employee of F. Hoffmann-La Roche Ltd. in Basel, Switzerland, where I am member of the Extended Executive Board and head Pharma Research & Early Development. The company has no involvement in the work published in this manuscript.” No other disclosures were reported.

Figures

Figure 1.
Figure 1.
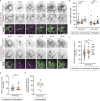
Human hepatocytes undergo canonical, endomitosis, and polyploid M phases in Hep-Orgs. (A) Representative images of Chol-Org and Hep-Org lines expressing GFP-NLS (green) and stained with CellMask Orange (magenta) to mark nuclei and membranes, respectively. Images show one plane in the center of each organoid. Examples of binucleated cells are indicated in the white squares. (B) Percentage of binucleated cells in Chol-Org and Hep-Org lines. Columns depict mean percentages (N = 3 experiments, 200–300 cells analyzed per experiment). (C) Percentage of binucleated cells per organoid plotted against organoid size (N = 3 experiments, 20–30 organoids analyzed per Hep-Org line). Each dot represents one organoid, with the mean depicted in column (ns = not significant, Student’s t test, two-tailed). (D) Stills from live imaging of GFP-NLS/E-cadherin-tdTomato Hep-Org 1 line showing canonical (top) and endomitosis (bottom) M phase. Time is relative to NEB in h:min. White asterisks mark daughter cells. (E) Percentage of types of M phases observed during live-imaging experiments of GFP-NLS/E-cad-tdTomato Hep-Org 1 line and Tubulin-mNeon Hep-Org 2 line (N = 5 experiments, >175 events analyzed per line). Error bars represent standard deviation. (F) Stills from live imaging of GFP-NLS/E-cadherin-tdTomato Hep-Org 1 line showing polyploid M phase. Time is relative to NEB in h:min. White asterisks mark daughter cells. (G) Percentage of polyploid M phases segregating their DNA content to two, three, or four daughter nuclei (N = 5 experiments, >7 events per line). Scale bars in A, D, and F represent 50 µm.
Figure 2.
Figure 2.
Cells undergoing endomitosis have normal mitotic timings but regress their cytokinetic furrow during late M phase. (A) Representative stills from live imaging of Tubulin-mNeon/E-cadherin-tdTomato Hep-Org 2 line showing canonical (top) and endomitosis (bottom) M phases. Stills show formation of central spindle in both canonical mitosis and endomitosis, with subsequent membrane regression in endomitosis (marked with arrow) and midbody severing (marked with asterisk). Time is relative to NEB in h:min. Scale bars represent 50 µm. Panels 3–6 showing β-tubulin are maximum projections of two z-slices. (B) Duration of NEB to NER in minutes for canonical, endomitosis, and polyploid M phases in Hep-Org 1 line expressing GFP-NLS/E-cadherin-tdTomato (N = 9 experiments) and Hep-Org 2 line expressing Tubulin-mNeon (N = 6 experiments). Individual measurements are shown for canonical (Hep-Org 1, n = 204 events; Hep-Org 2, n = 62 events), endomitosis (Hep-Org 1, n = 16 events; Hep-Org 2, n = 18 events), and polyploid (Hep-Org 1, n = 7 events; Hep-Org 2, n = 11 events) M phases. Black bars indicate mean (ns = not significant, **P < 0.01, Student’s t test, two-tailed). (C) Duration from midbody assembly to severing in minutes for canonical (n = 62 events), endomitosis (n = 18 events), and polyploid (n = 11 events) M phases in Hep-Org 2 line expressing Tubulin-mNeon (N = 5 experiments). Individual measurements are shown with mean (black bar) (**P < 0.01, Student’s t test, two-tailed). (D) Duration from NEB to furrowing onset for canonical (n = 32 events) and endomitosis (n = 13 events) M phases in Hep-Org 1 line expressing GFP-NLS/E-cadherin-tdTomato (N = 5 experiments). Individual measurements are shown with mean (black bar) (ns = not significant, Student’s t test, two-tailed). (E) Duration from furrowing onset to cytokinetic regression in endomitosis M phase in Hep-Org 1 line expressing GFP-NLS/E-cadherin-tdTomato (n = 11 events). Individual measurements are shown with mean (black bar).
Figure S1.
Figure S1.
Absence of RIF1-positive ultrafine DNA bridges in late anaphase and telophase. Representative images of RIF1 staining in Hep-Org 1 expressing E-cadherin-tdTomato. RIF1 can be detected on ultrafine DNA bridges during early anaphase (left image, white arrow) but is absent in all late anaphase and telophase structures (right). Hep-Org 1 line expressing E-cadherin-tdTomato was grown in 3D, fixed, and stained for DAPI (gray) and RIF1 (magenta). Scale bars represent 3 µm. Numbers in the top right corner indicate the number of cells with RIF1-positive ultrafine DNA bridges during early anaphase (left) and the number of cells with no RIF1 staining in late anaphase or telophase (right).
Figure 3.
Figure 3.
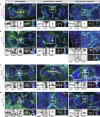
Membrane association of membrane anchoring proteins is lost during cleavage regression in endomitosis. (A–D) Representative stills of IF experiments showing DAPI, α-tubulin, E-cadherin, and membrane-anchoring protein (A) RacGAP1, (B) Anillin, (C) SEPT9, or (D) CIT-K in late anaphase and late telophase, with either ingressed or regressed cleavage furrows. Hep-Org 1 line expressing E-cadherin-tdTomato was used for IF stainings. Scale bars represent 3 µm. Close-ups show single- or double-channel images of marked regions of interest (white box). Dashed lines represent membrane outline. All images show one plane in the middle of the midbody. Numbers in the top right show quantification of displayed localization. More detailed quantifications of RacGAP1, Anillin, SEPT9, and CIT-K localizations during the different stages are shown in Fig. 4.
Figure 4.
Figure 4.
Localization of membrane anchoring proteins in Hep-Orgs cells undergoing M phase. (A–D) Schematic overview of the different localizations of (A) RacGAP1, (B) Anillin, (C) SEPT9, and (D) CIT-K (magenta) in late anaphase and late telophase with either ingressed or regressed cleavage furrows. Cell membranes are depicted in cyan, DNA in blue, and microtubules in green. The percentages and numbers show how often the depicted localization of the membrane anchoring protein was observed.
Figure S2.
Figure S2.
Atypical CIT-K localization on microtubules during late anaphase and telophase. (A and B) Representative images of IF experiments showing atypical CIT-K localization (magenta) with microtubules (green) in (A) early and (B) late telophase. Scale bars represent 3 µm. Close-ups show single- or double-channel images of marked regions of interest (white box). Orange arrows point to CIT-K signal in midbody arms. Dashed lines represent the membrane outline. All images show one plane in the middle of the midbody. CIT-K localization to the midbody arms was observed in 37% of ingressed late telophase structures and 100% of regressed structures.
Figure 5.
Figure 5.
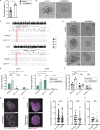
WNT signaling inhibits binucleation of human hepatocytes in an E2F7/8-dependent manner. (A) Percentage of binucleated cells in Hep-Org 1 line with GFP-NLS and stained with CellMask Orange in control medium and after 3 days of CHIR99021 removal (N = 3 experiments, 200–300 cells analyzed per experiment, *P < 0.05, Student’s t test, two-tailed). (B) Representative brightfield images of Hep-Org 1 in control medium and after 3 days of CHIR99021 removal. Scale bars represent 50 µm. (C) Base-editing strategy for introduction of a premature stop codon in E2F7 and E2F8 open reading frames with Sanger sequencing chromatographs of wildtype and mutant alleles, confirming homozygous base changes (highlighted in red) in E2F7Q206X and E2F8Q462X Hep-Org 1 lines. Protospacer adjacent motif (PAM) sequences are highlighted in blue. (D) Representative brightfield images of wildtype, E2F7Q206X, and E2F8Q462X Hep-Org 1 lines in control medium and after 3 days of CHIR99021 removal. Scale bars represent 50 µm. (E) Relative expression of E2F7 or E2F8 in wildtype and mutant lines as measured by RT-qPCR in control medium and after 3 days of CHIR99021 removal (N = 3 experiments, ns = not significant, *P < 0.05, **P < 0.01, Student’s t test, two-tailed). Error bars represent standard deviation. (F) Percentage of binucleated cells in wildtype and mutant lines expressing GFP-NLS and stained with CellMask Orange in control medium and after 3 days of CHIR99021 removal. Each dot represents the average percentage of binucleated cells per experiment (N = 3 experiments, 200–300 cells analyzed per experiment, ns = not significant, *P < 0.05, **P < 0.01, Student’s t test, two-tailed). (G) Representative images of Hep-Org 1 line expressing GFP-NLS (green) and E-cadherin-tdTomato (magenta) grown in control medium and after 3 days of CHIR99021 removal. Scale bars represent 50 µm. (H) Representative images of Hep-Org 1 line expressing E-cadherin-tdTomato (magenta) and stained with DRAQ5 (gray) to visualize DNA, after growth for 7 days in either control medium or differentiation medium (DM). Scale bars represent 50 µm. (I) Percentage of binucleated cells per organoid in Hep-Org 1 line expressing E-cadherin-tdTomato and stained with DRAQ5 after growth for 7 days in either control medium (n = 84 organoids) or differentiation medium (DM, n = 83 organoids). Each dot represents the percentage of binucleated cells per organoid, and the black line represents the median (N = 2 experiments, 73–93 organoids analyzed per experiment, ns = not significant, Mann–Whitney test). (J) Percentage of binucleated cells per organoid in Hep-Org 1 line expressing GFP-NLS/E-cadherin-tdTomato grown for 1 day in control medium (n = 21 organoids) or in medium supplemented with insulin (n = 37 organoids). The black line represents the median. See material and methods section for more information on media composition (N = 2 experiments, ns = not significant, Mann–Whitney test). (K) Percentage of binucleated cells per organoid in Hep-Org 1 line expressing GFP-NLS/E-cadherin-tdTomato grown for 7 days in control medium (n = 15 organoids) or in medium without insulin (n = 19 organoids). The black line represents the median. See Materials and methods section for more information on media composition (N = 2 experiments, ns = not significant, Mann–Whitney test).
Figure S3.
Figure S3.
Similar ploidy distributions in wildtype, E2F7Q206X, and E2F8Q462X Hep-Org lines. Quantification of DAPI signal in wildtype, E2F7Q206X, and E2F8Q462X Hep-Org lines grown in culture medium or after 3 days of CHIR99021 removal. Organoids were grown in 3D, trypsinized, cytospun onto slides, fixed, and stained with DAPI. DAPI signal was normalized to the median (black line) of each sample (between 350 and 500 cells analyzed per sample, N = 2 experiments, ns = not significant, Mann–Whitney test).

References

    1. Artegiani, B., Hendriks D., Beumer J., Kok R., Zheng X., Joore I., Chuva de Sousa Lopes S., van Zon J., Tans S., and Clevers H.. 2020. Fast and efficient generation of knock-in human organoids using homology-independent CRISPR-Cas9 precision genome editing. Nat. Cell Biol. 22:321–331. 10.1038/s41556-020-0472-5 - DOI - PubMed
    1. Bahar Halpern, K., Tanami S., Landen S., Chapal M., Szlak L., Hutzler A., Nizhberg A., and Itzkovitz S.. 2015. Bursty gene expression in the intact mammalian liver. Mol. Cell. 58:147–156. 10.1016/j.molcel.2015.01.027 - DOI - PMC - PubMed
    1. Benhamouche, S., Decaens T., Godard C., Chambrey R., Rickman D.S., Moinard C., Vasseur-Cognet M., Kuo C.J., Kahn A., Perret C., and Colnot S.. 2006. Apc tumor suppressor gene is the “zonation-keeper” of mouse liver. Dev. Cell. 10:759–770. 10.1016/j.devcel.2006.03.015 - DOI - PubMed
    1. Bergmann, O., Bhardwaj R.D., Bernard S., Zdunek S., Barnabé-Heider F., Walsh S., Zupicich J., Alkass K., Buchholz B.A., Druid H., et al. . 2009. Evidence for cardiomyocyte renewal in humans. Science. 324:98–102. 10.1126/science.1164680 - DOI - PMC - PubMed
    1. Bodor, D. 2021. Mitotic scoring tool: version 0.1.0. github.com/DaniBodor/MitoticScoring.

Publication types

Grants and funding