. 2024 May 14;121(20):e2322321121.
doi: 10.1073/pnas.2322321121. Epub 2024 May 10.

Mechanics limits ecological diversity and promotes heterogeneity in confined bacterial communities

Affiliations

Mechanics limits ecological diversity and promotes heterogeneity in confined bacterial communities

Tianyi Ma et al. Proc Natl Acad Sci U S A. .

Abstract

Multispecies bacterial populations often inhabit confined and densely packed environments where spatial competition determines the ecological diversity of the community. However, the role of mechanical interactions in shaping the ecology is still poorly understood. Here, we study a model system consisting of two populations of nonmotile Escherichia coli bacteria competing within open, monolayer microchannels. The competitive dynamics is observed to be biphasic: After seeding, either one strain rapidly fixates or both strains orient into spatially stratified, stable communities. We find that mechanical interactions with other cells and local spatial constraints influence the resulting community ecology in unexpected ways, severely limiting the overall diversity of the communities while simultaneously allowing for the establishment of stable, heterogeneous populations of bacteria displaying disparate growth rates. Surprisingly, the populations have a high probability of coexisting even when one strain has a significant growth advantage. A more coccus morphology is shown to provide a selective advantage, but agent-based simulations indicate this is due to hydrodynamic and adhesion effects within the microchannel and not from breaking of the nematic ordering. Our observations are qualitatively reproduced by a simple Pólya urn model, which suggests the generality of our findings for confined population dynamics and highlights the importance of early colonization conditions on the resulting diversity and ecology of bacterial communities. These results provide fundamental insights into the determinants of community diversity in dense confined ecosystems where spatial exclusion is central to competition as in organized biofilms or intestinal crypts.

Keywords: microbial ecology; microbial systems; physical biology; population dynamics; quantitative biology.


Conflict of interest statement

Competing interests statement:The authors declare no competing interest.

Figures
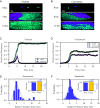
Fig. 1.
Fig. 1.
Spatial competition between two E. coli strains displays biphasic dynamics resulting in either coexistence or fixation. (A and B) Dynamics of competition from low initial seeding within an open monolayer device are captured by time-lapse fluorescence microscopy. Images are shown at t=0, 5 or 6, and 12 h. (C and D) Total area occupied by each strain normalized to the microchannel area as a function of time. Panels A and C provide an example illustrating the observed fixation dynamics while panels B and D illustrate coexistence dynamics. The gray dashed line in C indicates the point at which the mCherry carrying (red) strain’s occupancy reaches zero, defining the fixation time (7.5 h). (E) Histogram of observed fixation times relative to the average microchannel fill time (t=0) fitted with a Gamma distribution (dashed line), for both populations, from competition experiments between roughly neutral E. coli strains. The distribution is sharply peaked about the microchannel fill time. The inserted bar plot shows an almost equal number of observations of fixation or coexistence (31 fixations out of 64 total experiments). (F) Same as in E, but from agent-based simulations (2,436 fixations out of 5,000 simulations).
Fig. 2.
Fig. 2.
Competition between eGFP and mCherry strains is effectively neutral at low induction while favoring eGFP-expressing cells at high induction. (A) Relative difference in doubling times measured in LC and in microchannels (MC) at low (L) and high (H) induction. Dotted (dashed) lines indicate a 0% (10%) relative growth advantage for eGFP-expressing cells (P-values denoted by ns > 0.05, ** < 0.01, two-sample t test). Error bars are the SD of n = 12, 12, 10, 10 (left to right, respectively) replicates. (B) Comparison of the fractional area occupied by each strain in sliding assays evaluated at low and high induction. The dashed line at 0.5 indicates balanced competition. Error bars are ± the SD from three replicates. Scale bars in representative images are 5 mm. (C and D) A comparison of experiments and simulations showing the fraction of microchannels displaying coexistence and fixation at low and high induction. Inset pie charts indicate the fraction of fixations for each strain, observed and predicted, at each induction level. Error bars result from bootstrapping the data. Bootstrapping on the simulated data was subsampled similar to experiments to estimate the expected measurement error (SI Appendix, section 1 and Fig. S6). (E) Simulated predictions for the fraction of microchannels displaying coexistence and fixation as a function of the ratio of growth rates (eGFP/mCherry). (F) Same as (E) but expressed in terms of log2 fold change of the fractions. The two gray dashed lines in (E and F) refer to a growth rate advantage of eGFP cells at 0% and 10%, respectively.
Fig. 3.
Fig. 3.
Likelihood of single-strain fixation or coexistence as a function of the number of cells seeded within the microchannels. (A) Experimental results for five ranges of initial total cell abundance. Both cell types, under high induction, were randomly loaded into the microchannels at equal concentrations. Sample size from left to right: N = 69, 47, 33, 36, 14. (B) Simulation results (N=5,000 for each data point) for an increasing, equal abundance of cells of each type randomly positioned within the microchannel. Error bars result from bootstrapping the experimental data.
Fig. 4.
Fig. 4.
Fraction of competitive outcomes resulting in fixation or coexistence for cells with different morphologies (bacillus/coccus). All experiments/simulations were performed at high induction. (A) Experimental outcomes in microchannels between two competing bacillus populations, a bacillus and coccus population (“mixed” competition), and two coccus populations (P-values denoted: ns > 0.05, **** < 0.0001, two-sample t test). (B) Simulated effects on outcomes within mixed competition by varying the relative length of the cells (length mCherry/length eGFP) while holding the eGFP cell length fixed (the gray dashed lines indicate the corresponding experiments). (C) Simulations varying the damping coefficient of mCherry (coccus) cells relative to that of eGFP (bacillus) cells. (D) Simulations varying the damping coefficients of eGFP (coccus) and mCherry (coccus) cells in concert without changing their relative damping ratio. Faster (slower) growing cells are indicated by the rabbit (turtle). Error bars result from bootstrapping the data.
Fig. 5.
Fig. 5.
The diversity of coexisting populations is inherently limited by mechanical interactions within microchannels. (A) Coexistence can accommodate a limited number of domains of each strain. (B) Schematic example of the reduction in the number of observed domains when three strains (hashing) are indicated by only two labels (red/green). The observed number of domains will, on average, be less than the total number of strains that are actually present in the population. (C) Simulation results for the number of surviving progenitor cell lines (domains) as a function of the abundance of seeded progenitor cells. The bubble plot represents the distribution of the data reflected by the bubble sizes (s = n) (see SI Appendix, Fig. S17 for an extended analysis). (D) Comparison between experimental results and simulations. Both the actual as well as the dual-labeled simulation results (for comparison with experimental observations) are presented. The bubble plot represents the distribution of experimental data (bubble sizes, s = n2).
Fig. 6.
Fig. 6.
Coexistence and fixation in the modified Pólya urn model. (A) Graphical representation of the Pólya urn process. Fixation of a strain is defined as occurring when the final fraction of the other strain is 0.2; otherwise, the species are considered to coexist. Using this definition of fixation and coexistence, the competitive outcomes of the Pólya urn model semiquantitatively recover the outcomes of agent-based simulations (which were in agreement with our experiments). (B) The probability of the fraction of eGFP cells in coexistence increases as the growth advantage of eGFP cells increases with the same trend in both experiments and the Pólya urn model (Pólya: High = 0.65 ± 0.20; Pólya: Low = 0.50 ± 0.15; Exp: High = 0.65 ± 0.21; Exp: Low = 0.51 ± 0.11. High/Low indicates induction level.). The experimental means and SD are from a Gaussian fit to the data, which approximates the β-distribution predicted by the Pólya model. Experimental data are at low initial seeding with Polya seeded at N=3/strain. (C) The probability of each competitive outcome starting from a single cell of each strain as a function of the relative growth rate between strains (eGFP/mCherry). (D) The probability of each (high-induction/biased) competitive outcome as the initial abundance of each cell is increased (starting at equal abundance). The curves are the results of 20,000 trajectories of the Pólya urn model. The shaded regions indicate one SD from the mean of the agent-based simulations.

References

    1. Stoodley P., Sauer K., Davies D. G., Costerton J. W., Biofilms as complex differentiated communities. Annu. Rev. Microbiol. 56, 187–209 (2002). - PubMed
    1. Flemming H. C., et al. , Biofilms: An emergent form of bacterial life. Nat. Rev. Microbiol. 14, 563–575 (2016). - PubMed
    1. Shapiro J. A., Thinking about bacterial populations as multicellular organisms. Annu. Rev. Microbiol. 52, 81–104 (1998). - PubMed
    1. Nadell C. D., Drescher K., Foster K. R., Spatial structure, cooperation and competition in biofilms. Nat. Rev. Microbiol. 14, 589–600 (2016). - PubMed
    1. Azimi S., Lewin G. R., Whiteley M., The biogeography of infection revisited. Nat. Rev. Microbiol. 20, 579–592 (2022). - PMC - PubMed

Publication types

LinkOut - more resources