. 2024 May 8;16(9):8110-8141.
doi: 10.18632/aging.205807. Epub 2024 May 8.

Revealing prognostic insights of programmed cell death (PCD)-associated genes in advanced non-small cell lung cancer

Affiliations

Revealing prognostic insights of programmed cell death (PCD)-associated genes in advanced non-small cell lung cancer

Weiwei Dong et al. Aging (Albany NY). .

Abstract

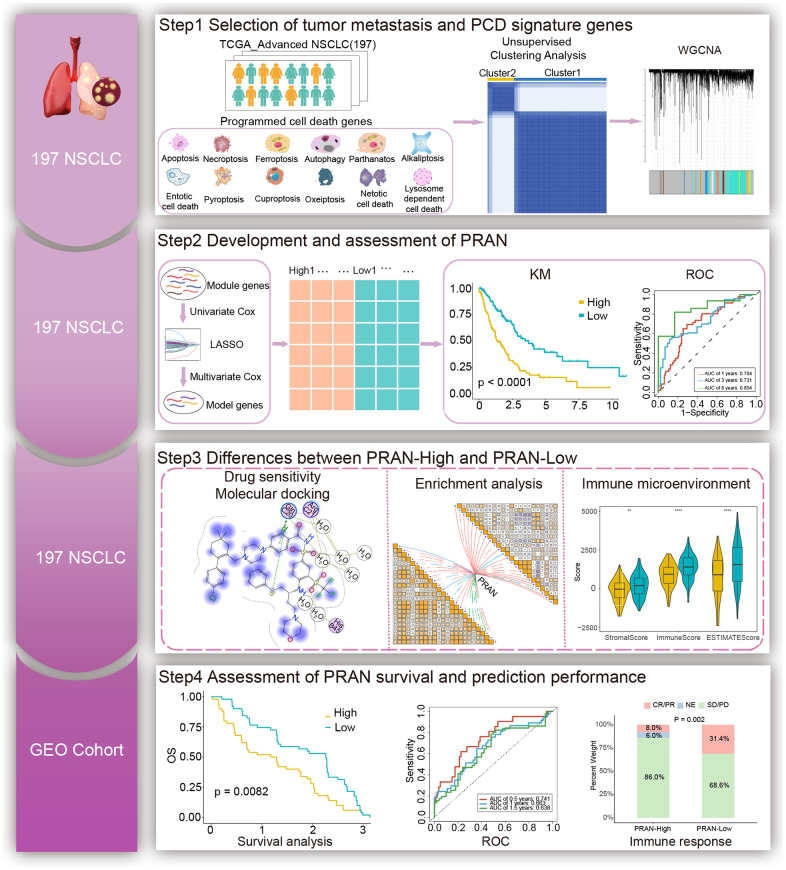
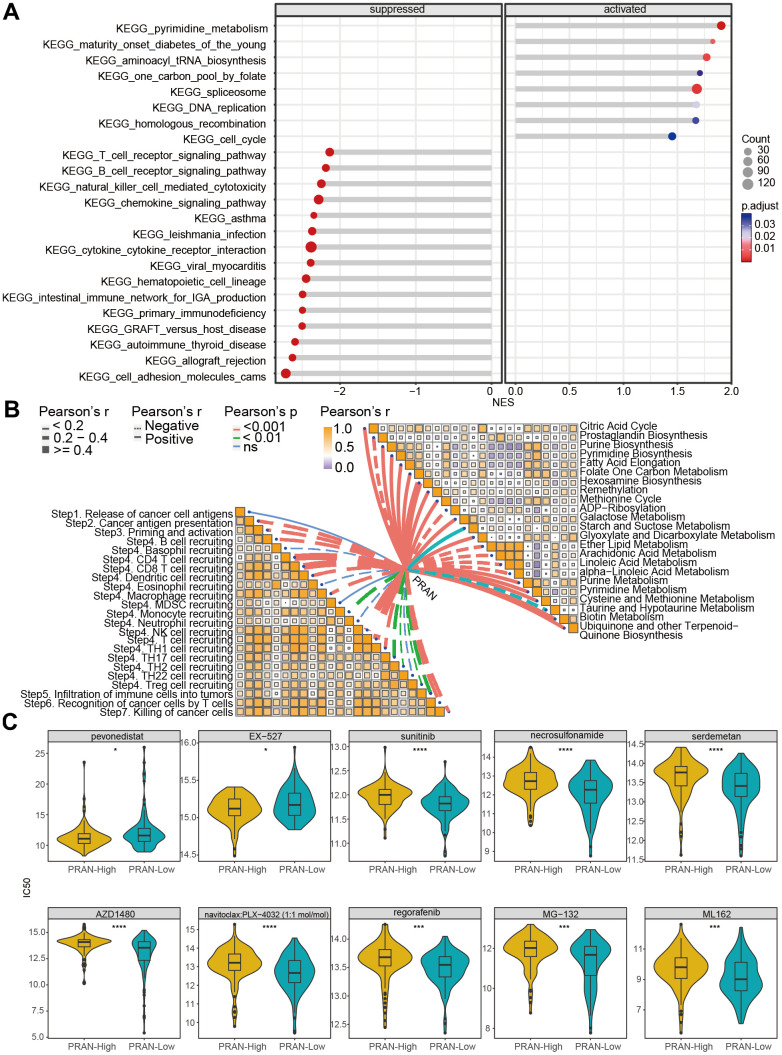
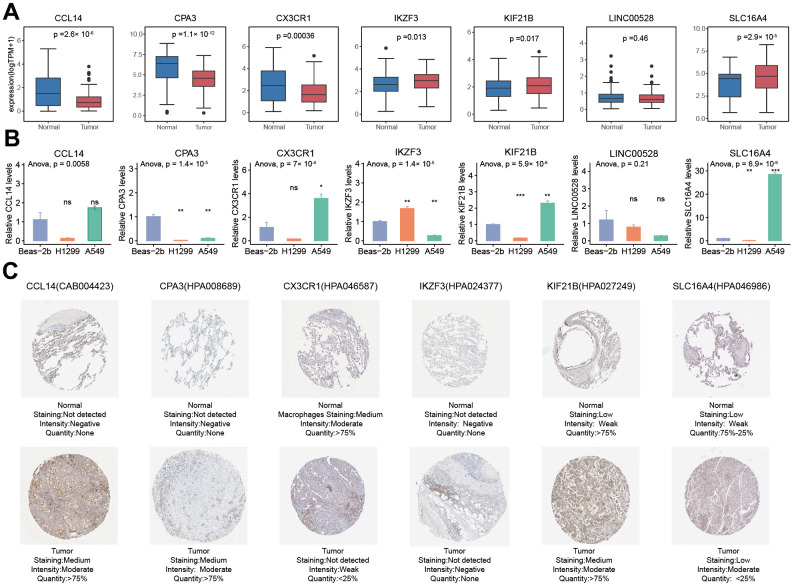
The management of patients with advanced non-small cell lung cancer (NSCLC) presents significant challenges due to cancer cells' intricate and heterogeneous nature. Programmed cell death (PCD) pathways are crucial in diverse biological processes. Nevertheless, the prognostic significance of cell death in NSCLC remains incompletely understood. Our study aims to investigate the prognostic importance of PCD genes and their ability to precisely stratify and evaluate the survival outcomes of patients with advanced NSCLC. We employed Weighted Gene Co-expression Network Analysis (WGCNA), Least Absolute Shrinkage and Selection Operator (LASSO), univariate and multivariate Cox regression analyses for prognostic gene screening. Ultimately, we identified seven PCD-related genes to establish the PCD-related risk score for the advanced NSCLC model (PRAN), effectively stratifying overall survival (OS) in patients with advanced NSCLC. Multivariate Cox regression analysis revealed that the PRAN was the independent prognostic factor than clinical baseline factors. It was positively related to specific metabolic pathways, including hexosamine biosynthesis pathways, which play crucial roles in reprogramming cancer cell metabolism. Furthermore, drug prediction for different PRAN risk groups identified several sensitive drugs explicitly targeting the cell death pathway. Molecular docking analysis suggested the potential therapeutic efficacy of navitoclax in NSCLC, as it demonstrated strong binding with the amino acid residues of C-C motif chemokine ligand 14 (CCL14), carboxypeptidase A3 (CPA3), and C-X3-C motif chemokine receptor 1 (CX3CR1) proteins. The PRAN provides a robust personalized treatment and survival assessment tool in advanced NSCLC patients. Furthermore, identifying sensitive drugs for distinct PRAN risk groups holds promise for advancing targeted therapies in NSCLC.

Keywords: PRAN risk model; RT-qPCR; advanced NSCLC; molecular docking; programmed cell death-related genes.


Conflict of interest statement

CONFLICTS OF INTEREST: LH, YZ, SL, and JZ were employed by Beijing ChosenMed Clinical Laboratory Co. Ltd. The remaining authors declare that the research was conducted without any commercial or financial relationships that could be construed as a potential conflict of interest.

Figures

Figure 1
Figure 1
The workflow of the study.
Figure 2
Figure 2
The landscape of genetic and transcriptional alterations of PCD genes in TCGA-Advanced NSCLC. (A) Volcano plot depicting the differential expression of PCD genes between tumor and normal samples. (B) Circos plot illustrating the chromosomal distribution of 12 prognosis related differential PCD genes. Each outer circle represents a chromosome, and the connecting lines display the genomic location of the PCD genes. (C) Principal Component Analysis (PCA) plot of 12 PCD-related genes. (D) Correlation analysis heatmap of 12 PCD-related genes in the TCGA-Advanced NSCLC dataset. The color scale represents the correlation coefficients, with red indicating positive correlation and blue indicating negative correlation. (E) Copy Number Variation (CNV) frequencies of 12 PCD-related genes. (F) Mutation frequencies of 12 PCD-associated differential genes in the TCGA-Advanced NSCLC cohort. The column height represents the frequency of mutations, and different types of mutations are distinguished by color.
Figure 3
Figure 3
Cluster analysis of 12 PCD-related genes in TCGA-Advanced NSCLC dataset. (A) Non-negative Matrix Factorization (NMF) clustering of twelve PCD-related genes. The correlation coefficients at k = 2-10 are presented in the Figure. (B) Consistency plot illustrating the stability of NMF clustering results. (C) Kaplan-Meier (KM) survival curves of patients in PCD-related clusters. (D) Gene Ontology (GO) analysis of differential genes between cluster 1 and cluster 2. (E) Kyoto Encyclopedia of Genes and Genomes (KEGG) analysis of differential genes between cluster 1 and cluster 2. (F) Heatmap displaying the hallmark pathways in different PCD clusters.
Figure 4
Figure 4
Development of prognostic signature using PCD-related genes in TCGA-Advanced NSCLC dataset. (A) Heatmap of correlation between gene modules and clinical traits, each cell containing Pearson’s correlation coefficient and p-value. (B) Forest plot depicting the associations between the expression levels of seven PCD genes and overall survival (OS) in the training cohort. Hazard Ratio (HR), 95% Confidence Interval (CI), and p-value were determined by multivariate Cox regression analysis. (C) Kaplan-Meier (KM) curve analysis of the prognostic model in the training set, showing the survival differences between high-risk and low-risk groups. (D) Time-dependent receiver operating characteristic (ROC) curves and area under the curve (AUC) values of the PRAN model for predicting survival status in 1-, 3-, and 8-year. (E) Comparison of PRAN scores, survival status, and expression of seven PCD genes between PRAN-High and PRAN-Low groups. P-value: * < 0.05; *** < 0.001.
Figure 5
Figure 5
The correlation validation of PRAN risk model in TCGA-Advanced NSCLC dataset. (A) The Sankey plot illustrates the distribution of PCD risk groups, PCD clusters, and survival outcomes. (B) Box plots depicting the relationship between PCD clusters and PRAN risk groups. (C) Box plots showing the expression levels of 12 PCD-related prognosis genes between PRAN-High and PRAN-Low groups. (D) Univariate Cox regression analysis of PCD risk scores and clinical variables. (E) Multivariate Cox regression analysis of PCD risk scores and clinical variables. P-value: ns >=0.05; * < 0.05; ** < 0.01; *** < 0.001; **** < 0.0001.
Figure 6
Figure 6
Biological function analysis and drug-susceptibility analysis of PRAN risk model in TCGA-Advanced NSCLC dataset. (A) The lollipop plot displays the top 10 significantly enriched suppressed pathways and all activated pathways in the PRAN-High and PRAN-Low groups. (B) Pearson correlation analysis demonstrates the relationship between PCD scores and cancer immune cycle activity (left) and metabolism-related pathways (right). (C) Sensitivity analysis of anti-tumor drugs between PRAN-High and PRAN-Low groups. P-value: ns >=0.05; * < 0.05; ** < 0.01; *** < 0.001; **** < 0.0001.
Figure 7
Figure 7
The molecular docking posture predicting for the sensitive anti-tumor drugs and targeted PCD genes. (A) Docking position of CCL14 active pocket with navitoclax. (B) Docking position of CPA3 active pocket with navitoclax. (C) Docking position of CX3CR1 with navitoclax. (D) Docking position of IKZF3 with AZD1480. (E) Docking position of KIF21B with MG-132.
Figure 8
Figure 8
Immune infiltration analysis of PRAN-High and PRAN-Low groups TCGA-Advanced NSCLC dataset. (A) Violin plot showing the immune cell enrichment scores of PRAN-High and PRAN-Low groups, assessed using MCPcounter. (B) The ssGSEA algorithm shows the immune cell infiltration of immune-related functions and pathways in PRAN-High and PRAN-Low groups. (C) Immune cell infiltration content of PRAN-High and PRAN-Low groups was analyzed using the CIBERSORT algorithm. The analysis provides insights into the proportion of different immune cell types in each risk group. (D) Expression of immunoinhibitor genes between PRAN-High and PRAN-Low groups. P-value: * < 0.05; ** < 0.01; *** < 0.001; **** < 0.0001.
Figure 9
Figure 9
The predicting performance validation of the PRAN risk model in multiple GEO cohorts. (AC) Kaplan-Meier survival analysis in NSCLC validation cohort GSE61676, GSE13213, and GSE91061. (DF) Time-dependent ROC curves between PRAN-High and PRAN-Low groups in validation cohort GSE61676, GSE13213, and GSE377453. (G) Kaplan-Meier survival analysis in validation cohort GSE74777. (H) Time-dependent ROC curves between PRAN-High and PRAN-Low groups in validation cohort GSE74777. (I) The predicting performance of immunotherapeutic efficiency of PRAN risk model in the GSE91061 cohort.
Figure 10
Figure 10
Construction and validation of the PRAN score-based nomogram. (A) The nomogram plot was constructed in the training cohort with incorporation of PRAN and clinical characteristics. (B) Kaplan-Meier survival curves based on PRAN scores calculated using the nomogram. (C) ROC curves for predicting 1-year, 3-year and 8-year OS for the nomogram. (D) Decision curve analysis of nomogram, PRAN risk model and clinical characteristics. The black line in this Figure indicates the assumption of no patient death. (E) Nomogram calibration plot based on the agreement between predicted and observed values at 1, 3, and 8 years. X-axis is nomogram predicted overall survival, y-axis is actual overall survival, dashed line is ideal performance of nomogram, and 95% confidence interval is represented by closed vertical line.
Figure 11
Figure 11
Comparison analysis of the expression of seven PRAN model genes between NSCLC tumor and normal samples at RNA and protein levels. (A) RNA expression differences of seven PRAN model genes between tumor and normal samples in TCGA-Advanced NSCLC. (B) RNA expression differences of seven PRAN model genes between two tumor cell lines and one normal cell line. (C) The immunohistochemistry image of CCL4 (CAB004423), CPA3 (HPA008689), CX3CR1 (HPA046587), IKZF3 (HPA024377), KIF21B (HPA027249), and SLC16A4 (HPA046986) from HPA database. The URLs of the source of each image were shown in Supplementary Table 7.

References

    1. Herbst RS, Morgensztern D, Boshoff C. The biology and management of non-small cell lung cancer. Nature. 2018; 553:446–54. 10.1038/nature25183 - DOI - PubMed
    1. Sung H, Ferlay J, Siegel RL, Laversanne M, Soerjomataram I, Jemal A, Bray F. Global Cancer Statistics 2020: GLOBOCAN Estimates of Incidence and Mortality Worldwide for 36 Cancers in 185 Countries. CA Cancer J Clin. 2021; 71:209–49. 10.3322/caac.21660 - DOI - PubMed
    1. Siegel RL, Miller KD, Jemal A. Cancer statistics, 2020. CA Cancer J Clin. 2020; 70:7–30. 10.3322/caac.21590 - DOI - PubMed
    1. Chen R, Manochakian R, James L, Azzouqa AG, Shi H, Zhang Y, Zhao Y, Zhou K, Lou Y. Emerging therapeutic agents for advanced non-small cell lung cancer. J Hematol Oncol. 2020; 13:58. 10.1186/s13045-020-00881-7 - DOI - PMC - PubMed
    1. Pitt JM, Marabelle A, Eggermont A, Soria JC, Kroemer G, Zitvogel L. Targeting the tumor microenvironment: removing obstruction to anticancer immune responses and immunotherapy. Ann Oncol. 2016; 27:1482–92. 10.1093/annonc/mdw168 - DOI - PubMed

MeSH terms