. 2024 May 8;16(9):8070-8085.
doi: 10.18632/aging.205805. Epub 2024 May 8.

KLF4 inhibited the senescence-associated secretory phenotype in ox-LDL-treated endothelial cells via PDGFRA/NAMPT/mitochondrial ROS

Affiliations

KLF4 inhibited the senescence-associated secretory phenotype in ox-LDL-treated endothelial cells via PDGFRA/NAMPT/mitochondrial ROS

Haoran Ding et al. Aging (Albany NY). .

Abstract

Background: Inflammation is one of the significant consequences of ox-LDL-induced endothelial cell (EC) dysfunction. The senescence-associated secretory phenotype (SASP) is a critical source of inflammation factors. However, the molecular mechanism by which the SASP is regulated in ECs under ox-LDL conditions remains unknown.

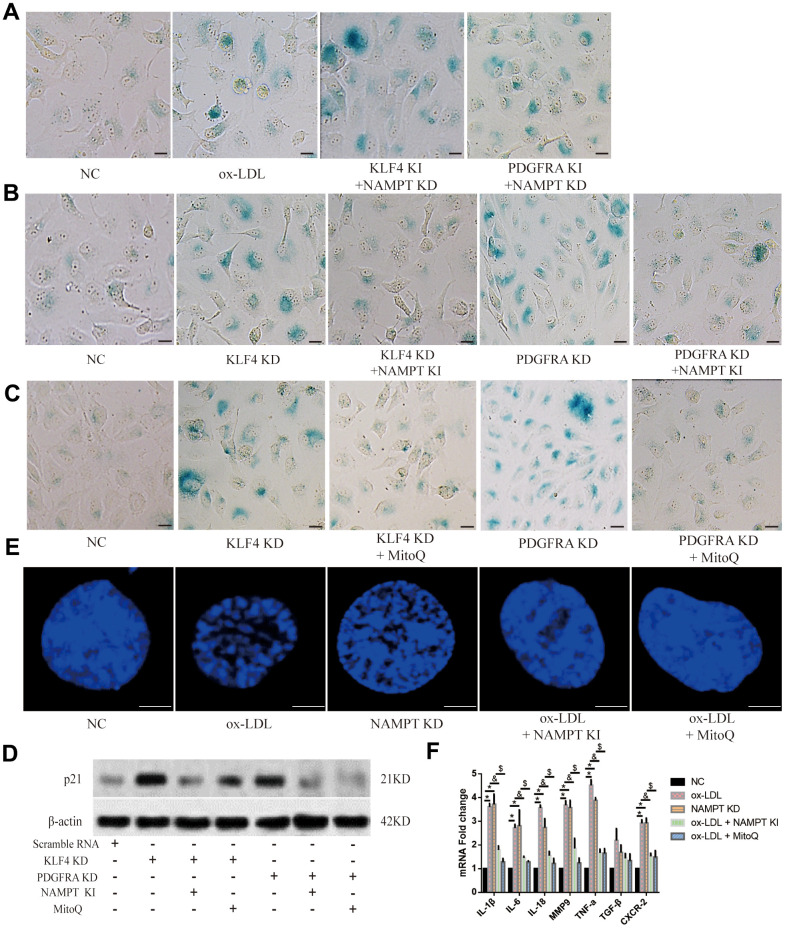
Results: The level of SASP was increased in ox-LDL-treated ECs, which could be augmented by KLF4 knockdown whereas restored by KLF4 knock-in. Furthermore, we found that KLF4 directly promoted PDGFRA transcription and confirmed the central role of the NAPMT/mitochondrial ROS pathway in KLF4/PDGFRA-mediated inhibition of SASP. Animal experiments showed a higher SASP HFD-fed mice, compared with normal feed (ND)-fed mice, and the endothelium of EC-specific KLF4-/- mice exhibited a higher proportion of SA-β-gal-positive cells and lower PDGFRA/NAMPT expression.

Conclusions: Our results revealed that KLF4 inhibits the SASP of endothelial cells under ox-LDL conditions through the PDGFRA/NAMPT/mitochondrial ROS.

Methods: Ox-LDL-treated ECs and HFD-fed mice were used as endothelial senescence models in vitro and in vivo. SA-β-gal stain, detection of SAHF and the expression of inflammatory factors determined SASP and senescence of ECs. The direct interaction of KLF4 and PDGFRA promotor was analyzed by EMSA and fluorescent dual luciferase reporting analysis.

Keywords: KLF4; NAMPT/mitochondrial ROS; PDGFRA; SASP; endothelial cells.


Conflict of interest statement

CONFLICTS OF INTEREST: The authors declare that they have no conflicts of interest.

Figures

Figure 1
Figure 1
Analysis of KLF4 protein expression and EC dysfunction. (A) Immunohistochemical detection of vascular wall KLF4 expression. Scale bar, 20 μm. Representative images (n=5) are shown. Red arrow, KLF4 expression in the intima of mice fed a normal diet. Yellow arrow, intima lacking KLF4 expression in mice fed a high-fat diet. Blue arrow, KLF4 expression in adventitial fibroblasts. (B) Western blotting analysis of KLF4 protein expression in cultured HUVECs (100 μg/ml ox-LDL, 24 h) (n=5). (C) GO and KEGG analysis of the pathways after KLF4 knock in and knock out in HUVECs.
Figure 2
Figure 2
KLF4 inhibits the EC SASP. (A) Histochemical detection of the SA-β-gal-positive area in the vascular wall of mice fed a high-fat diet. Representative images (n=5) are shown. Red arrow, SA-β-gal-positive intima. (B) Immunohistochemical detection demonstrates the efficiency of specific conditional KLF4 knockout in mouse endothelial cells (EC KLF4-/-). Scale bar, 200 μm. Representative images (n=5) are shown. Red arrow, KLF4 expression in normal mouse intima. Yellow arrow, intima lacking KLF4 expression in mice fed a high-fat diet. Blue arrow, KLF4 expression in adventitial fibroblasts. (C) Histochemical detection of SA-β-gal-positive areas in the vascular wall of EC KLF4-/- mice. Scale bar, 1 cm. Representative images (n=5) are shown. Red arrow, SA-β-gal-positive intima. (D) Immunohistochemical detection of p21 protein expression in the intima of EC KLF4-/- mice. Scale bar, 200 μm. Representative images (n=5) are shown. Red arrow, p21-positive endothelial cells. (E) Histochemical detection of SA-β-gal-positive ECs in HUVECs. Scale bar, 50 μm. Representative images (n=5) are shown. Blue, SA-β-gal-positive ECs. (F) Western blotting analysis of KLF4 protein expression in the intima of EC KLF4-/- mice. (G) Western blotting analysis of p21 protein expression in HUVECs after KLF4 expression is altered (n=5). (H) Immunofluorescence detection of typical SAHF formation in HUVECs (n=5). Scale bar, 5 μm. (I) Protein chip analysis in HUVECs (n=3). (J) qPCR analysis of the mRNA levels of cytokines in HUVECs (n=5). *P < 0.05. (K) Western blotting analysis of PAI-2 and uPA protein expression in HUVECs (n=5).
Figure 3
Figure 3
KLF4 promotes PDGFRA transcription. (A) PPI network analysis in cultured HUVECs. (B) Western blotting analysis of the PDGF pathway in HUVECs. (C) The amounts of PDGFRA, PDGF-BB and PDGFRB in (B) quantified using actin as control. (n=5). *P < 0.05. (D) Seed region for the KLF4 binding site. (E) Luciferase activity analysis of the PDGF pathway in HUVECs (n=5). *P < 0.05. (F) EMSA analysis of the PDGF pathway in HUVECs (n=3). *P < 0.05. (G) Luciferase activity of mutant PDGFRA in HUVECs (n=5). *P < 0.05.
Figure 4
Figure 4
KLF4 inhibited the HUVEC SASP through PDGFRA. (A) Western blotting analysis of PDGFRA protein expression in ox-LDL-treated HUVECs (n=5). (B) Immunohistochemical detection of PDGFRA protein expression in the intima of ND-fed WT mice, HFD-fed WT mice and HFD-fed EC KLF4-/- mice. Scale bar, 200 μm. Representative images (n=5) are shown. Red arrow, PDGFRA-positive endothelial cells. (C) Western blotting analysis of p21 protein expression in ox-LDL-treated HUVECs after altered PDGFRA expression (n=5). (D) Histochemical detection of SA-β-gal-positive ECs in ox-LDL-treated HUVECs after altered PDGFRA expression. Scale bar, 50 μm. Representative images (n=5) are shown. Blue, SA-β-gal-positive ECs. (E) SA-β-gal staining positive cells were counted and presented as percentage of total cells. (F) Immunofluorescence detection of typical SAHF formation in cultured HUVECs (n=5). Scale bar, 20 μm. (G) qPCR analysis of the mRNA levels of cytokines in ox-LDL-treated HUVECs after regulating PDGFRA (n=5). *P < 0.05. (H) Histochemical detection of SA-β-gal-positive ECs in KLF4-treated HUVECs after regulating PDGFRA. Scale bar, 50 μm. Representative images (n=5) are shown. Blue, SA-β-gal-positive ECs. (I) Western blotting analysis of p21 protein expression in KLF4-treated HUVECs after regulating PDGFRA (n=5). (J) qPCR analysis of the mRNA levels of cytokines in KLF4-knock-in HUVECs after PDGFRA knockdown (n=5). *P < 0.05. (K) qPCR analysis of cytokine mRNA levels in KLF4-knockdown HUVECs after PDGFRA knock-in (n=5). *P < 0.05.
Figure 5
Figure 5
KLF4/PDGFRA regulated NAMPT/MitoROS expression. (A) Western blotting analysis of NAMPT protein expression in cultured HUVECs (n=5). (B) Immunohistochemical detection of NAMPT protein expression in the intima of high-fat diet-fed mice or EC KLF4-/- mice. Scale bar, 200 μm. Representative images (n=5) are shown. Red arrow, NAMPT-positive endothelial cells. (C) Immunofluorescence detection of MitoROS in cultured HUVECs. Scale bar, 20 μm. Representative images (n=5) are shown. Red, ROS. Green, Mitochondria. Yellow, MitoROS. (D) Flow cytometry analysis for MitoROS quantification in KLF4-treated HUVECs after altering NAMPT expression (n=5). *P < 0.05. (E) Flow cytometry analysis of MitoROS quantification in PDGFRA-treated HUVECs after altering NAMPT expression (n=5). *P < 0.05.
Figure 6
Figure 6
NAMPT/MitoROS regulated the SASP in HUVECs. (A) Histochemical detection of SA-β-gal-positive ECs in NAMPT knockdown HUVECs after knock-in of KLF4 or PDGFRA. Scale bar, 50 μm. Representative images (n=5) are shown. Blue, SA-β-gal-positive ECs. (B) Histochemical detection of SA-β-gal-positive ECs in NAMPT knock-in HUVECs after KLF4 or PDGFRA knockdown. Scale bar, 50 μm. Representative images (n=5) are shown. Blue, SA-β-gal-positive ECs. (C) Histochemical detection of SA-β-gal-positive ECs in MitoQ-treated HUVECs after KLF4 or PDGFRA knockdown. Scale bar, 50 μm. Representative images (n=5) are shown. Blue, SA-β-gal-positive ECs. (D) Western blotting analysis of p21 protein expression in NAMPT knock-in- or MitoQ-treated HUVECs (n=5). (E) Immunofluorescence detection of typical SAHF formation in cultured HUVECs after altering NAMPT expression or treatment with MitoQ (n=5). Scale bar, 20 μm. (F) qPCR analysis of cytokine mRNA levels in cultured HUVECs after altering NAMPT expression or treatment with MitoQ (n=5). *P < 0.05.

References

    1. Meng B, Li Y, Ding Y, Xu X, Wang L, Guo B, Zhu B, Zhang J, Xiang L, Dong J, Liu M, Xiang L, Xiang G. Myeloid-derived growth factor inhibits inflammation and alleviates endothelial injury and atherosclerosis in mice. Sci Adv. 2021; 7:eabe6903. 10.1126/sciadv.abe6903 - DOI - PMC - PubMed
    1. Ma S, Fan L, Cao F. Combating cellular senescence by sirtuins: Implications for atherosclerosis. Biochim Biophys Acta Mol Basis Dis. 2019; 1865:1822–30. 10.1016/j.bbadis.2018.06.011 - DOI - PubMed
    1. Yu T, Chen X, Zhang W, Liu J, Avdiushko R, Napier DL, Liu AX, Neltner JM, Wang C, Cohen D, Liu C. KLF4 regulates adult lung tumor-initiating cells and represses K-Ras-mediated lung cancer. Cell Death Differ. 2016; 23:207–15. 10.1038/cdd.2015.85 - DOI - PMC - PubMed
    1. Panatta E, Lena AM, Mancini M, Affinati M, Smirnov A, Annicchiarico-Petruzzelli M, Piro MC, Campione E, Bianchi L, Mazzanti C, Melino G, Candi E. Kruppel-like factor 4 regulates keratinocyte senescence. Biochem Biophys Res Commun. 2018; 499:389–95. 10.1016/j.bbrc.2018.03.172 - DOI - PubMed
    1. Salmon M, Gomez D, Greene E, Shankman L, Owens GK. Cooperative binding of KLF4, pELK-1, and HDAC2 to a G/C repressor element in the SM22α promoter mediates transcriptional silencing during SMC phenotypic switching in vivo. Circ Res. 2012; 111:685–96. 10.1161/CIRCRESAHA.112.269811 - DOI - PMC - PubMed

Publication types

MeSH terms

Substances

LinkOut - more resources