. 2024 May 10;10(19):eadk9137.
doi: 10.1126/sciadv.adk9137. Epub 2024 May 10.

Diet-induced obesity affects influenza disease severity and transmission dynamics in ferrets

Affiliations

Diet-induced obesity affects influenza disease severity and transmission dynamics in ferrets

Victoria Meliopoulos et al. Sci Adv. .

Abstract

Obesity, and the associated metabolic syndrome, is a risk factor for increased disease severity with a variety of infectious agents, including influenza virus. Yet, the mechanisms are only partially understood. As the number of people, particularly children, living with obesity continues to rise, it is critical to understand the role of host status on disease pathogenesis. In these studies, we use a diet-induced obese ferret model and tools to demonstrate that, like humans, obesity resulted in notable changes to the lung microenvironment, leading to increased clinical disease and viral spread to the lower respiratory tract. The decreased antiviral responses also resulted in obese animals shedding higher infectious virus for a longer period, making them more likely to transmit to contacts. These data suggest that the obese ferret model may be crucial to understanding obesity's impact on influenza disease severity and community transmission and a key tool for therapeutic and intervention development for this high-risk population.


Figures

Fig. 1.
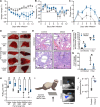
Fig. 1.. Obesogenic diet alters the pulmonary microenvironment at baseline.
(A) After 12 weeks on diet, male obese and control ferrets were euthanized, and individual lobes of the lungs were resected. Tissues were homogenized, and RNA was extracted for high-throughput PCR. Each lobe was considered a separate sample. Illustration created with Biorender.com. (B) Volcano plot of differences in gene expression between control and obese ferrets, represented by −log10 of p-value against log2 fold change. (C) Database for Annotation, Visualization and Integrated Discovery enrichment analysis of up- and down-regulated genes in uninfected obese ferret lungs. Absolute value indicates enrichment score, with negative scores indicating relative down-regulation from uninfected control lungs. (D to F) Differences in pulmonary gene expression between control and obese ferrets at homeostasis. Fold expression was calculated via the 2−ΔΔCt method. (D) Obesity-related markers are increased in obese ferrets. Expression of Fas cell surface death receptor (Fas, P = 0.0014), T-box transcription factor 21 (Tbx21, P = 0.0001), and serpin family E member 2 (Serpine2, P = 0.0277) was significantly increased. (E) Obese ferrets have significantly increased levels of the immune and antiviral defense genes interleukin-7 receptor (Il7r, P = 0.0484), interleukin-12A (Il12a, P = 0.0310), granzyme B (Gzmb, P = 0.0011), and interleukin-33 (Il33, P = 0.0484). (F) Decreased pulmonary surfactant (Sftpb, P = 0.0911) and amphiregulin (Areg) in obese ferrets. Significance was determined by unpaired t test. Data represent the average of five lung lobes per n = 1 ferret per group and one independent experiment of n = 1 per group. Samples were run in duplicate. Error bars represent minimum value to maximum value. *P < 0.05 and #P < 0.10. HTqPCR, high-throughput quantitative polymerase chain reaction; GO, Gene Ontology; TGFβ, transforming growth factor–β.
Fig. 2.
Fig. 2.. Disease severity following influenza infection is increased in obese ferrets.
Male control and obese ferrets were inoculated with 106 TCID50 A/California/04/2009 (H1N1) virus and monitored for 12 days. Daily (A) weight (P = 0.0002) and (B) temperature (P = 0.0032) were recorded. (C) Clinical scores (P = 0.0267) were recorded as described. Data represent two independent experiments of n = 4 to 6 per group. (D) Gross pathology of lungs from control and obese ferrets infected as in (A) at 6 dpi. Images represent n = 5 per group. (E) Hematoxylin and eosin (H&E) staining of lungs from uninfected control and obese ferrets, or ferrets infected as in (A) at 6 dpi. Data represent two independent experiments of n = 4 per group with six sections per ferret. Scale bars, 100 μm. (F and G) Quantification of total inflamed area as (F) percent of lung tissue (baseline, P = 0.0085) or (G) fold change over own uninfected (6 dpi, P = 0.0415). (H) Lungs were separated by lobe and TCID50 assays performed to measure viral titers at 3 dpi (upper left lobe, P = 0.0043; lower left, P = 0.0079; upper right, P = 0.0845; middle right, P = 0.0034; and lower right, P = 0.0031). Data represent two independent experiments with n = 2 per group. (I) Male control and obese ferrets were infected with 105.5 TCID50 of A/California/04/2009-PA NLuc (H1N1) bioluminescent reporter virus. At 2 (P = 0.0175) dpi, the chest was imaged to detect virus in the lungs. Luminescence on the arm indicates substrate injection site. Illustration created with Biorender.com. (J) Quantification of (I). Data represent one independent experiment of n = 3 per group. Statistical significance was determined by mixed-effects analysis with repeated measures [(A) to (C), P value represents simple main effects analysis on diet], t test [(F), (G), and (J)], or multiple unpaired t tests (H). Error bars show SEM [(A) to (C) and (H)] or SD of the mean [(F), (G), and (I)]. Dashed lines indicate baseline weight (A), normal range (B), or lower limit of detection (H). *P < 0.05 and #P < 0.10.
Fig. 3.
Fig. 3.. Altered inflammatory and immune gene expression in obese ferrets after infection.
Male ferrets infected with 106 TCID50 of A/California/04/2009 (H1N1) virus were euthanized at 6 dpi to collect lung tissue. Lungs were separated by lobe, and each lobe was treated as an individual sample. RNA was extracted from homogenates for high-throughput PCR. (A) Heatmap of gene expression normalized to uninfected control ferret using the 2−ΔΔCt method. Obese infected ferrets group more closely with obese baseline (bars). Green indicates increased gene expression relative to uninfected control ferret, and purple indicates decreased. (B to F) Gene expression in obese and control ferret lungs after infection, normalized within diet groups to expression levels at baseline. (B) Il1a, P = 0.0342; Nos2, P = 0.0192; Retn, P = 0.0449. (C) Irf1, P = 0.0733; Ifnar2, P = 0.0218; Ifna.c, P = 0.0877; and Mx1, P = 0.0129. (D) Tbx21, P = 0.0001; and Gzmb, P < 0.0001. (E) Il1rl1, P = 0.0003; Il1b.c, P = 0.0934; Il2, P = 0.0440; Il6.c, P = 0.0953; and Il10, P = 0.0535. (F) Areg, P = 0.0110; Mmp1, P = 0.0833; Mmp7, P = 0.0890; and Smad3, P = 0.0513. Significance was determined by unpaired t test. Data represent the average of five lung lobes per n = 2 ferrets per group and one independent experiment of n = 2 per group. Samples were run in duplicate. Error bars represent minimum value to maximum value. *P < 0.05 and #P < 0.10.
Fig. 4.
Fig. 4.. Increased disease severity in obese ferrets is independent of viral strain.
Male control and obese ferrets were infected with 106 TCID50 of A/Memphis/257/2019 (H3N2), A/Hong Kong/1073/1999 (H9N2), or B/Brisbane/60/2008 (influenza B) viruses and monitored for 12 days. (A to C) Weights (H3N2, P = 0.0165; H9N2, P = 0.3492; and influenza B, P = 0.0945), (D to F) body temperature (H3N2, P = 0.0772; H9N2, P = 0.0443; and influenza B, P = 0.0953), and (G to I) clinical scores (H3N2, P = 0.0614; H9N2, P = 0.0027; and influenza B, p = 0.0575) were recorded as described in Fig. 2. Data represent two independent experiments of n = 6 to 7 per group (H3N2), four independent experiments of n = 2 to 7 per group (H9N2), and two independent experiments of n = 3 to 5 per group (influenza B). Significance was determined by mixed-effects analysis with repeated measures (P value represents simple main effects analysis of diet). Error bars represent SEM, and dashed lines indicate baseline weight [(A) to (C)] or normal range [(D) to (F)]. *P < 0.05 and #P < 0.10.
Fig. 5.
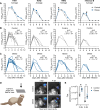
Fig. 5.. Increased viral replication in the URT of obese ferrets.
(A) Male control and obese ferrets were infected with 106 TCID50 of A/California/04/2009 (H1N1), A/Memphis/257/2019 (H3N2), and A/Hong Kong/1073/1999 (H9N2) or with 105.5 TCID50 of B/Brisbane/60/2008 (influenza B) viruses. Nasal washes were collected every 48 hours and viral titers measured by TCID50 assay. H1N1, 4 dpi, P = 0.2793; H9N2, 2 dpi, P = 0.0275; and influenza B, 2 dpi, P = 0.0476, by two-way analysis of variance (ANOVA) with multiple comparisons. (B) Nasal wash titers of individual control ferrets and (C) obese ferrets shown in (A). Data represent two independent experiments of n = 4 to 7 per group. (D) Male control and obese ferrets were infected with 105.5 TCID50 of A/California/04/2009-PA NLuc (H1N1) virus and the nasal cavity was imaged at 2 (P = 0.0412) and 4 (P = 0.0995) dpi. Illustration created with Biorender.com. (E) Quantification of (D). Statistical significance was determined by 2-way ANOVA with multiple comparisons. Data represent one independent experiment of n = 3 per group. Error bars show SEM (A) or SD of the mean (E), and dashed lines indicate the lower limit of detection. *P < 0.05 and #P < 0.10.
Fig. 6.
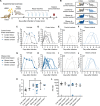
Fig. 6.. Obesity can affect viral transmission dynamics.
(A) Experimental setup for a direct transmission study. An index ferret was inoculated with 106 TCID50 A/Hong Kong/1073/1999 (H9N2) virus. After 24 hour, a naïve contact ferret was introduced. Nasal washes were collected every 48 hours for 12 days, and blood was collected at 21 dpi. (B) Schematic of the different transmission groups used in the study. Experiments were performed using male ferrets. Illustrations in (A) and (B) created with Biorender.com. (C) Nasal wash titers of control and obese ferrets paired with a control index ferret were measured by TCID50 assay. Average titer is shown. (D) Nasal wash titers of individual control index, (E) control contacts, and (F) obese contacts shown in (C). Number in top left indicates the number of ferrets that became influenza-positive/total number of contact ferrets. (G) Nasal wash titers of control and obese contacts paired with an obese index ferret. Average titer is shown. (H) Nasal wash titers of individual obese index, (I) control contacts, and (J) obese contacts paired with obese. (K) Area under the curve (AUC) of (B) and (E), control contacts P = 0.0270 by one way ANOVA with Sidak’s test. (L) Hemagglutination inhibition (HAI) assays were performed on plasma collected at 21 dpi. Control index versus obese contact paired with control P = 0.0793 by unpaired t test. Data represent three independent experiments of n = 3 to 4 transmission pairs per group. Error bars indicate SEM, and dashed lines indicate lower limit of detection in (C) to (J) and (L). *P < 0.05.

Update of

References

    1. Petersen A., Bressem K., Albrecht J., Thieß H.-M., Vahldiek J., Hamm B., Makowski M. R., Niehues A., Niehues S. M., Adams L. C., The role of visceral adiposity in the severity of COVID-19: Highlights from a unicenter cross-sectional pilot study in Germany. Metabolism 110, 154317 (2020). - PMC - PubMed
    1. Pugliese G., Liccardi A., Graziadio C., Barrea L., Muscogiuri G., Colao A., Obesity and infectious diseases: Pathophysiology and epidemiology of a double pandemic condition. Int. J. Obes. (Lond) 46, 449–465 (2022). - PubMed
    1. Zhao F., Ma Q., Yue Q., Chen H., SARS-CoV-2 infection and lung regeneration. Clin. Microbiol. Rev. 35, e0018821 (2022). - PMC - PubMed
    1. Luzi L., Radaelli M. G., Influenza and obesity: Its odd relationship and the lessons for COVID-19 pandemic. Acta Diabetol. 57, 759–764 (2020). - PMC - PubMed
    1. Yan J., Grantham M., Pantelic J., Bueno de Mesquita P. J., Albert B., Liu F., Ehrman S., Milton D. K., Infectious virus in exhaled breath of symptomatic seasonal influenza cases from a college community. Proc. Natl. Acad. Sci. U.S.A. 115, 1081–1086 (2018). - PMC - PubMed

Publication types