. 2024 May 10;9(95):eadi4191.
doi: 10.1126/sciimmunol.adi4191. Epub 2024 May 10.

A lactate-SREBP2 signaling axis drives tolerogenic dendritic cell maturation and promotes cancer progression

Affiliations

A lactate-SREBP2 signaling axis drives tolerogenic dendritic cell maturation and promotes cancer progression

Michael P Plebanek et al. Sci Immunol. .

Abstract

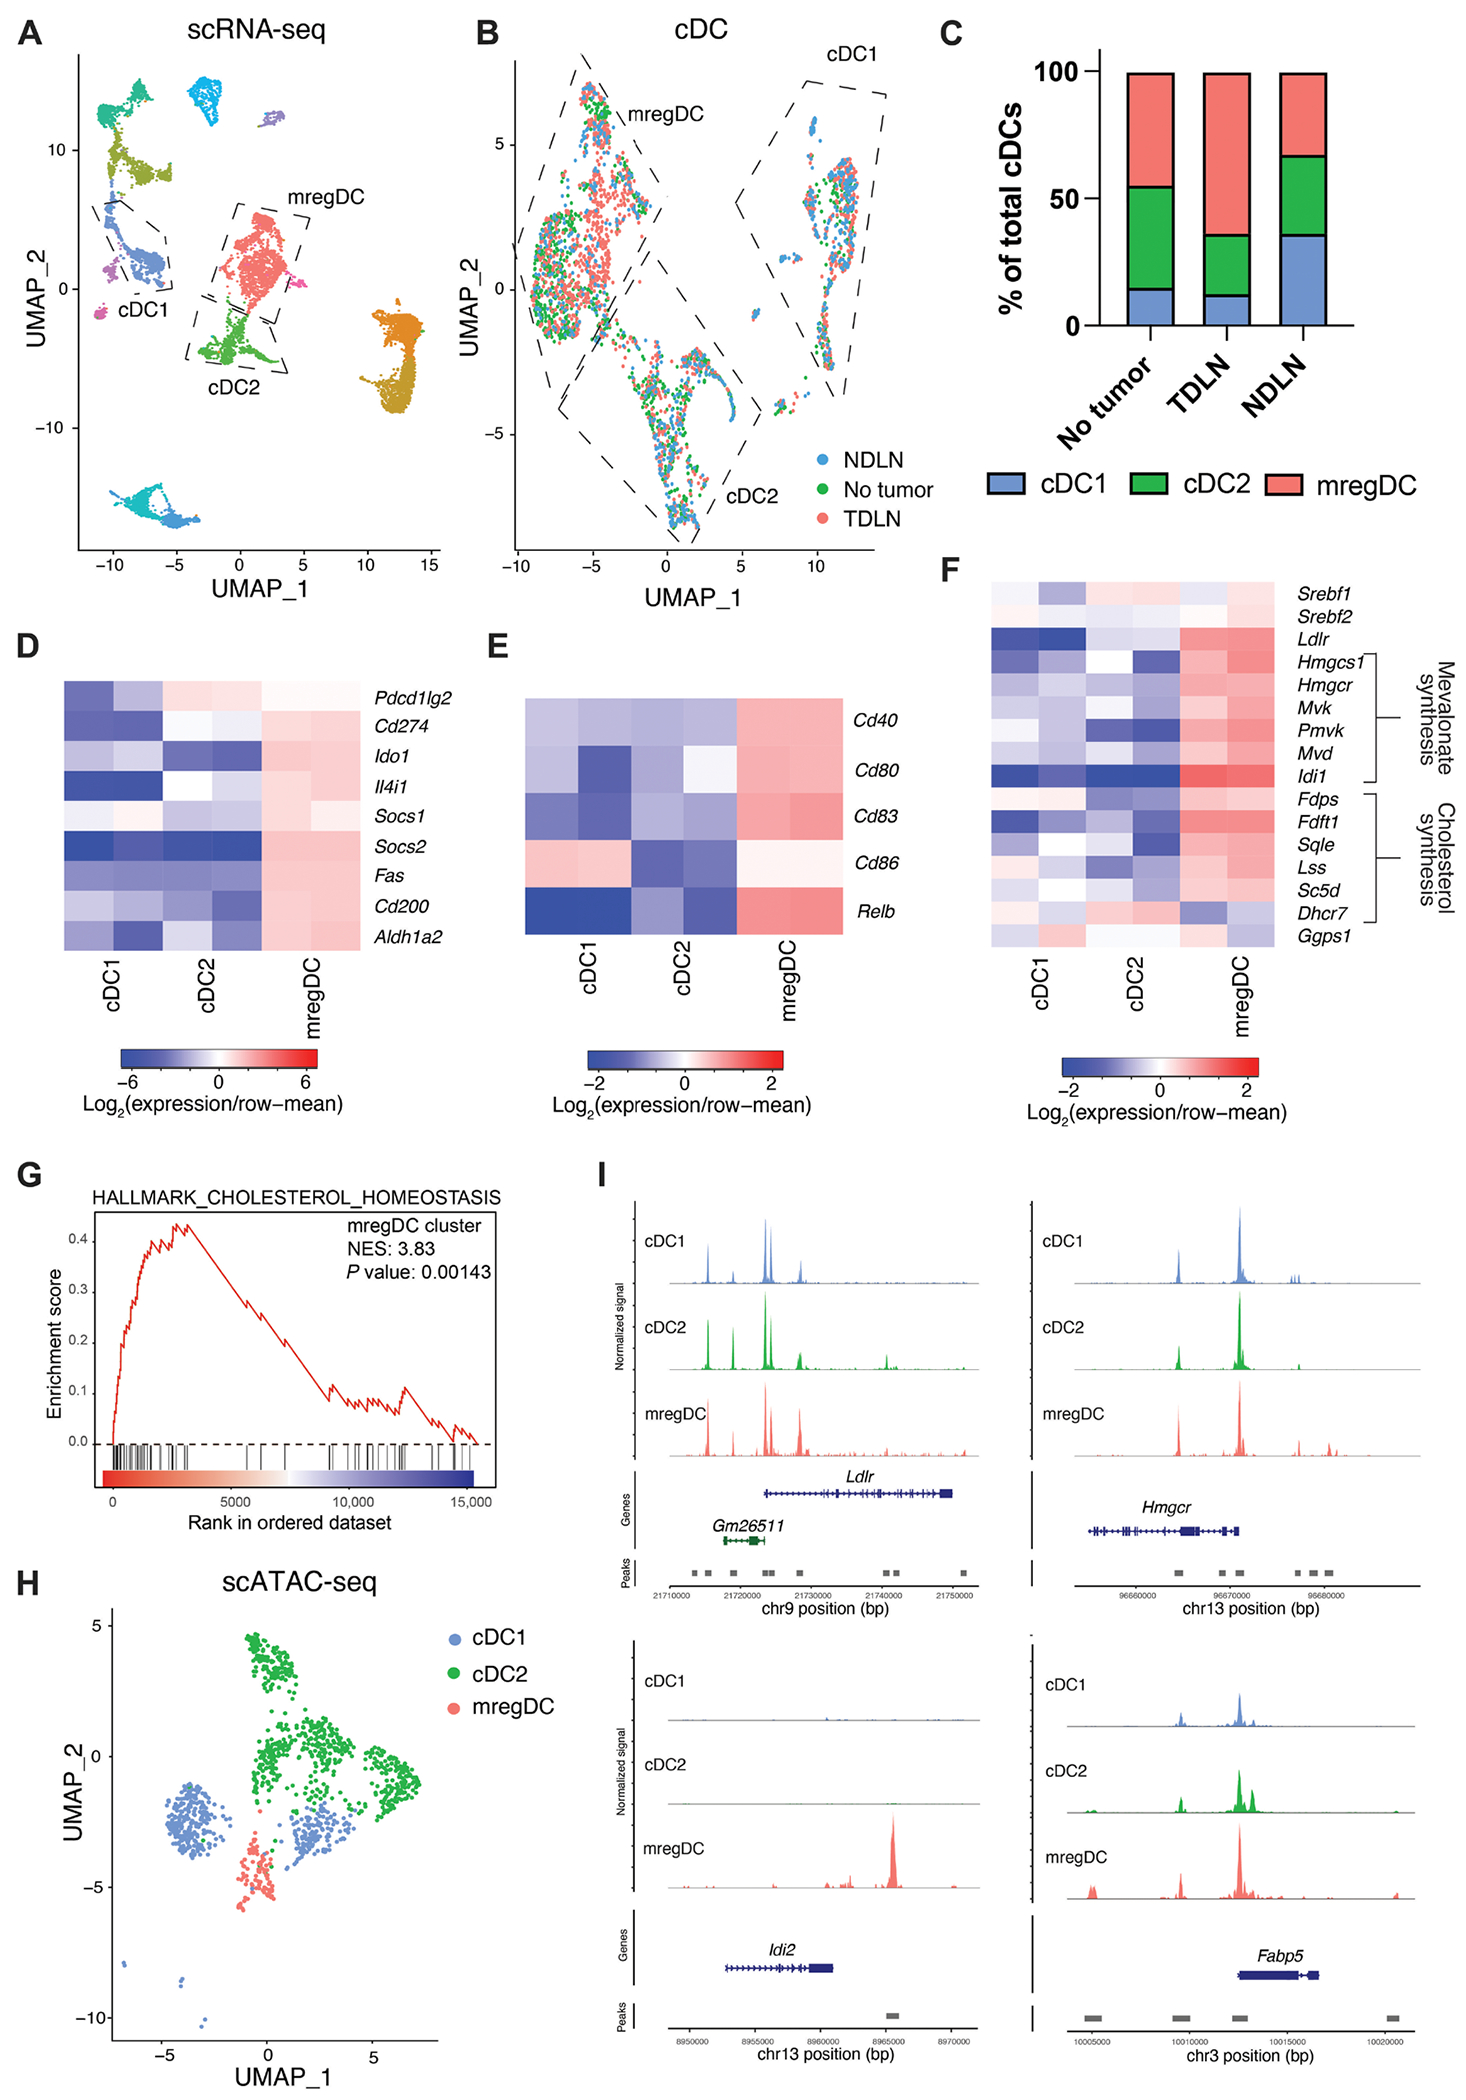
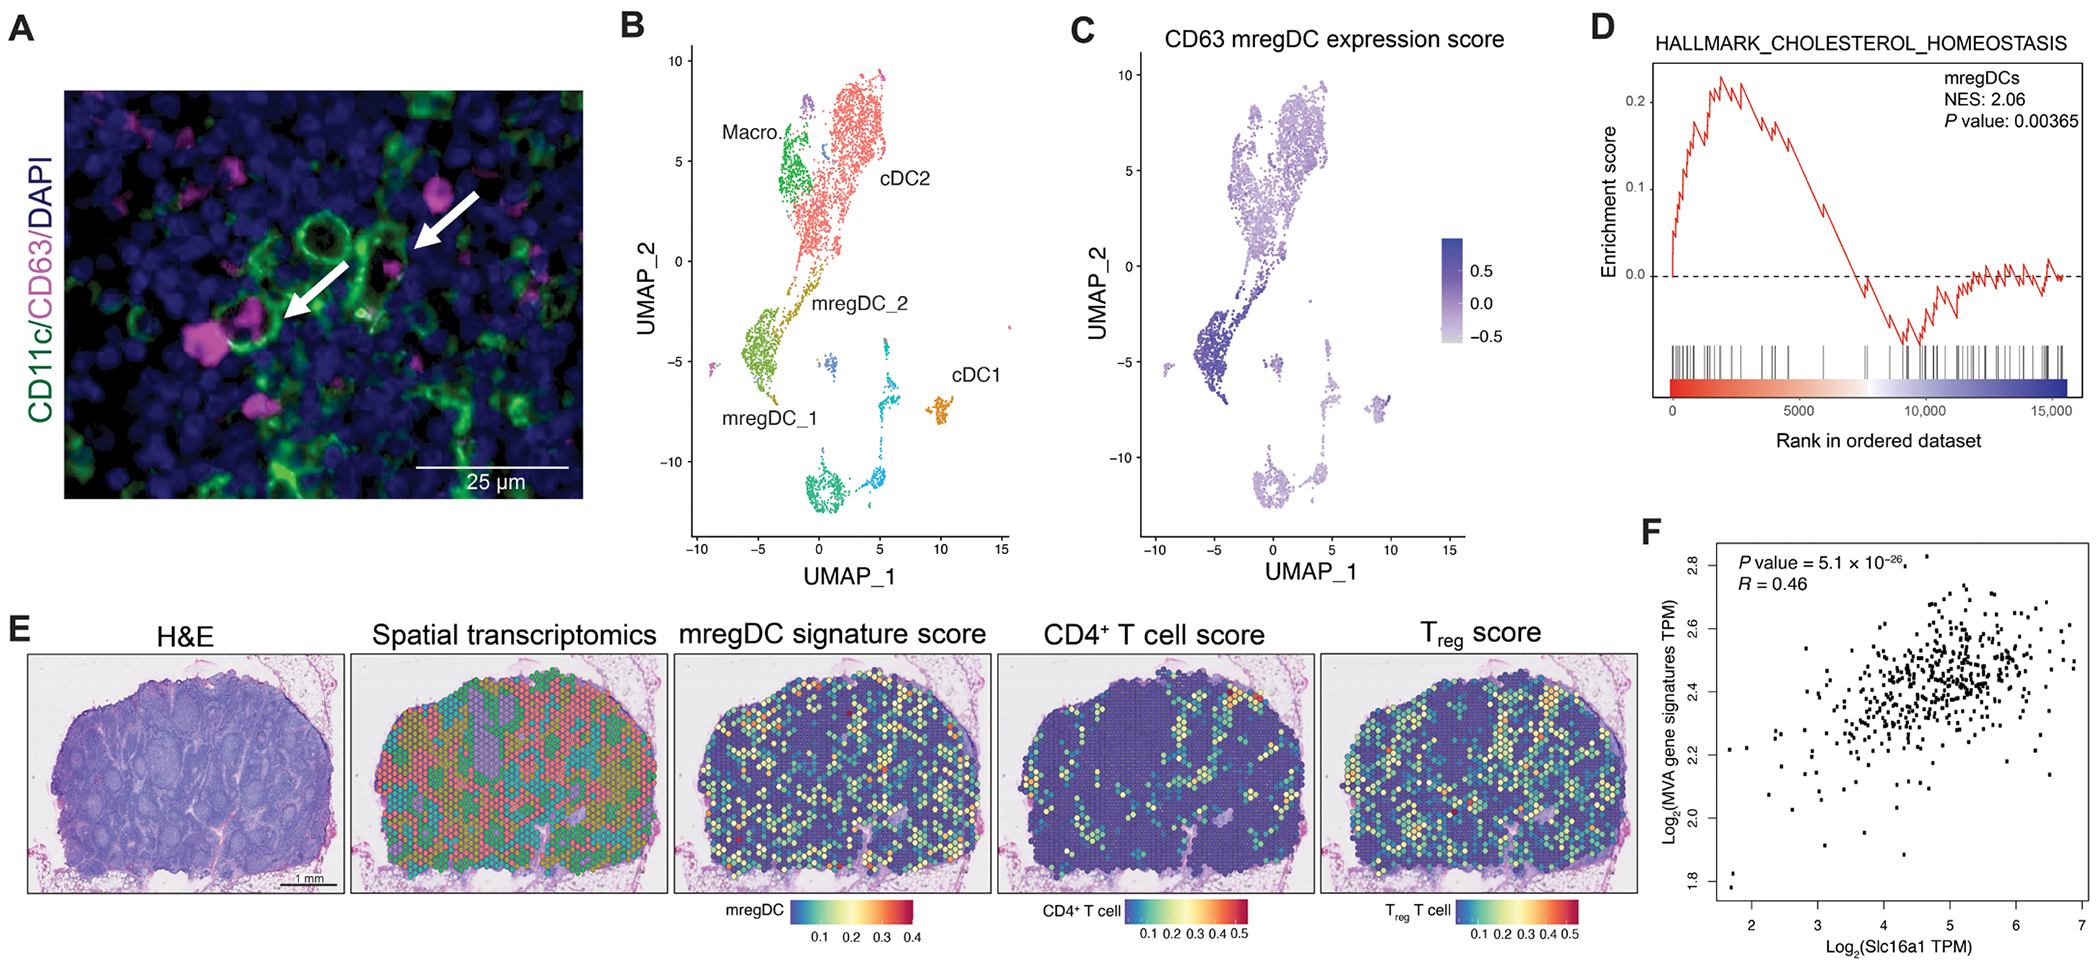
Conventional dendritic cells (DCs) are essential mediators of antitumor immunity. As a result, cancers have developed poorly understood mechanisms to render DCs dysfunctional within the tumor microenvironment (TME). After identification of CD63 as a specific surface marker, we demonstrate that mature regulatory DCs (mregDCs) migrate to tumor-draining lymph node tissues and suppress DC antigen cross-presentation in trans while promoting T helper 2 and regulatory T cell differentiation. Transcriptional and metabolic studies showed that mregDC functionality is dependent on the mevalonate biosynthetic pathway and its master transcription factor, SREBP2. We found that melanoma-derived lactate activates SREBP2 in tumor DCs and drives conventional DC transformation into mregDCs via homeostatic or tolerogenic maturation. DC-specific genetic silencing and pharmacologic inhibition of SREBP2 promoted antitumor CD8+ T cell activation and suppressed melanoma progression. CD63+ mregDCs were found to reside within the lymph nodes of several preclinical tumor models and in the sentinel lymph nodes of patients with melanoma. Collectively, this work suggests that a tumor lactate-stimulated SREBP2-dependent program promotes CD63+ mregDC development and function while serving as a promising therapeutic target for overcoming immune tolerance in the TME.


Conflict of interest statement

B.A.H. receives research funding from Merck & Co., Tempest Therapeutics, Lyell Therapeutics, and Iovance Therapeutics; is a consultant for Compugen and Amgen; and receives honoraria from HMP Education. G.M.B. receives research funding from Istari Oncology, Delcath, Oncosec Medical, Replimmune, and Checkmate Pharmaceuticals. The other authors declare that they have no competing interests.

Figures

Fig. 1.
Fig. 1.. Single-cell transcriptomics identifies a cDC subset enriched for expression of immunosuppressive and MVA pathway genes.
(A to G) scRNA-seq performed on CD11c+MHCIIhi DCs sorted by FACS from the TDLNs and NDLNs of BRAFV600E PTEN−/− melanoma–bearing mice at 5 weeks of tumor development and the inguinal LNs of control nontumor-bearing mice (n = 2 independent experiments, one mouse per experiment, ~3000 cells per sample). (A) UMAP plot demonstrating clustering of DC subpopulations. Note that other clusters represent populations of B cells and macrophages. (B) UMAP plot after reclustering of cDCs showing the proportion of DCs in each sample. (C) cDC1, cDC2, and mregDC clusters as a percentage of cDCs in the TDLNs or NDLNs of melanoma-bearing mice and LNs of nontumor-bearing controls. (D to F) Heatmaps of cDC subset differential gene expression: (D) Key immunosuppressive genes, (E) DC maturation genes, and (F) MVA pathway genes. (G) GSEA of the Hallmark Cholesterol Homeostasis gene set in mregDCs relative to total DCs. (H and I) scATAC-seq performed on DCs sorted by FACS from the TDLNs of BRAFV600E PTEN−/− melanoma–bearing mice at 5 weeks of tumor development (n = 2 independent experiments, one mouse per experiment, ~3000 cells per sample). (H) scATAC-seq UMAP plot demonstrating clustering of cDCs. (I) Chromatin accessibility tracks near the Ldlr, Hmgcr, Idi2, and Fabp5 genes in cDCs. All data are representative of two or three independent experiments. NES, normalized enrichment score.
Fig. 2.
Fig. 2.. The tetraspanin CD63 is a marker of conventional mregDCs.
(A) Tetraspanin Cd63 gene expression overlaid on the UMAP plots generated in Fig. 1A (n = 2 independent experiments). (B) Violin plot showing gene expression of Cd63 by cDC subsets in the scRNA-seq dataset (n = 2 independent experiments). (C) Flow cytometry strategy to sort CD63+ DCs from LNs of tumor-bearing mice (representative of n = 5). (D) Ratio of SIRPα+ cells to XCR1+ cells in CD63 and CD63+ DC subsets at 5 weeks after tumor induction (n = 4). (E and F) qPCR of FACS-sorted CD63+ or CD63 DCs at 5 weeks after tumor induction: (E) Key genes highly expressed in the mregDC scRNA-seq cluster and (F) MVA pathway genes (n = 3). (G) Flow cytometry histograms demonstrating the expression of specific surface proteins from the mregDC scRNA-seq cluster (representative of n = 4). (H and I) Flow cytometry quantification of the percent of: (H) CD63+ DCs or (I) XCR1+ cDC1s in the TDLNs, the NDLNs, and the tumors of BRAFV600E PTEN−/− melanoma–bearing mice. Percentage of CD63+ DCs in the LNs of tumor naïve mice shown as a reference (n = 6). (J) Flow cytometry analysis of CD45.1+ DCs in the TDLN after intratumoral injection of isolated CD45.1+CD63 DCs into BRAFV600EPTEN−/− melanomas of CD45.2+ hosts (n = 4). (D to F) Group comparisons were analyzed using unpaired t tests. (H and I) Statistical analysis was performed by a one-way ANOVA followed by Tukey’s multiple comparisons test. All data presented as a mean value ± SEM. All data are representative of two or three independent experiments. *P < 0.05, **P < 0.005, and ***P < 0.0005. PE, phycoerythrin; FITC, fluorescein isothiocyanate.
Fig. 3.
Fig. 3.. CD63+ DCs suppress CD8+ T cells and promote Treg differentiation.
(A to D) T cell proliferation assays with carboxyfluorescein diacetate succinimidyl ester (CFSE)–labeled OTI T cells cocultured with antigen-pulsed DCs. (A) Coculture of OTI CD8+ T cells with either CD63 DCs or CD63+ mregDCs isolated from the TDLNs of mice bearing OVA-expressing BRAFV600EPTEN−/− melanomas 3 weeks after tumor implantation (5:1 T cells:DC). Left: Schematic of experiment. Right: Flow cytometry plots and quantification (n = 4). (B) Coculture of OTI CD8+ T cells with OVA-pulsed DCs and increasing numbers of CD63+ mregDCs. Left: Schematic of experiment. Right: Flow cytometry plots and quantification (n = 4). (C) Coculture of OTI CD8+ T cells with OVA-pulsed DCs in the bottom chamber of a 0.4-μm transwell. Ratios of CD63+:CD63 DCs ranging from 1 × 10⁴:0 to 0:1 × 10⁴ in upper chamber while maintaining the same total cell number across conditions. (D) cDCs were pulsed with OVA and coincubated with OTI CD8+ T cells in the presence or absence of CD63+ mregDCs or control CD63 DCs ± anti-PCSK9 antibody. (E) Intracellular staining of IL-4 in CD4+ T cells after coculture with CD63+ or CD63 DCs (T cell:DC ratio, 5:1) (n = 4). (F) MHCII-OVA323–329 tetramer staining of CD4+ T cells after coculture with CD63+ or CD63 DCs isolated from OVA-expressing melanoma-bearing mice (T cell:DC ratio, 5:1) (n = 5). (G) Flow cytometry plots (left) and quantification (right) of Foxp3-expressing Tregs after coculture of allogeneic CD63 or CD63+ DCs (H-2d) with naïve CD4+ T cells isolated from Foxp3-GFP mice (H-2b) (T cell:DC ratio, 5:1) (n = 10). (H) Flow cytometry plots (left) and quantification (right) demonstrating the effect of the IDO1 inhibitor epacadostat on CD63+ DC-induced Treg differentiation (n = 5). All two-group comparisons were analyzed using unpaired t tests. (B and C) Statistical analysis was performed by one-way ANOVA followed by Dunnett’s multiple comparisons test. (D and H) Statistical analysis was performed by two-way ANOVA followed by Tukey’s multiple comparisons test. All data presented as a mean ± SEM. All data are representative of two or three independent experiments. *P < 0.05, **P < 0.005, and ***P < 0.0005. IgG, immunoglobulin G.
Fig. 4.
Fig. 4.. CD63+ mregDCs express a distinct genetic signature and can be divided into two subpopulations.
(A) UMAP plot showing a subset of the scRNA-seq data from Fig. 1 displaying only the cDC clusters. (B) Gene expression overlaid on UMAP plots showing Cd63 expression in cDC clusters from (A). (C) DC subset scores were generated from the top differentially expressed genes in the original clusters from Fig. 1 and applied to the different DC subpopulations comparing the mregDC subsets with cDC1 and cDC2. (D) Volcano plot displaying the differentially expressed genes between the mregDC1 and mregDC2 subpopulations. (E) UMAP plot displaying unsupervised clustering of CITE-seq of DCs sorted from the tumor, TDLN, and control LN at 5 weeks posttumor induction. Samples were integrated before dimensional reduction. Identification of each cluster is reported on right (n = 2, two mice per experiment, ~5000 cells per sample). (F) Cell surface protein expression of CD63, XCR1, and CD172a (SIRPa) as identified by CITE-seq. Boxes represent mregDC population. (G) Quantification of the DC subpopulations identified in (E) as percent of the total DCs in each condition. (H) Left: Flow cytometry plots of CD45.1+ CD63+ DCs after intratumoral injection of (top) CD45.1+ cDC1s or (bottom) CD45.1+ cDC2s into CD45.2+ hosts. Right: Quantification of the percent CD45.1+CD63+ DCs of the total DCs after intratumoral injection of CD45.1+ cDC1 or cDC2 3 days after DC transfer (n = 8). Data were analyzed using unpaired t test. All data presented as a mean ± SEM. All data are representative of two independent experiments. *P < 0.05.
Fig. 5.
Fig. 5.. CD63+ mregDCs are metabolically distinct from other DCs.
(A) Quantification of cDC neutral lipid content based on BODIPY 493/503 flow cytometry at 5 weeks posttumor induction (n = 5 control LN, n = 4 TDLN and tumor). (B) Quantification of lipid peroxidation based on BODIPY 581/591 C11 flow cytometry (n = 5 control LN, n = 4 TDLN and tumor). (C) Transcriptional analysis of key metabolic genes in cDC subpopulations derived from the scRNA-seq analysis in Fig. 1 (n = 2 independent experiments). (D) SCENITH assay analysis of cDC subpopulations (n = 4). (E) Flow cytometry quantification of FAOblue staining in cDCs. Data normalized to cDC1 FAOblue MFI (n = 5). Statistical analysis was performed by one-way ANOVA followed by Tukey’s multiple comparisons test. Data presented as a mean ± SEM. All data are representative of at least two independent experiments. *P < 0.05, **P < 0.005, and ***P < 0.0005. AA, amino acid.
Fig. 6.
Fig. 6.. SREBP2 supports the development of CD63+ mregDCs and promotes tumor growth.
(A) Flow cytometry of TDLN-derived CD63+ or CD63 DCs cocultured with FoxP3-GFP naïve CD4+ T cells pretreated with fatostatin or vehicle control (n = 3). (B) Flow cytometry CFSE proliferation assay after OVA-pulsed CD63+ DCs sorted from the TDLN and then cocultured with naïve OTI CD8+ T cells ± fatostatin, simvastatin, or GGTI-2147 (n = 5). (C) Tumor growth curves in BRAFV600EPTEN−/− melanoma mice treated with fatostatin, anti–PD-1 antibody, combination therapy, or vehicle controls (n = 11 or 12 per group). (D and E) Flow cytometry quantification of immune cell populations within TDLN/tumor tissues of mice 32 days after initiation of treatment in (C). (D) Quantification of CD63+ mregDCs in TDLN and tumor. (E) Quantification of intratumoral Foxp3+ Tregs and CD8+ T cells. (F) Extracellular flux analysis measuring OCR of bone marrow–derived DCs derived from CD11c-SREBF2−/− and control SREBF2fl/fl hosts (n = 5). (G) Flow cytometry quantification of FAOblue staining of DCs isolated from the TDLNs of CD11c-SREBF2−/− and control SREBF2fl/fl mice (n = 4). (H) Flow cytometry quantification of BODIPY493/503 staining of TDLN cDCs isolated from CD11c-SREBF2−/− and control SREBF2fl/fl hosts 4 weeks after tumor implantation (n = 5). (I) Flow cytometry surface quantification of H-2Kb MHC class I surface expression by cDCs isolated from TDLNs of CD11c-SREBF2−/− and SREBF2fl/fl control mice 4 weeks after tumor implantation (n = 4). (J) Flow cytometry CFSE proliferation assay after OVA-pulsed DCs derived from TDLNs of CD11c-SREBF2−/− and SREBF2fl/fl control mice harboring OVA-expressing BRAFV600EPTEN−/− melanomas isolated 3 weeks after tumor implantation cocultured with naïve OTI CD8+ T cells (n = 4). (K) Tumor growth curves of BRAFV600EPTEN−/− melanomas in CD11c-SREBF2−/− and SREBF2fl/fl hosts (n = 12). (L and M) Flow cytometry quantification of tumor and TDLN immune cell populations in CD11c-SREBF2−/− and SREBF2fl/fl hosts isolated 25 days after tumor implantation. (L) Quantification of DC subtypes in the TDLN and tumor. (M) Quantification of tumor-infiltrating CD4+ T cells, Foxp3+CD4+ Tregs, KLRG1+ Tregs, and CD8+ T cells (n = 9 to 11). (N) CD11c-SREBF2−/− mice and their SREBF2fl/fl controls were implanted with BRAFV600EPTEN−/−CDKN2A−/− melanoma cells. H&E and S100β IHC microscopy to quantify micrometastases 4 weeks after tumor implantation. (A and C to E) Statistical analysis was performed by two-way ANOVA followed by either a Tukey’s or Šidák’s multiple comparisons test. (B) Statistical analysis was performed by one-way ANOVA followed by Dunnett’s multiple comparison test. (G to N) All two-group comparisons were analyzed using unpaired t tests. Data are shown as mean ± SEM. *P < 0.05, **P < 0.005, and ***P < 0.0005.
Fig. 7.
Fig. 7.. Tumor-derived lactate promotes SREBP2 activation in the TME.
(A) Western blot showing activation and nuclear localization of SREBP2 after treatment of bone marrow–derived DCs with lactate for 24 hours (pH 6.8). (B) qRT-PCR of bone marrow–derived DC SREBP2 target genes, Ldlr, Hmgcs1 Hmgcr, Mvk, and Idi1, isolated from CD11c-SREBF2−/− mice or littermate SREBF2fl/fl controls after treatment with lactate (pH 6.8) or under normal conditions (pH 7.4) (n = 4). (C) Left: Tumor growth curves of BRAFV600EPTEN−/− melanomas with CRISPR-Cas9–mediated knockout of Slc16a1 or non-edited controls (Vec). Right: Growth curves showing individual tumor progression (n = 6). (D) Left: Flow cytometry of CD63+ mregDCs infiltrating the TDLN in mice bearing BRAFV600EPTEN−/−Slc16a1−/− or non-edited control BRAFV600EPTEN−/− melanoma tumors 24 days after tumor implantation. Right: Quantification of the percent of CD63+ mregDCs in the TDLN and the number of CD63+ mregDCs in the tumor (n = 6). (E) qRT-PCR of SREBP2 target genes in CD63+ mregDCs sorted from BRAFV600EPTEN−/−Slc16a1−/− or non-edited control BRAFV600EPTEN−/− melanoma tumors (pSCAR-scr: n = 7, pSCAR-Slc16a1: n = 6). (F) Flow cytometry of splenic cDCs demonstrating the MHC class I surface expression after ex vivo treatment with lactate (pH 6.8) or lactate and fatostatin. (G) Tumor growth curves of BRAFV600EPTEN−/−Slc16a1−/− or vector control cells, Slc16a1WT/WT, implanted into CD11c-SREBF2−/− mice or littermate SREBF2fl/fl controls (n = 5). All two-group comparisons were analyzed using unpaired t tests. (B, F, and G) Statistical analysis performed by two-way ANOVA followed by Tukey’s multiple comparisons test. Data are shown as mean ± SEM with individual data points. All data are representative of two or three independent experiments. *P < 0.05, **P < 0.005, and ***P < 0.0005. A.U., arbitrary units.
Fig. 8.
Fig. 8.. CD63+ DCs are present in human melanoma tumors.
(A) Immunofluorescence staining of CD63 (magenta, cytoplasmic) and CD11c (green, membrane surface) in sentinel LN sections isolated from patients with melanoma (n = 3 independent experiments from 12 patients). White arrows, CD63+CD11c+ cells. (B) scRNA-seq UMAP plot demonstrating clustering of DC subpopulations sorted from the sentinel LNs of patients with melanoma (n = 3 independent experiments from three patients). (C) CD63+ mregDC expression score generated in Fig. 4 applied to the human melanoma scRNA-seq UMAP plot. (D) GSEA of the Hallmark Cholesterol Homeostasis gene set in human mregDCs relative to total DCs. (E) Visium spatial transcriptomic analysis of sentinel LN tissues harvested from patients with melanoma. Left: H&E staining of sentinel LN tissue. Middle: Visium spots overlaid on H&E image. Right: mregDC expression score, CD4+ T cell score, and Treg score overlaid on the Visium spatial transcriptomics spot map demonstrating the presence of mregDCs in human patients with melanoma (n = 3 independent experiments from three patients). (F) Correlation of Sl16a1 (MCT1) with MVA genes in patients with melanoma from the TCGA dataset. Significance was determined using Spearman’s correlation. DAPI, 4′,6-diamidino-2-phenylindole; TPM, transcripts per million.

References

    1. Wculek SK, Cueto FJ, Mujal AM, Melero I, Krummel MF, Sancho D, Dendritic cells in cancer immunology and immunotherapy. Nat. Rev. Immunol 20, 7–24 (2020). - PubMed
    1. Gardner A, Ruffell B, Dendritic cells and cancer immunity. Trends Immunol. 37, 855–865 (2016). - PMC - PubMed
    1. Salmon H, Idoyaga J, Rahman A, Leboeuf M, Remark R, Jordan S, Casanova-Acebes M, Khudoynazarova M, Agudo J, Tung N, Chakarov S, Rivera C, Hogstad B, Bosenberg M, Hashimoto D, Gnjatic S, Bhardwaj N, Palucka AK, Brown BD, Brody J, Ginhoux F, Merad M, Expansion and activation of CD103+ dendritic cell progenitors at the tumor site enhances tumor responses to therapeutic PD-L1 and BRAF inhibition. Immunity 44, 924–938 (2016). - PMC - PubMed
    1. Broz ML, Binnewies M, Boldajipour B, Nelson AE, Pollack JL, Erle DJ, Barczak A, Rosenblum MD, Daud A, Barber DL, Amigorena S, Van’t Veer LJ, Sperling AI, Wolf DM, Krummel MF, Dissecting the tumor myeloid compartment reveals rare activating antigen-presenting cells critical for T cell immunity. Cancer Cell 26, 938 (2014). - PubMed
    1. Garris CS, Arlauckas SP, Kohler RH, Trefny MP, Garren S, Piot C, Engblom C, Pfirschke C, Siwicki M, Gungabeesoon J, Freeman GJ, Warren SE, Ong S, Browning E, Twitty CG, Pierce RH, Le MH, Algazi AP, Daud AI, Pai SI, Zippelius A, Weissleder R, Pittet MJ, Successful anti-PD-1 cancer immunotherapy requires T cell-dendritic cell crosstalk involving the cytokines IFN-γ and IL-12. Immunity 49, 1148–1161.e7 (2018). - PMC - PubMed

Publication types

Substances