. 2024 Jul:121:102894.
doi: 10.1016/j.ceca.2024.102894. Epub 2024 May 4.

The dynamic TRPV2 ion channel proximity proteome reveals functional links of calcium flux with cellular adhesion factors NCAM and L1CAM in neurite outgrowth

Affiliations

The dynamic TRPV2 ion channel proximity proteome reveals functional links of calcium flux with cellular adhesion factors NCAM and L1CAM in neurite outgrowth

Pamela N Gallo et al. Cell Calcium. 2024 Jul.

Abstract

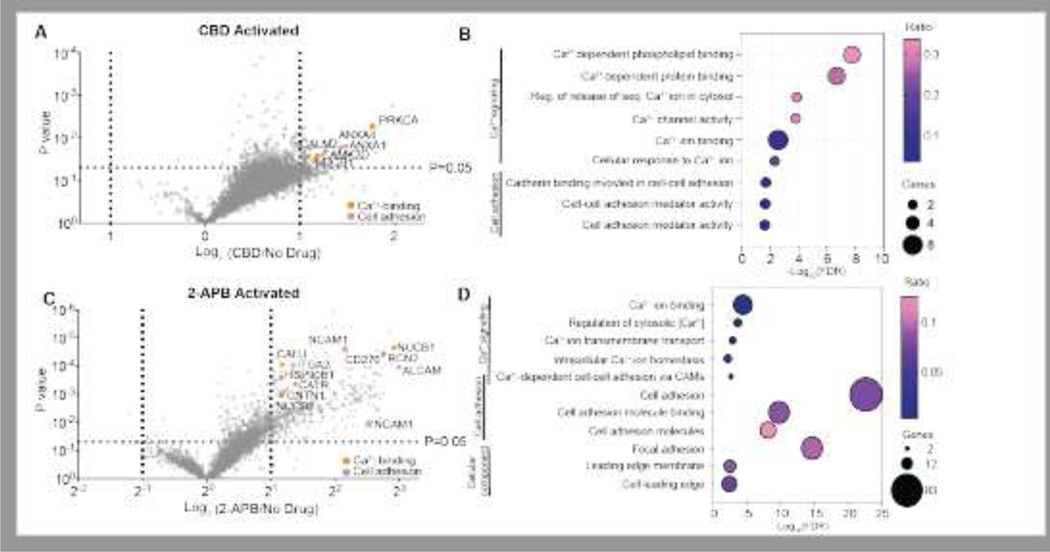
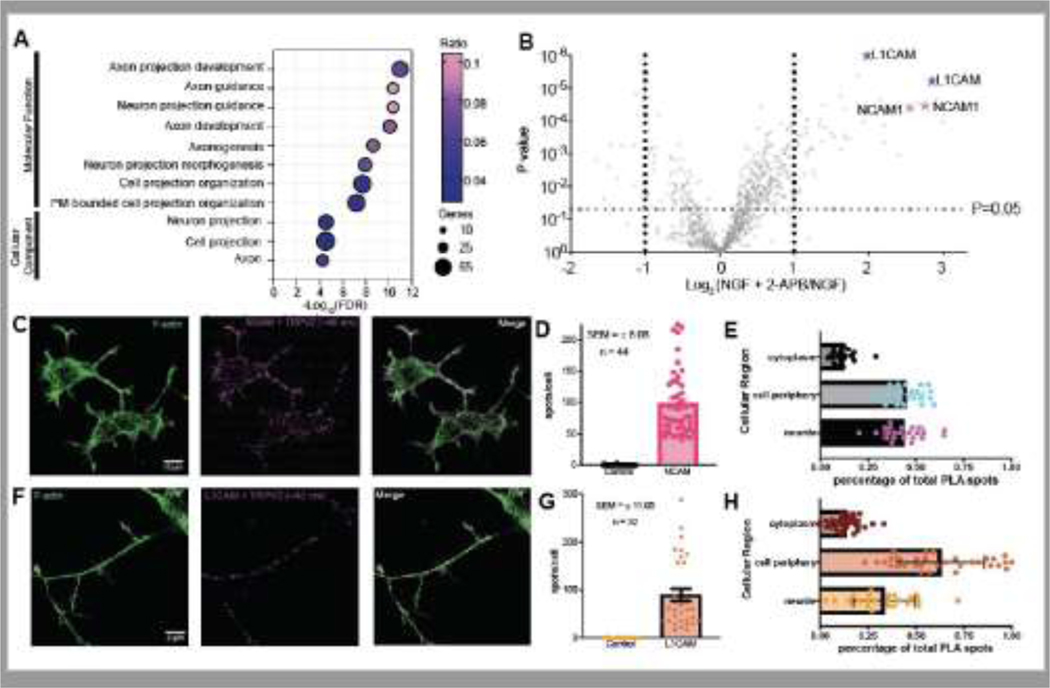
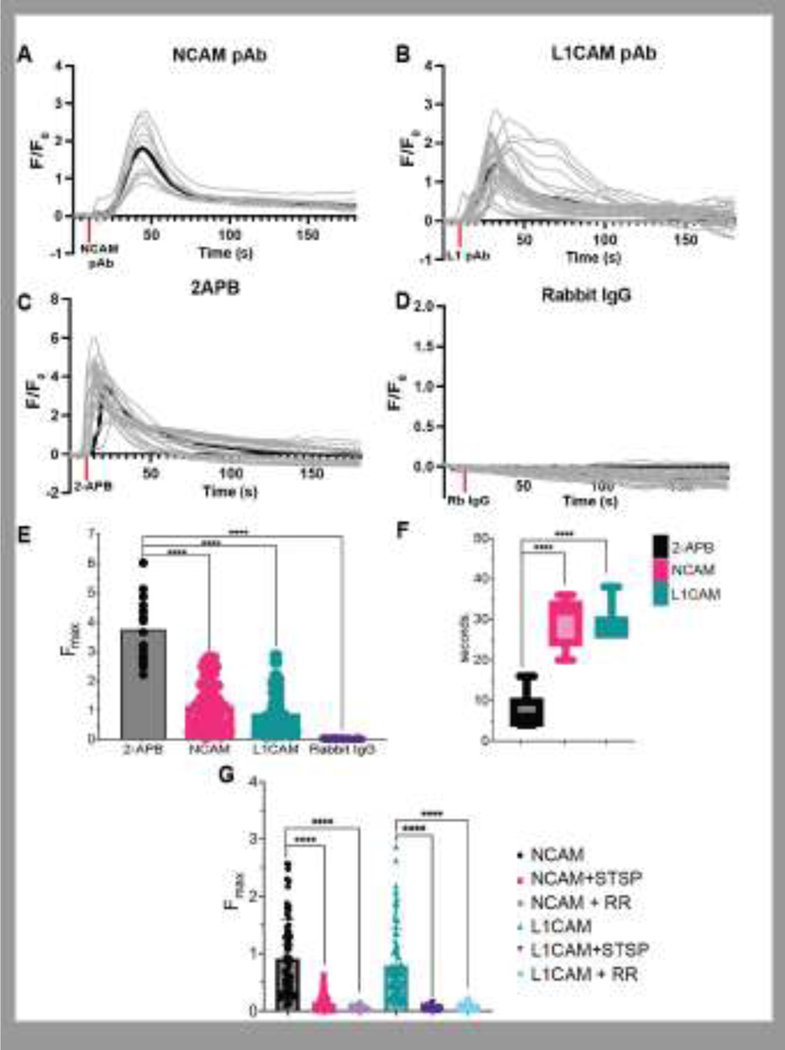
TRPV2 voltage-insensitive, calcium-permeable ion channels play important roles in cancer progression, immune response, and neuronal development. Despite TRPV2's physiological impact, underlying endogenous proteins mediating TRPV2 responses and affected signaling pathways remain elusive. Using quantitative peroxidase-catalyzed (APEX2) proximity proteomics we uncover dynamic changes in the TRPV2-proximal proteome and identify calcium signaling and cell adhesion factors recruited to the molecular channel neighborhood in response to activation. Quantitative TRPV2 proximity proteomics further revealed activation-induced enrichment of protein clusters with biological functions in neural and cellular projection. We demonstrate a functional connection between TRPV2 and the neural immunoglobulin cell adhesion molecules NCAM and L1CAM. NCAM and L1CAM stimulation robustly induces TRPV2 [Ca2+]I flux in neuronal PC12 cells and this TRPV2-specific [Ca2+]I flux requires activation of the protein kinase PKCα. TRPV2 expression directly impacts neurite lengths that are modulated by NCAM or L1CAM stimulation. Hence, TRPV2's calcium signaling plays a previously undescribed, yet vital role in cell adhesion, and TRPV2 calcium flux and neurite development are intricately linked via NCAM and L1CAM cell adhesion proteins.

Keywords: APEX; L1CAM; NCAM; Neurite outgrowth; Proximity proteomics; TRPV2.


Conflict of interest statement

Declaration of competing interest The authors have no competing interests to declare.

Figures

Figure 1
Figure 1
(A) Volcano plot representing all the proteins identified by CBD-activated or (C) 2-APB activated TRPV2-APEX2 proximity proteomics. Obtained P-values are represented on the Y-axis and the fold change between the no drug condition and pharmacologically stimulated condition is represented in Log2 on the X-axis. Proteins are considered statistically significant if they have a fold change ≥ 2 and a p-value ≤ 0.05. Specific proteins of interest are highlighted and categorized according to the corresponding graph legend. (B) Bubble plot representing the significantly enriched gene ontology terms identified from the proteins with increased association to TRPV2 following activation by CBD and (D) 2-APB. The x-axis represents the -Log10 of the p-value from the false discovery rate (FDR) for each term identified. The size of the bubble correlates to the number of proteins within that term and the color represents the ratio of the proteins identified to belong to a term in the data set over the total annotation count of the terms.
Figure 2
Figure 2
(A) PC12 cells stained with F-actin (green, left) and probed for locations where TRPV2 and PKCα or (D) calmodulin (CaM) are within a 40 nm proximity represented as bright puncta (magenta, middle). The images are then merged (right) to observe localization of the puncta with respect to the cytoskeleton of the cell membrane. (B) Bar graph comparing the PLA spots observed in the control samples and the test samples for PKCα or (E) CaM. (C) Bar graph representing the cellular distribution of the observed PLA puncta for PKCα or (F) CaM.
Figure 3
Figure 3
(A) Bubble plot representing the significantly enriched gene ontology terms associated with neural development and cellular projections observed in the 2-APB activated TRPV2-APEX2 HEK 293 cells. The x-axis represents the -Log10 of the p-value from the false discovery rate (FDR) for each term identified. The size of the bubble correlates to the number of proteins within that term and the color represents the ratio of the proteins identified to belong to a term in the data set over the total annotation count of the terms. (B) Volcano plot representing all the proteins identified by 2-APB activated TRPV2-APEX2 proximity proteomics in PC12 cells. Obtained P-values are represented on the Y-axis and the fold change between the no drug condition and pharmacologically stimulated condition is represented in Log2 on the X-axis. Proteins are considered statistically significant if they have a fold change ≥ 2 and a p-value ≤ 0.05. Specific proteins of interest are highlighted. (C) PC12 cells stained with F-actin (green, left) and probed for locations where TRPV2 and NCAM or (F) L1CAM are within a 40 nm proximity represented as bright puncta (magenta, middle). The images are then merged (right) to observe localization of the puncta with respect to the cytoskeleton of the cell membrane. (D) Bar graph comparing the PLA spots observed in the control samples and the test samples for NCAM or (G) L1CAM. (E) Bar graph representing the cellular distribution of the observed PLA puncta for NCAM or (H) L1CAM.
Figure 4
Figure 4
Calcium flux curves collected from TRPV2-GCaMP PC12 cells stimulated with (A) 200 ng/mL NCAM pAb, (B) 200 ng/mL L1CAM pAb, (C) 300 μM 2-APB, and (D) 100 ng/mL Rabbit IgG (control) were introduced to the TRPV2-GCaMP PC12 cells and the fluorescent signal at 488 was recorded over time. Curves are plotted as the change (Δ) in fluorescent reading at a time point divided by the background fluorescence (F/F0) over the three minutes that the fluorescent calcium signals were recorded. The addition of antibody or drug at 10 seconds is indicated by a red bar on the x-axis. Each line represents a singular region of interest within the TRPV2-GCaMP PC12 cells. Data from at least two biological replicates were included in each calcium flux curve. Calcium flux data was collected using TRPV2-GCaMP PC12 cells. (E) The peak values (Fmax) were obtained from each region of interest selected from the 200 ng/mL NCAM pAb, 200 ng/mL L1CAM pAb, 300 μM 2-APB, and 100 ng/mL Rabbit IgG (control) calcium movies and plotted. (F) The time in seconds of when the peak value (Fmax) for each region of interest was reached was plotted. (G) The peak values (Fmax) obtained for NCAM or L1CAM calcium flux are compared to the Fmax of the staruosporine or Ruthenium red treated samples.
Figure 5
Figure 5
(A) This bar graph represents the lengths of the neurite compared over time between WT PC12 cells, TRPV2OE PC12 cells, and DN-TRPV2 PC12 cells. The time scale represents the time in hours after neurites and axons were stripped from the PC12 cells. (B) The neurite lengths of WT PC12 cells, (C) TRPV2OE PC12 cells, or (D) DN-TRPV2 PC12 cells are compared between no stimulation, NCAM polyclonal antibody incubated, and L1CAM polyclonal antibody incubated represented as a bar graph. The time scale represents the time in hours after neurites and axons were stripped from the PC12 cells. Control cells were not given antibody and were only axotomized.

References

    1. Shibasaki K, Murayama N, Ono K, Ishizaki Y. & Tominaga M. TRPV2 Enhances Axon Outgrowth through Its Activation by Membrane Stretch in Developing Sensory and Motor Neurons. Journal of Neuroscience 30, 4601–4612 (2010). - PMC - PubMed
    1. Cohen MR et al. Nerve Growth Factor Regulates Transient Receptor Potential Vanilloid 2 via Extracellular Signal-Regulated Kinase Signaling To Enhance Neurite Outgrowth in Developing Neurons. Mol Cell Biol 35, 4238–4252 (2015). - PMC - PubMed
    1. Kato S. et al. TRPV2 Promotes Cell Migration and Invasion in Gastric Cancer via the Transforming Growth Factor-β Signaling Pathway. Ann Surg Oncol 1–13 (2021) doi: 10.1245/S10434-021-11132-5/TABLES/2. - DOI - PubMed
    1. Oulidi A. et al. TRPV2 Mediates Adrenomedullin Stimulation of Prostate and Urothelial Cancer Cell Adhesion, Migration and Invasion. PLoS One 8, e64885 (2013). - PMC - PubMed
    1. Lévêque M. et al. Phagocytosis depends on TRPV2-mediated calcium influx and requires TRPV2 in lipids rafts: Alteration in macrophages from patients with cystic fibrosis. Sci Rep 8, (2018). - PMC - PubMed