. 2024 Jul 17;112(14):2386-2403.e6.
doi: 10.1016/j.neuron.2024.04.015. Epub 2024 May 9.

A latent pool of neurons silenced by sensory-evoked inhibition can be recruited to enhance perception

Affiliations

A latent pool of neurons silenced by sensory-evoked inhibition can be recruited to enhance perception

Oliver M Gauld et al. Neuron. .

Abstract

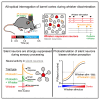
To investigate which activity patterns in sensory cortex are relevant for perceptual decision-making, we combined two-photon calcium imaging and targeted two-photon optogenetics to interrogate barrel cortex activity during perceptual discrimination. We trained mice to discriminate bilateral whisker deflections and report decisions by licking left or right. Two-photon calcium imaging revealed sparse coding of contralateral and ipsilateral whisker input in layer 2/3, with most neurons remaining silent during the task. Activating pyramidal neurons using two-photon holographic photostimulation evoked a perceptual bias that scaled with the number of neurons photostimulated. This effect was dominated by optogenetic activation of non-coding neurons, which did not show sensory or motor-related activity during task performance. Photostimulation also revealed potent recruitment of cortical inhibition during sensory processing, which strongly and preferentially suppressed non-coding neurons. Our results suggest that a pool of non-coding neurons, selectively suppressed by network inhibition during sensory processing, can be recruited to enhance perception.

Keywords: all-optical interrogation; behavior; cortex; optogenetics; sensory processing; sparse coding; two-photon imaging.


Conflict of interest statement

Declaration of interests The authors declare no competing interests.

Figures
Graphical abstract
Graphical abstract
Figure 1
Figure 1. A whisker-guided task for graded bilateral intensity discrimination
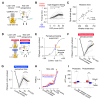
(A) Whisker discrimination task setup. The inset shows an image of cortex through a 3 mm cranial window implanted over S1. (B) Schematic of trial structure and trial outcome. (C) “Cross-fading” bilateral whisker deflection stimulus design. (D) Overview of symmetric (green) and asymmetric (orange) stimulus-reward contingencies. (E) Example session performance from a symmetric-trained mouse (left) and an asymmetric-trained mouse (right). Trials were delivered in a randomized order but were sorted along the y axis according to stimulus difference as in (C). Each row corresponds to a trial, and each marker corresponds to a lick. The first lick is colored red/blue for contra/ipsi choice. The inset shows the session psychometric curve. (F) Average psychometric performance for symmetric (green; n = 31 mice) and asymmetric (orange; n = 30 mice) trained mice. The left and right plots show spatial choice and perceptual choice tendency, respectively. (G) Average performance during matrix stimulus sessions. Left: average P(Report contra whisker) is shown across trial types with each square in the 5 × 5 grid representing a different combination of contra and ipsi input. Middle: behavioral data are replotted such that each row in the left behavioral matrix (corresponding to a different ipsi stimulus level) is now shown as a psychometric curve. Right: average miss rate is shown across stimuli. Group data in Figure 1 are shown as the mean across mice, with error bars representing SEM.
Figure 2
Figure 2. Optogenetic manipulation of barrel cortex during task performance
(A) Optogenetic “substitution” experiment schematic. (B) Perceptual fooling index on optogenetic stimulation trials. (C) Correlation between average reaction times on optogenetic stimulation trials (mean across 30 and 50 mW trials) and whisker trials. Each data point shows an individual session. (D) Schematic of photostimulation (red) and photoinhibition (blue) perceptual biasing experiments. (E) Optogenetic stimuli were paired with the bilateral whisker threshold stimulus (TS). (F) Behavioral performance during photostimulation biasing experiments. (G) Behavioral performance during photoinhibition biasing experiments. (H) Miss rate is shown across trial types during photostimulation (red) and photoinhibition (blue) experiments. (I) Optogenetic biasing of TS trial reaction time for photostimulation (left) and photoinhibition (right) experiments. The mean difference in RT on trials where mice reported the contralateral whisker choice vs. the ipsilateral whisker choice is shown as red and blue bars, respectively. Data in Figure 2 show the average across sessions as circular markers and SEM (shaded error bars). Data from individual sessions are shown as thin gray lines. All statistical tests were two-tailed Wilcoxon signed-rank tests * p < 0.05; ** p < 0.01; *** p < 0.001.
Figure 3
Figure 3. Characterization of task-evoked activity using two-photon calcium imaging
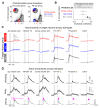
(A) Schematic of the delayed-response discrimination task. (B) Delay-task trial structure. The green shading denotes the window used to analyze neural activity. (C) Average psychometric performance during imaging sessions for symmetric (green) and asymmetric (orange) trained mice. (D) Regions of interest (ROIs) corresponding to neuronal somata in an example FOV colored by stimulus selectivity. (E) Heat-maps showing sorted single-trial fluorescence responses on unilateral contra (red) and ipsi (blue) whisker trials for 4 example neurons numbered in (D). (F) Quantification of the mean fraction of significant contra-coding (red) and ipsi-coding (blue) neurons per FOV. (G) Average trial-evoked fluorescence traces for contra-coding neuron ensembles (red) and ipsi-coding neuronal ensembles (blue) across stimulus trial types in (C). (H) Histogram showing the average distribution of stimulus-selectivity scores for contra-coding (red), ipsi-coding (blue), and stimulus-non-coding (gray) neurons. (I) Evoked response amplitude across trial types shown as a function of stimulus selectivity. Colors correspond to different trial types as in (C) and (G). (J) Average fluorescence traces in contra-coding ensembles on TS trials split by perceptual choice (top) and spatial choice (bottom). (K) Average choice probability (CP; top) and action probability (AP; bottom) scores in contra (red), ipsi (blue), and non-coding (gray) ensembles across the trial. Data in Figure 3 are from 52 sessions across 13 mice (30 sessions in 7 symmetric-trained mice; 4.3 ± 2.0 (mean ± SD) sessions per mouse, and 22 sessions in 6 asymmetric-trained mice; 3.7 ± 1.8 (mean ± SD) sessions per mouse). Neural ensemble data were first averaged within session and then presented as the mean ± SEM across sessions.
Figure 4
Figure 4. Two-photon photostimulation of L2/3 neurons during whisker discrimination
(A) SLM-targeted two-photon photostimulation (PS) of contra vs. ipsi-biased L2/3 ensembles. (B) Photostimulation was delivered simultaneously with the whisker threshold stimulus (TS). (C) Trial structure for paired sensory and photostimulation (TS + PS) trials. The green-shaded region shows the 2P imaging analysis window. (D) Photostimulation response maps showing the mean response 500–1,000 ms post-stimulus from an example session. Stimulation of the contra and ipsi target groups is shown on the left and right, respectively, with lightning bolts indicating the targeted locations. (E) Average pixel-wise PS response maps centered on all PS spiral sites for contra (top row) and ipsi (bottom row) SLM targets, on contra group stimulation trials (left column) and ipsi group stimulation trials (right column; average across 1,560 target sites across 52 session). (F) Average fluorescence traces from contra (red) and ipsi (blue) target neurons on photostimulation trials. The orange bar indicates the photostimulation duration, and the green bar shows the response analysis window. Data are averaged across 52 sets of target groups from 52 sessions across 13 mice; 1,992 activated target neurons in total. (G) Quantification of the number of target neurons activated by photostimulation during TS + PS trials. The colored marker shows the mean, and gray lines show individual session data. (H) Same as in (G), but showing quantification of the average stimulus selectivity across activated target groups. (I) Quantification of the number of suppressed vs. activated network followers during TS + PS trials. 52 sets of followers in 52 sessions; 13 mice; 1,299 activated and 2,078 suppressed follower neurons in total. Statistical comparisons were made across sessions with Wilcoxon signed-rank tests. * p < 0.05, ** p < 0.01; *** p < 0.001.
Figure 5
Figure 5. The number of activated target neurons predicts perceptual bias
(A) Quantification of average perceptual choice tendency during the targeted photostimulation experiment. (B) Comparison of perceptual bias and target group whisker selectivity. (C) Comparison of perceptual bias and the number of activated target neurons. (D) Comparison of perceptual bias and the net change in population activity. (E) Within-session differences across photostimulation conditions were compared by “mean-centering” the data points from each session. This procedure is shown with a single example session. The dashed lines on the left plot indicate the mean P(Report contra whisker) (horizontal) and target response (vertical) across the two conditions. (F) Correlation between within-session difference in the number of activated targets and perceptual bias across all mean-centered data points. Data points corresponding to the same session are joined with a thin line that passes through the origin. (G) The same as in (F) but split by sessions from symmetric (green; top) and asymmetric (orange; bottom) trained mice. (H) A multiple linear regression (MLR) model summarizing the relationship between target and network photostimulation predictors and within-session perceptual bias. Statistically significant predictors are shown with black markers, with error bars indicating 95% coefficient confidence intervals. Data in Figure 5 are from 52 sessions across 13 mice. Each data point represents an individual photostimulation condition (one for TS + PS contra trials and one for TS + PS ipsi trials), with a total of 104 data points. Total number of control TS trials = 2,374, total number of TS trials with PS = 2,403. In correlation plots, shaded error bars denote the 95% confidence bounds of a linear regression fit to the data (black line).
Figure 6
Figure 6. Photostimulation of non-coding neurons predicts perceptual bias
(A) Quantification of the number of contra-coding (red), ipsi-coding (blue), and whisker non-coding (gray) activated target neurons that made up the two photostimulation target groups. Individual lines show individual sessions. The inset circle charts indicate the average proportional group summary. (B) A multiple linear regression (MLR) model summarized the relationship between the number of photostimulated stimulus-coding and non-coding neurons and perceptual bias. Marker points shown the estimated coefficients with error bars indicating the 95% confidence intervals. (C) Trial-evoked activity traces from contra-coding (red), ipsi-coding (blue), and non-coding (gray) photostimulation target neurons are shown across different trial types. (D) The time course of average trial-evoked contralateral whisking (top), body movement (middle), and licking (bottom) behavioral measures are shown across trial types. The magenta histogram shows the distribution of mean reaction times assessed using videography. Note that during whisker stimulation (gray shading), we do not plot whisking traces as it is unclear which whisker movements are driven by the stimulus and which are the result of active movement. Data in Figure 6 are from 52 sessions in 13 mice. Total number of neurons analyzed: 274 contra-coding targets; 329 ipsi-coding targets; and 1,381 non-coding targets. Data are shown as the mean and SEM across sessions.
Figure 7
Figure 7. Patterned photostimulation reveals potent inhibitory pressure in L2/3 during task performance
(A) Response maps for threshold stimulus (TS; gray), photostimulation (PS; cyan), and combined TS and PS (magenta) trials for an example session. (B) Close up of the orange-bounded region shown in (A). Lightning bolts indicate the location of PS targets. Bottom right shows the average pixel-wise fluorescence difference across TS + PS and PS trials center-aligned on all photostimulation target locations. (C) Extracted fluorescence traces from target neurons (top; n = 23 neurons) and TS-responsive network neurons (bottom; n = 57 neurons) across trial types from the example session in (A). (D) Suppression of photostimulation responses in the target neuron group on PS vs. TS + PS trials is correlated with the mean response to TS whisker trials in non-targeted network cell group. Each data point represents a single photostimulation condition. (E) Responses in photostimulation target neurons across different trial types are plotted as a function of whisker responsiveness. (F) The difference between the measured (magenta in E) and expected (black in E) response to combined TS and PS stimuli in target neurons is plotted as function of whisker responsiveness. The inset shows quantification of this difference averaged across contra-coding (red), ipsi-coding (blue), and non-coding (gray) target neuron ensembles. (G) Suppression of TS responses in network neuron groups on TS + PS trials is plotted against average PS-evoked responses in target neuron groups. (H) Average PS-evoked suppression of TS responses in network neurons is binned as a function of the number of nearby activated target neurons (counted within a 200 μm radius). The inset shows the average Pearson’s correlation coefficient between sensory suppression and number of nearby targets across sessions (r = −0.21 ± 0.47; mean ± SD; ** p = 0.002 Wilcoxon signed-rank test tested against 0). (I) Responses in TS-responsive network neurons across trial types are plotted as a function of whisker responsiveness. The inset shows quantification of the change across TS and TS + PS trials with respect to ensemble groups as in (F). (J) The difference in network neuron response on TS and TS + PS is shown as a function of whisker responsiveness. The absolute change is shown in black, and the proportional change relative to TS baseline is shown in orange. Data in Figure 7 come from 104 photostimulation conditions across 52 sessions in 13 mice. Total number of target neurons analyzed = 1,992; total number of network neurons analyzed = 2,429. Total number of trials analyzed: 3,466 TS, 3,568 PS; 3,447 TS + PS trials. Data are shown as the mean and SEM across sessions. Statistical comparisons were Wilcoxon signed-rank test. n.s. p > 0.05; * p < 0.05; ** p < 0.01; *** p < 0.001.
Figure 8
Figure 8. Antagonistic interactions between contra and ipsi-coding neurons in L2/3
(A) Fluorescence traces in contra-coding (left; red) and ipsi-coding (right; blue) ensembles across unilateral (top) and bilateral (bottom) whisker deflection intensities (%). (B) Quantification of the mean fluorescence responses across a × 3 matrix stimulus set in contra-coding (top) and ipsi-coding (bottom) ensembles (average ensemble response across 52 sessions). (C) Comparison of responses to preferred unilateral whisker stimulation (green; 100% unilateral stimulation) and matched bilateral whisker stimulation (black; 100% bilateral stimulation) plotted as a function of stimulus selectivity. (D) The difference in unilateral and bilateral responses (shown in C) is plotted as a function of stimulus selectivity. The inset shows quantification of this difference in contra and ipsi-coding ensembles (n = 52 sessions; Wilcoxon signed-rank test; *** p < 0.001; thin gray lines show individual sessions). (E) Comparison of response suppression in one ensemble group on bilateral trials with the unilateral response in the other ensemble group. Each marker point represents an individual session, 52 sessions in total. Total number of contra-coding neurons analyzed 1,907; ipsi-coding neurons 1,925. (F) Probing functional connectivity in the circuit using targeted photostimulation of whisker-biased target groups. (G) Comparing average whisker selectivity of network followers in response to targeted photostimulation. Correlations are measured across 104 mean-centered data points (2 photostimulation conditions per session, 52 sessions in total). Shaded error bars denote the 95% confidence bounds of a linear regression fit to the data.

References

    1. O’Connor DH, Huber D, Svoboda K. Reverse engineering the mouse brain. Nature. 2009;461:923–929. doi: 10.1038/nature08539. - DOI - PubMed
    1. Panzeri S, Harvey CD, Piasini E, Latham PE, Fellin T. Cracking the Neural Code for Sensory Perception by Combining Statistics, Intervention, and Behavior. Neuron. 2017;93:491–507. doi: 10.1016/j.neuron.2016.12.036. - DOI - PMC - PubMed
    1. Ohki K, Chung S, Ch’ng YH, Kara P, Reid RC. Functional imaging with cellular resolution reveals precise micro-architecture in visual cortex. Nature. 2005;433:597–603. doi: 10.1038/nature03274. - DOI - PubMed
    1. Lefort S, Tomm C, Floyd Sarria JC, Petersen CCH. The Excitatory Neuronal Network of the C2 Barrel Column in Mouse Primary Somatosensory Cortex. Neuron. 2009;61:301–316. doi: 10.1016/j.neuron.2008.12.020. - DOI - PubMed
    1. Cossell L, Iacaruso MF, Muir DR, Houlton R, Sader EN, Ko H, Hofer SB, Mrsic-Flogel TD. Functional organization of excitatory synaptic strength in primary visual cortex. Nature. 2015;518:399–403. doi: 10.1038/nature14182. - DOI - PMC - PubMed

LinkOut - more resources