. 2024 Jul 18;31(7):1324-1335.e20.
doi: 10.1016/j.chembiol.2024.04.003. Epub 2024 May 9.

Behavioral control through the direct, focal silencing of neuronal activity

Affiliations

Behavioral control through the direct, focal silencing of neuronal activity

Anna V Elleman et al. Cell Chem Biol. .

Abstract

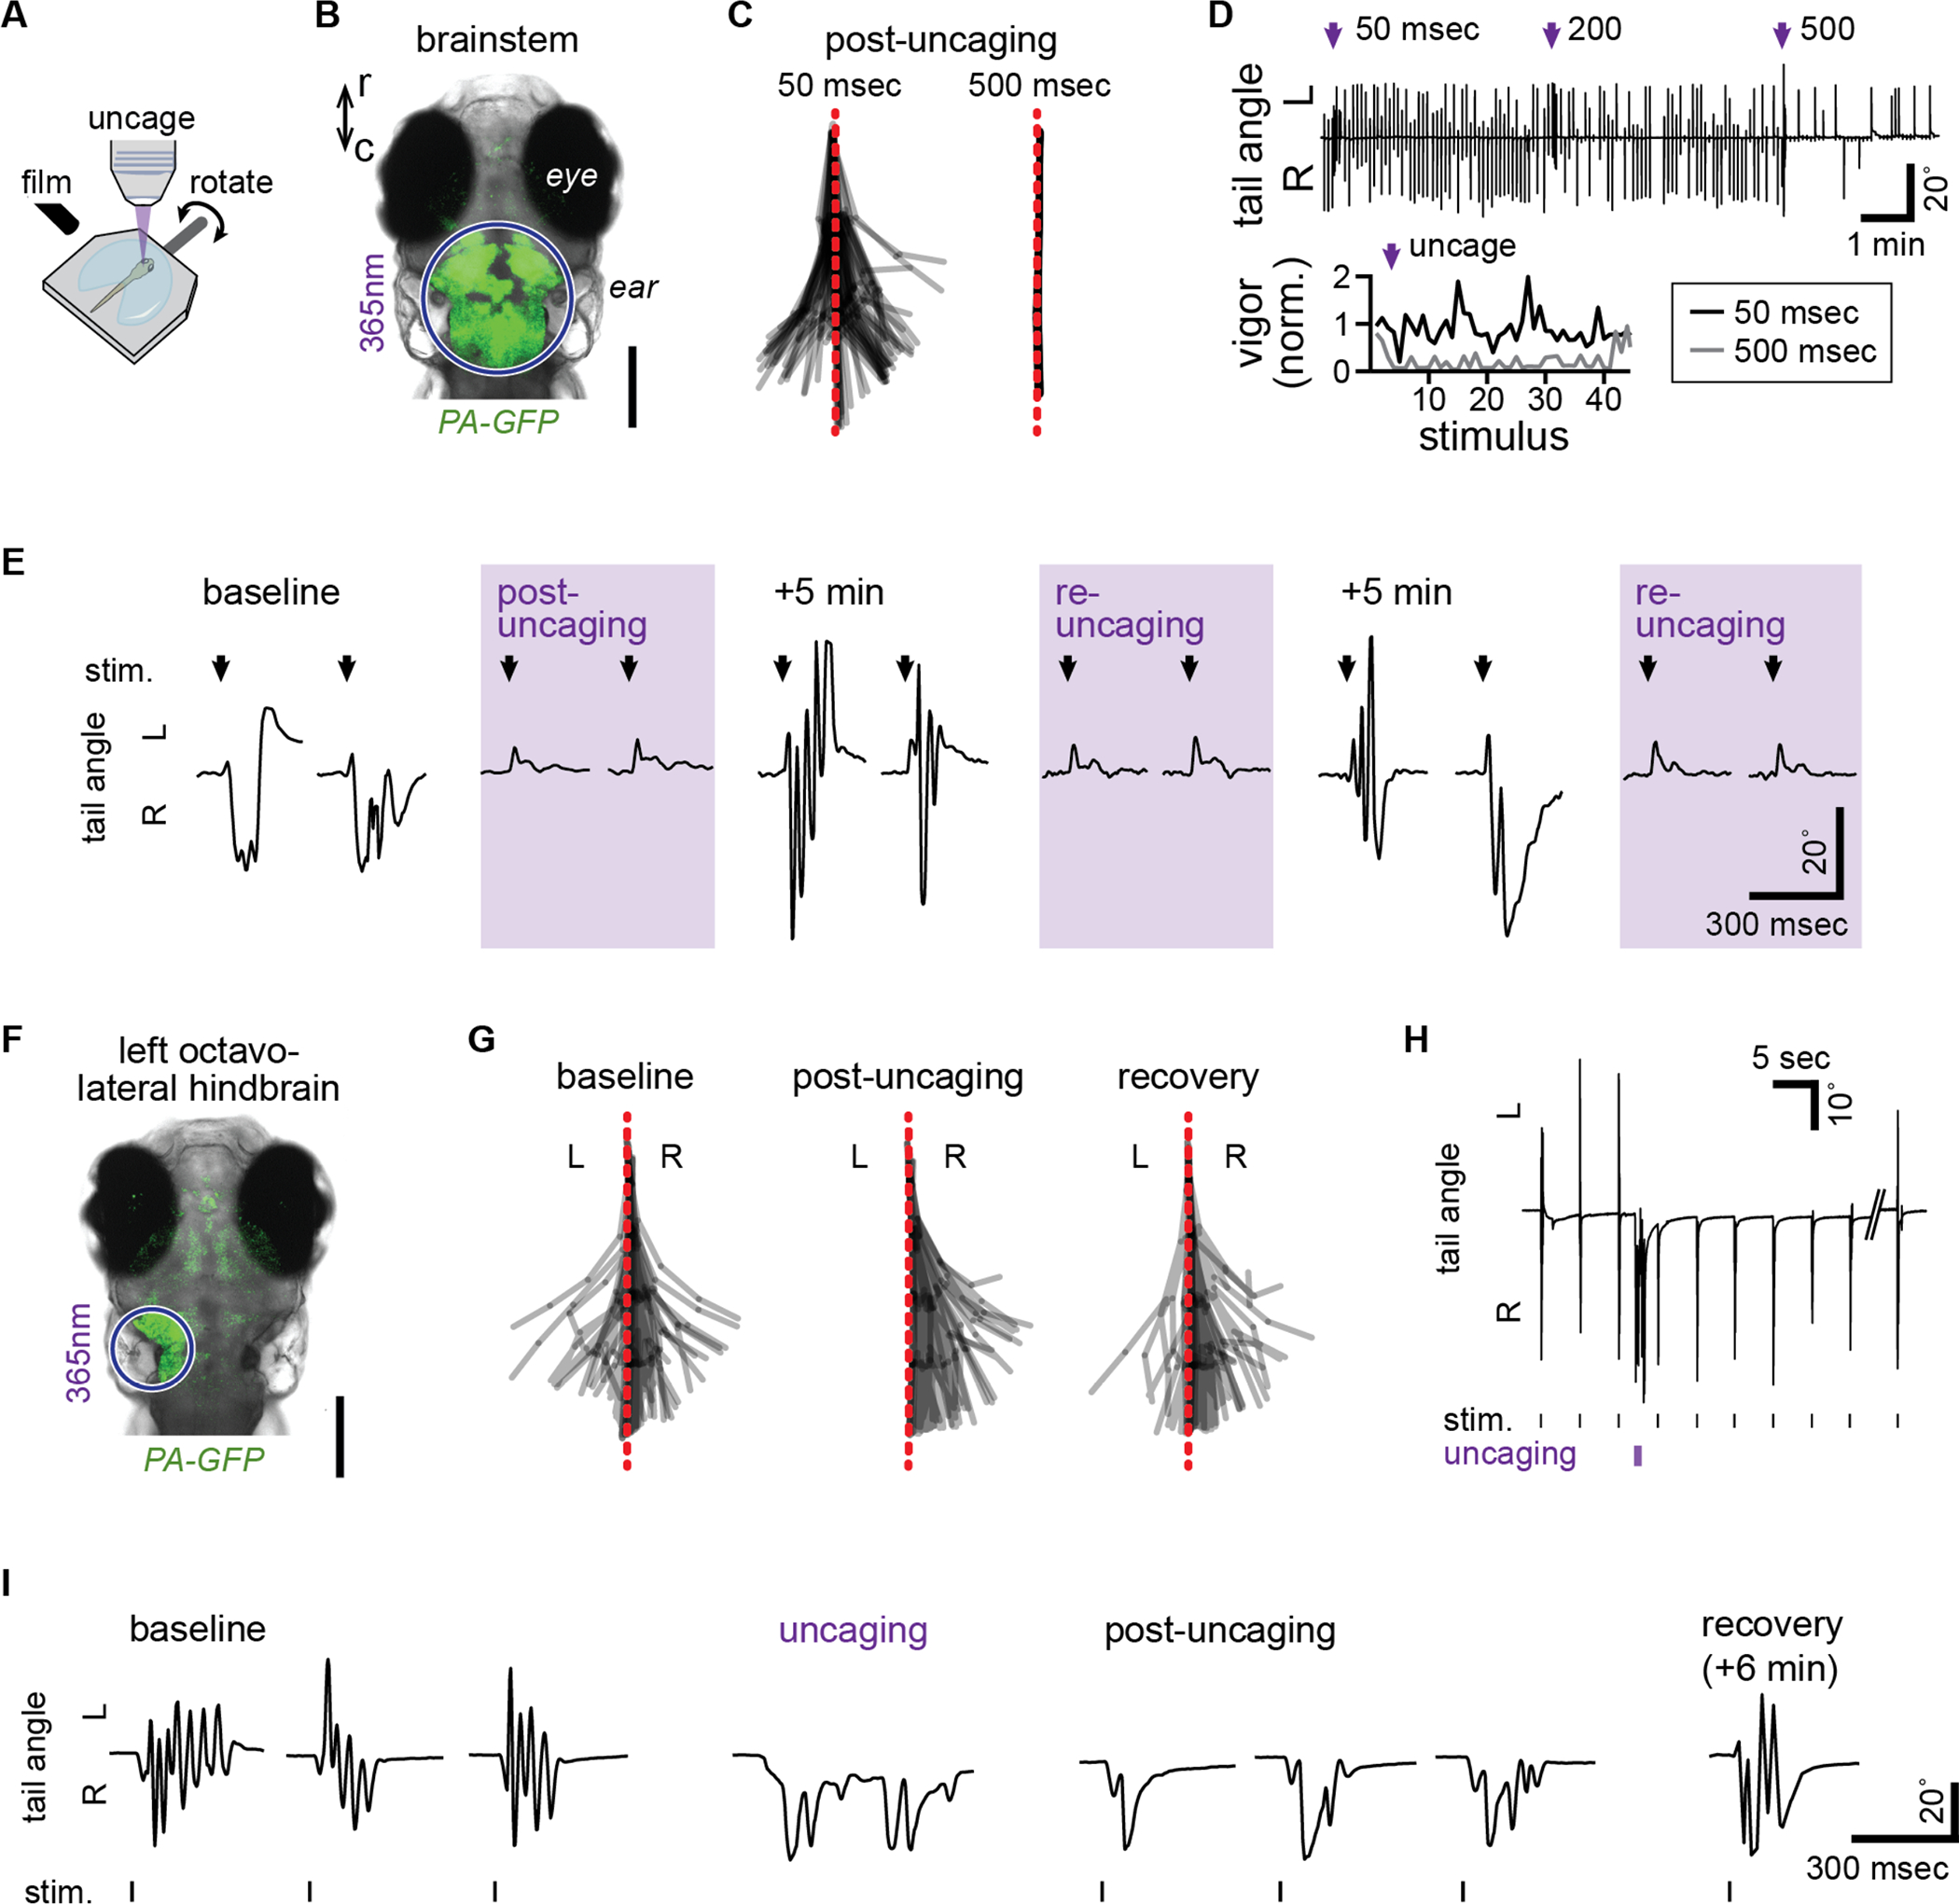
The ability to optically stimulate and inhibit neurons has revolutionized neuroscience research. Here, we present a direct, potent, user-friendly chemical approach for optically silencing neurons. We have rendered saxitoxin (STX), a naturally occurring paralytic agent, transiently inert through chemical protection with a previously undisclosed nitrobenzyl-derived photocleavable group. Exposing the caged toxin, STX-bpc, to a brief (5 ms) pulse of light effects rapid release of a potent STX derivative and transient, spatially precise blockade of voltage-gated sodium channels (NaVs). We demonstrate the efficacy of STX-bpc for parametrically manipulating action potentials in mammalian neurons and brain slice. Additionally, we show the effectiveness of this reagent for silencing neural activity by dissecting sensory-evoked swimming in larval zebrafish. Photo-uncaging of STX-bpc is a straightforward method for non-invasive, reversible, spatiotemporally precise neural silencing without the need for genetic access, thus removing barriers for comparative research.

Keywords: actional potential; electrophysiology; photocage; saxitoxin; sodium channel; zebrafish.


Conflict of interest statement

Declaration of interests J.D. is a cofounder and holds equity shares in SiteOne Therapeutics, Inc., a start-up company interested in developing subtype-selective Na(V) modulators.

Figures

Figure 1:
Figure 1:. Optimized photocaged toxin enables precise control of rNaV1.2 current.
(A) MeNPOC (3,4-(methylenedioxy)-6-nitrophenylethoxycarbonyl) photo-protecting group. (B) Scheme depicting generalized synthesis and uncaging of photocaged STXs. a, i-PrMgCl•LiCl then 6-nitropiperonal (Ar = aryl); b, N,N’-disuccinimidyl carbonate, Et3N; c, saxitoxin-ethylamine 1; details are available in the Extended Data. Purple dashed line depicts location of photocleavage. (C) Generation 1 and 2 photocaged STXs. R = allyl. (D) Electrophysiological characterization of Generation 1 photocaged STXs against NaV1.2 CHO. IC50s, Hill coefficients: 1 = 14.4 ± 0.3 nM, −0.94 ± 0.02 (n = 6–7); 2 = 17.3 ± 0.7 nM, −1.17 ± 0.05 (n = 6–7); 3 = 59.8 ± 3.3 nM, −1.35 ± 0.10 (n = 3); 4 = 132.1 ± 7.3 nM, −1.35 ± 0.10 (n = 6). (E) Electrophysiological characterization of Generation 2 photocaged STXs against NaV1.2 CHO. IC50s, Hill Coefficients: 1 = 14.4 ± 0.3 nM, −0.94 ± 0.02 (n = 6–7); 8 = 67.6 ± 4.9 nM, −1.13 ± 0.09 (n = 4); 9 = 67.6 ± 3.6 nM, −1.23 ± 0.08 (n = 4–5); 10 = 507.2 ± 39.0 nM, −1.38 ± 0.15 (n = 3–4); 11 = 211.3 ± 25.7 nM, −0.93 ± 0.12 (n = 5–9); 12 = 1024.9 ± 38.6 nM, −1.01 ± 0.04 (n = 4–5); 13 = 3919.4 ± 172.6 nM, −1.02 ± 0.05 (n = 5–7). (F) Uncaging of 200 nM 13 against NaV1.2 CHO. Traces collected in the order: Initial, 200 nM 13, 0 s, 2 s, 4 s. Laser applied immediately prior to 0 s trace. Currents observed at 4 s used to calculate uncaging data described in (G). (G) Electrophysiological characterization and laser uncaging of 13 against NaV1.2 CHO. Apparent IC50s, Hill Coefficients: 1 = 14.4 ± 0.3 nM, −0.94 ± 0.02 (n = 6–7); 13 = 3919.4 ± 172.6 nM, −1.02 ± 0.05 (n = 5–7); 13 uncaged with 5 ms laser = 51.0 ± 1.9 nM, −0.98 ± 0.03 (n = 5–7); 13 uncaged with 5 × 5 ms laser = 21.3 ± 0.7 nM, −0.84 ± 0.02 (n = 5–7). Potency window highlighted in grey. See also Figures S1–S3, Tables S1–S2.
Figure 2:
Figure 2:. Uncaging of 13 rapidly blocks action potential propagation in dissociated embryonic hippocampal neurons.
(A) Uncaging of 100 nM 13. Traces collected in the order: Initial, 100 nM 13, 0 s, 2 s, etc. Laser applied immediately prior to 0 s trace. Currents observed at 10 s used to calculate uncaging data described in (B). (B) Electrophysiological characterization of 13. Apparent IC50s, Hill coefficients: 1 = 14.1 ± 0.8 nM, −0.86 ± 0.04 (n = 4–5); 13 = 5210.0 ± 409.1 nM, −0.88 ± 0.06 (n = 5–6); 13 uncaged with 5 ms laser = 87.6 ± 6.8 nM, −0.78 ± 0.05 (n = 5). (C) Representative traces depicting initial (I), laser applied (L), 200 nM 13 applied (T), 200 nM 13 and laser applied (TL), and recovered (R) after wash-off AP trains evoked by 500 ms, 50–150 pA current injections. Data taken from replicate current step 2 vis-à-vis (E). (D) Representative phase plot depicting application and uncaging of 100 nM 13. Calculated from first AP in current step 2 vis-à-vis (E). (E) Heat map summary of AP firing rate after application and uncaging of three different concentrations of 13 (100 nM, 200 nM, 500 nM) color-coded by number of action potentials per step (four replicate current steps at 0.25 Hz per condition). Equilibrated normalized AP firing rate (i.e., over current steps 2–4) compared below (n = 7–8,*p < 0.05, ****p < 0.0001, one-way ANOVA with Tukey’s correction). Full statistical analysis is provided in Table S3. See also Figure S4.
Figure 3:
Figure 3:. Uncaging of 13 effects concentration-dependent changes in action potential shape and propagation in dissociated embryonic dorsal root ganglia cells.
(A) Representative traces depicting initial (I), laser applied (L), 500 nM 13 applied (T), 500 nM 13 and laser applied (TL), and recovered (R) after wash-off AP trains evoked by 500 ms, 250–550 pA current injections. Data taken from replicate current step 2 vis-à-vis (E). (B) Concentration-dependent reduction in AP amplitude after application and uncaging of 13 at listed concentrations. Data calculated from first action potential in current step 2 vis-à-vis (E). Unlisted significant p-values: 200 nM vs 500 nM, p = 0.0064; 500 nM vs 1000 nM, 0.0628 (n = 6–8). (C) Concentration-dependent reduction in AP threshold after application and uncaging of 13 at listed concentrations (n = 6–8). Data calculated from first AP in current step 2 vis-à-vis (E). (D) Representative phase plot depicting application and uncaging of 1000 nM 13. Calculated from first AP in current step 2 vis-à-vis (E). (E) Heat map summary of AP firing rate after application and uncaging of four different concentrations of 13 (100 nM, 200 nM, 500 nM, 1000 nM) color-coded by number of APs per step (four replicate current steps at 0.25 Hz per condition). Equilibrated normalized AP firing rate (i.e., over current steps 2–4) compared below (n = 7–8). (*p < 0.05, **p < 0.01, ****p < 0.0001, one-way ANOVA with Tukey’s correction). Full statistical analysis is provided in Table S3. See also Figure S4.
Figure 4:
Figure 4:. Activation of STX-bpc 13 abolishes action potentials in layer 4 cortical neurons.
(A) Electrophysiological response of layer 4 cortical neurons (S1bf) to 500 ms 50–150 pA current steps. APs evoked during a baseline period shown in blue, during exposure to 365 nm LED UV light alone (purple), and in the presence of 250 nM STX-bpc 13 (red). APs were blocked following exposure to both UV and 13 (green). The same color scheme is used throughout the figure. (B) Box plot showing the number of APs evoked under the conditions shown in (A). Each point represents a different cell. Dunnett’s test ***p < 0.001. (C) Phase plane plot derived from APs evoked under different experimental conditions indicated by the colored arrows. The axon initial segment (AIS) and somatodendritic (SD) peaks are shown by the black arrows. APs evoked at baseline (blue), in UV but absence of STX-bpc (UV, purple), and in the presence of caged STX-bpc but absence of UV (STX-bpc, red) are similar in shape and size indicating a minimal effect on the AP of UV light or caged STX-bpc. Three APs evoked in UV and in the presence of STX-bpc are shown in green (STX-bpc UV, Green). Green shading indicates AP order. (D) AP voltage traces (upper trace), and first (middle trace) and second (lower trace) derivative plots of the same APs in (C) are shown. The inset on the second derivative plots shows an enlarged portion of the same plot in which the AIS and SD peaks are clearly discernable (E–I). Box plots showing quantification of AP characteristics. The peak ratio (H) and peak amplitude (I) could only be plotted where both SD and AIS peaks were distinguishable (n = 3). Dunnett’s test ***p < 0.001,**p < 0.01 (J) Fast spiking cells (FS) were distinguished from regular spiking cells (RS) based on the average baseline AP firing rate and the half-width of the rhehobase AP. (K) Raster plot showing AP firing over time in the presence of 13 before and during UV light exposure (purple). 13 RS (black) and 8 FS neurons (red) are displayed. Each occurance of an AP is represented by a vertical bar aligned to the onset of UV. (L) Comparison of the time course of AP block following UV between RS and FS cells. (M) The rapidness of the rheobase AP did not predict the latency to AP block following UV in either RS or FS cells. See also Figure S6.
Figure 5:
Figure 5:. Comparison of STX-bpc 13 to optogenetic NpHR3.0 silencing of action potentials.
(A) Schematic of viral injection of viral vector carrying optogenetic inhibition into the cortex. Graph shows validation of eNpHR3.0-mediated hyperpolarization of L4 neurons in cortical slices exposed to 595nm light (n = 6). Imaging shown in 4x and 40x magnification (infrared and fluorescence) of whole cell patch clamp experiments. Expression of eNpHR3.0 fluorescence is visible with mCherry. (B) APs were evoked in L4 RS cells by a 5 second ramp current injection in current clamp in the presence of STX-bpc (250 nM) under conditions of 595nm light at the onset of the current ramp to activate eNpHR3.0 in isolation or 365nm with light on 20 seconds prior to the current ramp to uncage STX-bpc. (C) Quantification of AP generation in response to ramp currents at baseline compared to under optogenetic inhibition and uncaging of STX-bpc (n = 4, *p < 0.05, one-way ANOVA with Friedman correction). (D) Box plot showing the % reduction in APs evoked by ramp current injection by eNpHR3.0 activation and uncaging of STX-bpc compared to baseline (n = 4, *p < 0.05, Mann-Whitney test).
Figure 6:
Figure 6:. Uncaging of STX-bpc 13 in vivo manipulates larval zebrafish behavior.
(A) Schematic for swim tracking following rotation stimulus presentation and focal uncaging. (B) Confocal photomicrograph of dorsal perspective of a larval zebrafish head expressing photoactivatable GFP (PA-GFP), showing the region of UV light exposure (purple circle) during brainstem-wide uncaging. Scale bar = 200 μm. (C) Superimposed tail segment positions from a tracked larva across 3 stimulus presentations following 50 msec (left) or 500 msec (right) uncaging in the brainstem. (D) Tail angle (top) of a larva throughout a train of stimulus presentations every 5 sec, interspersed with brainstem uncaging of increasing duration (purple arrow). Swimming vigor (bottom) is plotted as a function of stimulus number for 3 stimuli before and 42 after uncaging for 50 and 500 msec. (E) Tail angle during the first 2 stimulus presentations (arrow) of series without uncaging or immediately following uncaging (purple shading, post-uncaging or re-uncaging). (F) Photomicrograph, as in (B), showing the location of activated PA-GFP following focal uncaging in the left octavolateral hindbrain to unilaterally inactivate sensory areas for rotation stimuli. Scale bar = 200 μm. (G) Superimposed tail positions from a tracked larva across 3 stimulus presentations at baseline, immediately following uncaging in the left octavolateral hindbrain (post-uncaging), and 6 min after uncaging (recovery). (H,I) Tail angle of the larva in (G) in response to rotation stimulus presentation before and after uncaging (H,I) and following recovery (I). See also Video S1.

Similar articles

Cited by

References

    1. Kim TH, and Schnitzer MJ (2022) Fluorescence imaging of large-scale neural ensemble dynamics. Cell 185, 9–41. 10.1016/j.cell.2021.12.007. - DOI - PMC - PubMed
    1. Jacobs J, and Kahana MJ (2010) Direct brain recordings fuel advances in cognitive electrophysiology. Trends Cogn. Sci. 14,162–171. 10.1016/j.tics.2010.01.005. - DOI - PMC - PubMed
    1. Deisseroth K (2015) Optogenetics: 10 years of microbial opsins in neuroscience. Nat Neurosci. 18, 1213–1225. 10.1038/nn.4091. - DOI - PMC - PubMed
    1. Yizhar O, Fenno LE, Davidson TJ, Mogri M, and Deisseroth K (2011) Optogenetics in neural systems. Neuron 71, 9–34. 10.1016/j.neuron.2011.06.004. - DOI - PubMed
    1. Boyden ES, Zhang F, Bamberg E, Nagel G, and Deisseroth K (2005) Millisecond-timescale, genetically targeted optical control of neural activity. Nat Neurosci. 8, 1263–1268. 10.1038/nn1525. - DOI - PubMed

LinkOut - more resources