. 2024 May 10;15(1):3937.
doi: 10.1038/s41467-024-47574-0.

Pretreatment with IL-15 and IL-18 rescues natural killer cells from granzyme B-mediated apoptosis after cryopreservation

Affiliations

Pretreatment with IL-15 and IL-18 rescues natural killer cells from granzyme B-mediated apoptosis after cryopreservation

Abdulla Berjis et al. Nat Commun. .

Abstract

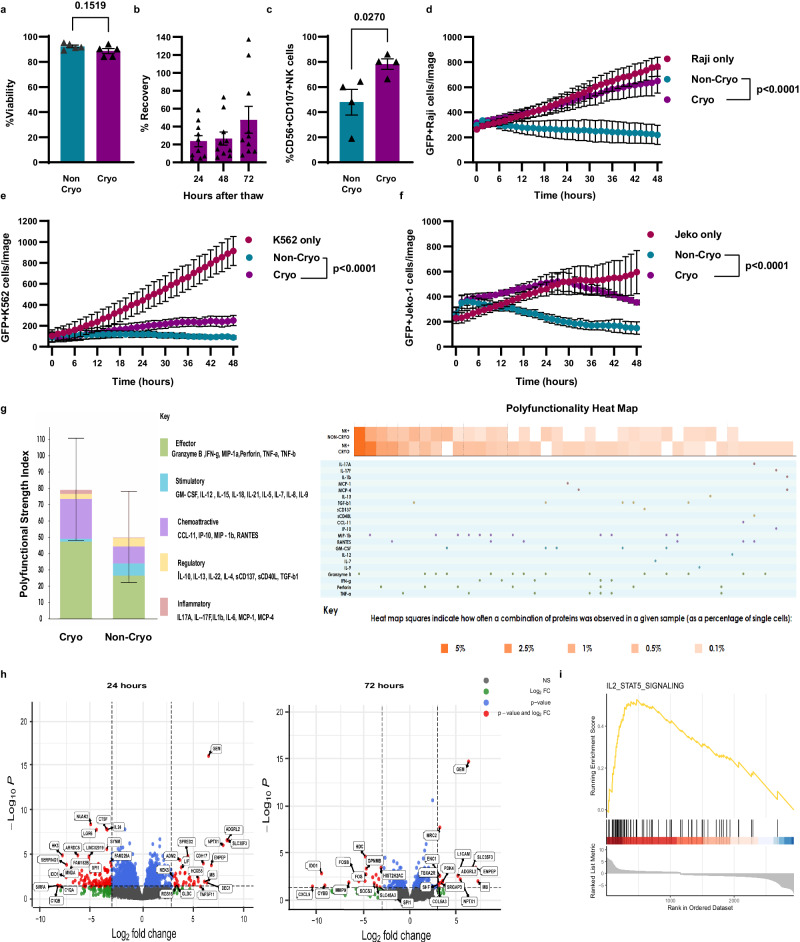
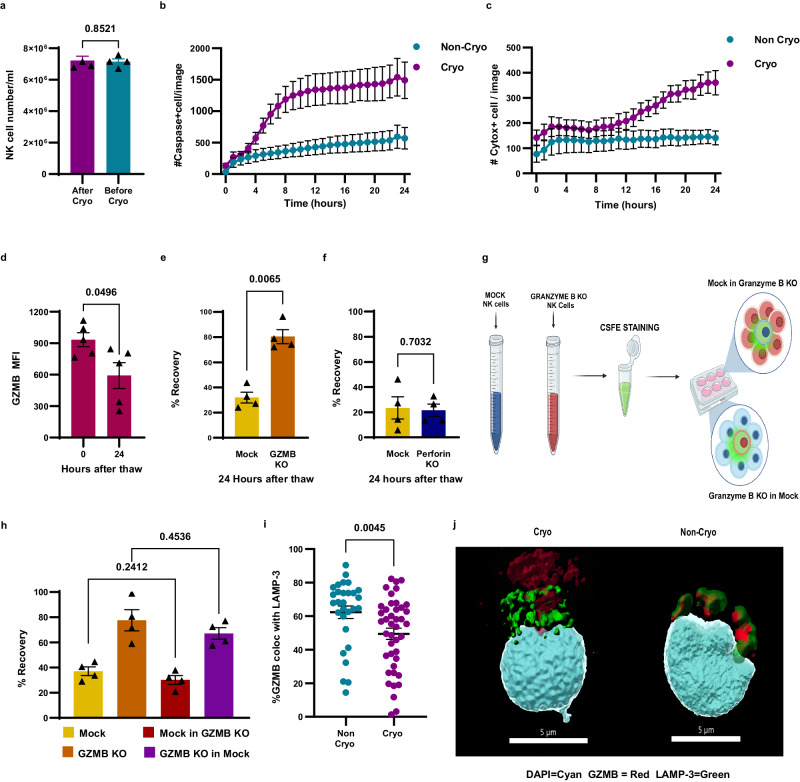
Human natural killer (NK) cell-based therapies are under assessment for treating various cancers, but cryopreservation reduces both the recovery and function of NK cells, thereby limiting their therapeutic feasibility. Using cryopreservation protocols optimized for T cells, here we find that ~75% of NK cells die within 24 h post-thaw, with the remaining cells displaying reduced cytotoxicity. Using CRISPR-Cas9 gene editing and confocal microscopy, we find that cryopreserved NK cells largely die via apoptosis initiated by leakage of granzyme B from cytotoxic vesicles. Pretreatment of NK cells with a combination of Interleukins-15 (IL-15) and IL-18 prior to cryopreservation improves NK cell recovery to ~90-100% and enables equal tumour control in a xenograft model of disseminated Raji cell lymphoma compared to non-cryopreserved NK cells. The mechanism of IL-15 and IL-18-induced protection incorporates two mechanisms: a transient reduction in intracellular granzyme B levels via degranulation, and the induction of antiapoptotic genes.


Conflict of interest statement

A.B. and N.C.S. have submitted a Patent application covering aspects of this work. C.H.J. has received grant support from Novartis, and has patents related to CAR-Therapy with royalties paid from Novartis to the University of Pennsylvania. C.H.J. is also a scientific co-founder and holds equity in BlueWhale Bio, Capstan Therapeutics and Tmunity Therapeutics. He serves on the board of AC Immune and is a scientific advisor Alaunos, BluesphereBio, Cabaletta, Carisma, Cartography, Cellares, Cellcarta, Celldex, Danaher, Decheng, ImmuneSensor, Poseida, Verismo, Viracta, and WIRB-Copernicus group. L.L.L. is an advisor to Catamaran, Cullinan Oncology, Dragonfly, DrenBio, Edity, GV20, IMIDomics, InnDura Therapeutics, Innovent, Nkarta, oNKo-innate, Obsidian Therapeutics, and SBI Biotech. N.C.S. holds equity in Tmunity Therapeutics and BlueWhale Bio. The remaining authors declare no competing interests.

Figures

Fig. 1
Fig. 1. Characterizing NK cell recovery, phenotype, and function after cryopreservation.
a NK cell viability after thawing assessed via flow cytometry (n = 5 healthy donors). b NK cell recovery 24, 48, and 72 h after thawing in comparison to starting NK cell number at time 0 h after thawing (n = 10 healthy donors). c CD107A degranulation assay before and after thawing. NK cells were cultured with K562 cells at 1:1 effector:target ratio for 3 h (n = 4 healthy donors). d NK cytotoxicity assay before and after cryopreservation with B2M KO Raji cells (n = 4 healthy donors). e NK cytotoxicity assay before and after cryopreservation with K562 cells (n = 4 healthy donors). f ADCC assay using anti-CD20 antibody and Jeko-1 cells (n = 3 healthy donors). g Single-cell secretome profile of cryopreserved and non-cryopreserved NK cells treated with R848 for 24 h). Heatmap showing individual cytokines that NK cell secreted (n = 3 healthy donors). h Bulk RNA volcano plot comparing before, 24 and 72 h after cryopreservation (n = 5 healthy donors). i GSEA of IL-2-STAT5 pathway. Normality test was used to determine the distribution of the data then parametric test t test was used for (a, c). Two-way RM ANOVA was used for (df). The Benjamini–Hochberg method was used to obtain P value shown in (h). A two-tailed test was used for (a, c, h). g Error bars are shown as mean SD. All other graphs are shown as mean ± SEM.
Fig. 2
Fig. 2. GZMB leakage induces apoptosis in NK cells after cryopreservation.
a NK cell recovery immediately before and after cryopreservation (n = 4 healthy donors). b Incucyte live imagining using caspase-3/7 cleavable dye to indicate early apoptosis (n = 4 healthy donors). c Incucyte live imagining using Cytox NIR dye to indicate loss of plasma membrane integrity (n = 4 healthy donors. d granzyme B levels at time 0 and 24 h after thawing (n = 5 healthy donors). e GZMB knockout NK cells recovery after cryopreservation (n = 4 healthy donors). f Perforin knockout NK cells recovery after cryopreservation (n = 4 healthy donors). g, h GZMB and mock KO NK cells were cocultured at 1 ratio of 1:10 in both directions to determine the role of fratricide in NK cell death (n = 4 healthy donors). i, j Confocal microscopy imaging showing the extent of colocalization of GZMB and LAMP-3, a marker for cytotoxic granules in fresh versus cryopreserved NK cells (fresh n = 29, cryopreserved n = 42). Normality test was used to determine the distribution of the data then parametric test t test was used for (a, d, e, f, h). nonparametric Mann–Whitney test was used for (i). A two-tailed test was used for (a, d, e, f, h, i). All graphs are shown as mean ± SEM.
Fig. 3
Fig. 3. IL-15 + IL-18 pretreatment improves NK cell recovery and function after cryopreservation by inducing GZMB release and upregulating antiapoptotic genes.
a, b Pretreating NK cells with cytokines 24 h before cryopreservation (n = 10 healthy donors (a) and n = 6 healthy donors for (b). c GZMB MFI 24 h after vehicle or IL-12 treatment (n = 7 healthy donors). d NK cell-mediated killing assay using IL−15 + IL−18-pretreated NK cell before and after cryopreservation (n = 4 healthy donors). e Single-cell secretome profile of IL-15 + IL-18-treated cryopreserved and fresh NK cells treated with R848 for 24 h (n = 3 healthy donors). f CD107A degranulation after IL-15 + IL-18 treatment (n = 6 healthy donors). g Granzyme B ELISA 24 h after IL−15 + IL-18 treatment (n = 6 healthy donors). h Comparing MFI of IL-15 + IL-18-treated NK cells at 24- and 72-h post-treatment (n = 7 healthy donors). i Volcano plot comparing IL-15 + IL-18-treated vs untreated NK cells (n = 3 healthy donors). j Heatmap showing RNA levels using NanoString assay (n = 3 healthy donors). k MFI quantification of BCL2L1 after IL-15 + IL-18 treatment (n = 3 healthy donors). l Recovery of perforin KO and BCL2L1 KO NK cells with and without IL-15 + IL-18 pretreatment (n = 3 healthy donors). m IL-15 + IL-18-treated NK cell cryopreservation using GMP control rate freezer (n = 4 healthy donors). Normality test was used to determine the distribution of the data then parametric test t test was used for (c, g, k, l, m), nonparametric Wilcoxon matched pairs t test was used for (a, b, f, h). Two-way RM ANOVA was used for (d). The Benjamini–Hochberg method was used to obtain P value shown in (i, j). Two-tailed test was used for (ac, fm). e Error bars are shown as mean SD. All other graphs are shown as mean ± SEM.
Fig. 4
Fig. 4. Deep immunoprofiling of the vehicle and IL-15 + 18-treated NK cells after cryopreservation using cytometry by time of flight (CyTOF) reveals distinct changes in NK cell phenotypes.
a FlowSOM cluster map (n = 3 healthy donors). b individual marker expression in UMAP-1 (n = 3 healthy donors). c heatmap showing markers and expression levels in different clusters (n = 3 healthy donors). d UMAP showing NK cells distribution at different time points after thawing (n = 3 healthy donors).
Fig. 5
Fig. 5. IL-15 + IL-18 pretreatment enables equipotent in vivo activity of cryopreserved and non-cryopreserved untreated NK cells.
a Schematic diagram for in vivo experiment. b Luminescent images of treated mice (n = 9 mice/group). c quantification of tumor burden (flux) (n = 9 mice/group). d NK cell number in the blood of treated mice (n = 9 mice/group). e Survival curve of NK treated mice (n = 9 mice/group) (e). Two-way ANOVA was used for (c). Normality test was used to determine the distribution of the data then parametric test t test was used for d. Simple survival analysis (Kaplan–Meier) with no data adjustment were made for (e). A two-tailed test was used for (d). All graphs are shown as mean ± SEM.

References

    1. Robertson MJ, Ritz J. Biology and clinical relevance of human natural killer cells. Blood. 1990;76:2421–2438. doi: 10.1182/blood.V76.12.2421.2421. - DOI - PubMed
    1. Long EO, Rajagopalan S. Stress signals activate natural killer cells. J. Exp. Med. 2002;196:1399–1402. doi: 10.1084/jem.20021747. - DOI - PMC - PubMed
    1. Bottcher JP, et al. NK cells stimulate recruitment of cDC1 into the tumor microenvironment promoting cancer immune control. Cell. 2018;172:1022–1037 e1014. doi: 10.1016/j.cell.2018.01.004. - DOI - PMC - PubMed
    1. Kirchhammer N, et al. NK cells with tissue-resident traits shape response to immunotherapy by inducing adaptive antitumor immunity. Sci. Transl. Med. 2022;14:eabm9043. doi: 10.1126/scitranslmed.abm9043. - DOI - PubMed
    1. Yoon SR, Kim TD, Choi I. Understanding of molecular mechanisms in natural killer cell therapy. Exp. Mol. Med. 2015;47:e141. doi: 10.1038/emm.2014.114. - DOI - PMC - PubMed

Publication types