. 2024 May 10;15(1):3916.
doi: 10.1038/s41467-024-47929-7.

Rapid expansion and international spread of M1UK in the post-pandemic UK upsurge of Streptococcus pyogenes

Affiliations

Rapid expansion and international spread of M1UK in the post-pandemic UK upsurge of Streptococcus pyogenes

Ana Vieira et al. Nat Commun. .

Abstract

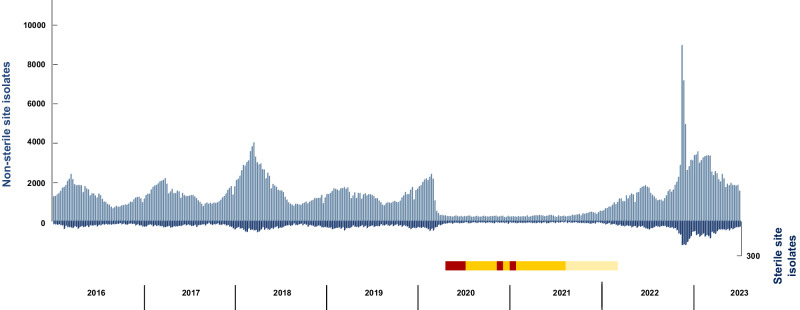
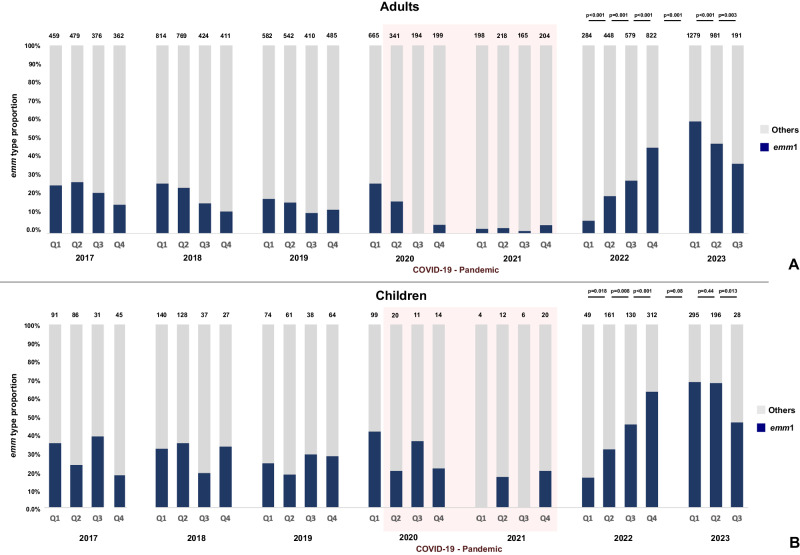
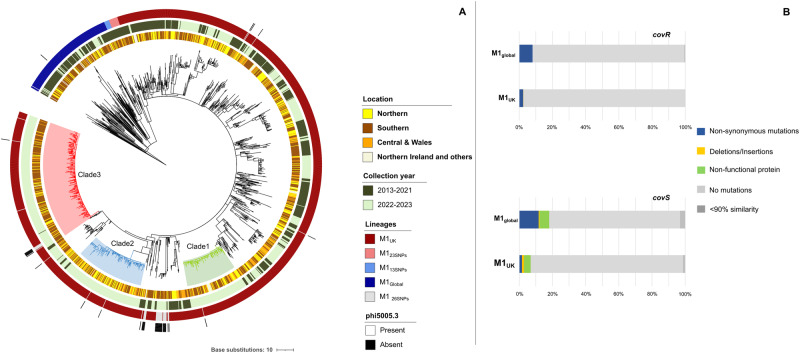
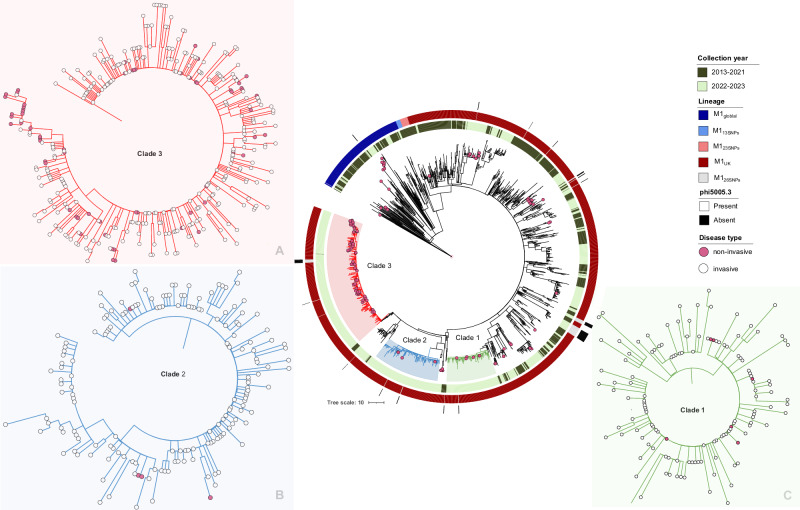
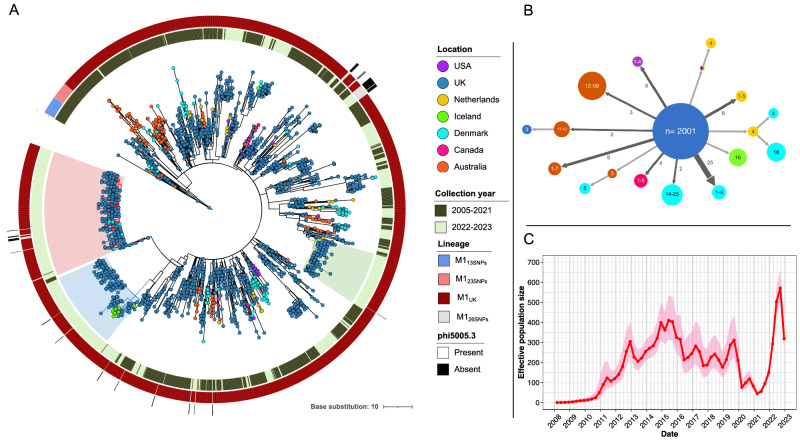
The UK observed a marked increase in scarlet fever and invasive group A streptococcal infection in 2022 with severe outcomes in children and similar trends worldwide. Here we report lineage M1UK to be the dominant source of invasive infections in this upsurge. Compared with ancestral M1global strains, invasive M1UK strains exhibit reduced genomic diversity and fewer mutations in two-component regulator genes covRS. The emergence of M1UK is dated to 2008. Following a bottleneck coinciding with the COVID-19 pandemic, three emergent M1UK clades underwent rapid nationwide expansion, despite lack of detection in previous years. All M1UK isolates thus-far sequenced globally have a phylogenetic origin in the UK, with dispersal of the new clades in Europe. While waning immunity may promote streptococcal epidemics, the genetic features of M1UK point to a fitness advantage in pathogenicity, and a striking ability to persist through population bottlenecks.


Conflict of interest statement

The authors declare no competing interests.

Figures

Fig. 1
Fig. 1. Trend in S. pyogenes-positive samples, England 2016–2023.
Data show absolute numbers of weekly S. pyogenes-positive samples from non-sterile sites (light blue bars, left hand, positive axis) and sterile sites (dark blue bars, right hand, negative axis) recorded by the Second Generation Surveillance System (SGSS) in England, by week and by year. Timing of non-pharmaceutical interventions (NPI) related to COVID-19 in England is indicated by the horizontal bar: red, lockdown periods; orange, legally enforced NPI including no mixing; yellow, non-severe NPI. Schools were closed during lockdown periods and between the two later lockdown periods except for children of key workers and vulnerable children. Source data are provided as a Source Data file Fig. 1.
Fig. 2
Fig. 2. Contribution of emm1 S. pyogenes to invasive group A streptococcal (iGAS) infections 2017–2023.
emm1 isolates are shown as proportions of the total number of isolates from iGAS cases submitted to and genotyped at the national reference laboratory for each quarter of each year. A adults ( ≥ 15 years); B children <15 years. The total number of isolates from iGAS cases received by the reference laboratory and genotyped in each quarter are shown on top of each bar; emm1 proportions are shown in navy blue. Pink shaded region highlights the period of COVID-19 non pharmaceutical interventions. Q1, January-March; Q2, April-June; Q3, July- September; Q4, October-December. Statistical analysis applied to 2022-2023: one-tailed proportion test of emm1 from Q1 2022 to Q3 2023 (p-values indicated in the figure). Source data are provided as a Source Data file Fig. 2.
Fig. 3
Fig. 3. Genetic analysis of 1815 emm1 S. pyogenes isolates from invasive group A streptococcal (iGAS) infections 2013-2023.
A Phylogenetic tree comprising sequenced emm1 isolates associated with invasive infections (iGAS) from 2013-2023 sequenced at reference laboratory: Maximum likelihood phylogenetic tree constructed from 278 core SNPs (excluding recombination regions) extracted after mapping 1815 emm1 isolates to the MGAS5005 reference genome. The tree was drawn in a circular layout and rooted on outgroup genome NCTC8198. Bars in concentric circles represent (from inside to outside) regional location of isolate; collection period (pre-upsurge 2013-2021 or upsurge 2022-2023); emm1 lineage, and presence/absence of the phi5005.3 phage. Regional data have been grouped for purpose of data visualisation as follows: Northern (North-East England, North-West England, Yorks & Humber); Central and Wales (East Midlands, West Midlands, Wales); Southern (South-East England, South-West England, London); and Northern Ireland and others (comprises regions with less than 5 isolates including Scotland, Eire, Jersey, Malta). B Frequency of covR and covS non-synonymous and other mutations within M1UK and M1global isolates from invasive infections. Percentage of strains with non-synonymous mutations, deletions/insertions, or an inactive protein in 1552 M1UK and 189 M1global isolates is shown. Mutation types are indicated by coloured bars. Percentage of strains where sequence quality precluded analysis (sequence identity <90%) are in dark grey. Differences in covR and covS mutation frequency between M1global (covR 15/189; covS 34/189) and M1UK (covR 38/1552; covS 106/1552) are significant (one-tailed proportion test: covR p < 0.001; covS p < 0.001). Ten M1global isolates formed a previously unrecognised clade with covRS mutations. If all strains from this cluster are removed, the covS mutation frequency within M1global (24/179) remains significantly greater than M1UK (106/1552) strains (one-tailed proportion test covS p < 0.001). Source data are provided as a Source Data file Fig. 3.
Fig. 4
Fig. 4. emm1 phylogenetic tree showing non-invasive sore throat isolates collected in London in 2022 with isolates from invasive infection from UK 2013–2023.
Maximum likelihood phylogenetic tree constructed with the core alignment of 274 SNPs extracted after mapping 1815 emm1 invasive isolates and 133 non-invasive isolates against MGAS5005. The relationship between invasive and non-invasive infection isolates within Clades1-3 is shown in inset (A) Clade 3; (B) Clade 2; and (C) Clade 1. Source data are provided as a Source Data file Fig. 4.
Fig. 5
Fig. 5. Global distribution and potential introduction events of M1UK and intermediate populations.
A Phylogenetic tree of 2364 M1UK and intermediate strains collected globally March 2005 to July 2023. The tree was built based on 3406 SNPs from a core genome alignment relative to M1UK (H1490/NCTC14935) reference genome and rooted on a closely related M1global genome gas81595 (also included in this tree). Leaves are coloured based on the country where samples were collected. Shading indicates the 3 emergent clades (Clade 1, green; Clade 2, blue; Clade 3, red). Coloured bars in concentric circles represent (from inside to outside): collection years (pre-upsurge 2013-2021 and upsurge 2022-2023); emm1 lineage; and presence/absence of the phi5005.3 phage. B Simplified transmission tree by PastML showing the ancestral epidemic location of M1UK and intermediate lineages. Each node represents a cluster of leaves sharing the same probable ancestral location and is labelled by the range of leaves numbers. Each arrow indicates inferred international transmission events; arrow width and labels indicate the number of identical origin-destination transmission events. For example, the arrow labelled “6” pointing at the node “1–4” (USA) indicates six clusters of 1 to 4 leaves were present in the USA that were likely imported from the UK. C Estimated effective population size (Ne) of M1UK in the UK through time. The red line and pink shading at each time point indicate the mean and 95% confidence interval of Ne, respectively. Source data are provided as a Source Data file Fig. 5.

References

    1. Brouwer S, et al. Pathogenesis, epidemiology and control of group A Streptococcus infection. Nat. Rev. Microbiol. 2023;21:431–447. doi: 10.1038/s41579-023-00865-7. - DOI - PMC - PubMed
    1. Nelson GE, et al. Epidemiology of invasive group A Streptococcal infections in the United States, 2005–2012. Clin. Infect. Dis. 2016;63:478–486. doi: 10.1093/cid/ciw248. - DOI - PMC - PubMed
    1. Lamagni TL, et al. Predictors of death after severe Streptococcus pyogenes infection. Emerg. Infect. Dis. 2009;15:1304–1307. doi: 10.3201/eid1508.090264. - DOI - PubMed
    1. Steer AC, Law I, Matatolu L, Beall BW, Carapetis JR. Global emm type distribution of group A streptococci: systematic review and implications for vaccine development. Lancet Infect. Dis. 2009;9:611–616. doi: 10.1016/S1473-3099(09)70178-1. - DOI - PubMed
    1. Lynskey NN, et al. Emergence of dominant toxigenic M1T1 Streptococcus pyogenes clone during increased scarlet fever activity in England: a population-based molecular epidemiological study. Lancet Infect. Dis. 2019;19:1209–1218. doi: 10.1016/S1473-3099(19)30446-3. - DOI - PMC - PubMed

Publication types

MeSH terms

Substances