. 2024 May 10;15(1):3941.
doi: 10.1038/s41467-024-48329-7.

Distributed representations of prediction error signals across the cortical hierarchy are synergistic

Affiliations

Distributed representations of prediction error signals across the cortical hierarchy are synergistic

Frank Gelens et al. Nat Commun. .

Abstract

A relevant question concerning inter-areal communication in the cortex is whether these interactions are synergistic. Synergy refers to the complementary effect of multiple brain signals conveying more information than the sum of each isolated signal. Redundancy, on the other hand, refers to the common information shared between brain signals. Here, we dissociated cortical interactions encoding complementary information (synergy) from those sharing common information (redundancy) during prediction error (PE) processing. We analyzed auditory and frontal electrocorticography (ECoG) signals in five common awake marmosets performing two distinct auditory oddball tasks and investigated to what extent event-related potentials (ERP) and broadband (BB) dynamics encoded synergistic and redundant information about PE processing. The information conveyed by ERPs and BB signals was synergistic even at lower stages of the hierarchy in the auditory cortex and between auditory and frontal regions. Using a brain-constrained neural network, we simulated the synergy and redundancy observed in the experimental results and demonstrated that the emergence of synergy between auditory and frontal regions requires the presence of strong, long-distance, feedback, and feedforward connections. These results indicate that distributed representations of PE signals across the cortical hierarchy can be highly synergistic.


Conflict of interest statement

The authors declare no competing interests.

Figures

Fig. 1
Fig. 1. Experimental design, information-theory analyses, and modelling.
a Using a Roving oddball Task, 20 different single tones were presented in the trains of 3, 5, or 11 identical stimuli. Any two subsequent trains consisted of different tones. This way, while the adjacent standard (depicted in black) and deviant (depicted in green) tones deviated in frequency due to the transition between the trains, the two expectancy conditions were physically matched, as the first and the last tones of the same train were treated as deviant and standard tones in the analysis of the adjacent stimuli pairs. This task was performed by 3 marmosets (Fr, Kr, and Go). b Local/Global Task. On each trial, five tones of 50-ms-duration each were presented with a fixed stimulus onset asynchrony of 150 ms between sounds. The first 4 tones were identical, either low-pitched (tone A) or high-pitched (tone B), but the fifth tone could be either the same (AAAAA or BBBBB, jointly denoted by xx) or different (AAAAB or BBBBA, jointly denoted by xY). Each block started with 20 frequent series of sounds to establish global regularity before delivering the first infrequent global deviant stimulus. This task was performed by 2 different marmosets (Ji and Nr). c Neural markers of auditory prediction error. Deviant (green) and standard (black) epochs are used to compute the broadband and ERP responses. Broadband is computed by extracting by reconstructing the time series of standard and deviants with the first spectral principal component (SPCA) of the ECoG signal; ERPs are computed by averaging the raw voltage values for standard and deviant trials (see “Methods”). d Schematic representation of redundancy and synergy analyses computed using co-Information. Each inner oval (A1 and A2) represents the mutual information between the corresponding ECoG signals and the stimuli category (standard or deviant). The overlap between A1 and A2 represents the redundant information about the stimuli (red; left panel). The outer circle around A1 and A2 represents the synergistic information about the stimuli (blue; right panel). e Brain areas modelled, network architecture, and its connectivity. Top left: Cortical areas modelled. Three cortices in the left temporal lobe (primary auditory: A1, auditory belt: AB, and parabelt: PB) are involved in auditory processing, and three in the frontal lobe (prefrontal: PF; premotor: PM; primary motor: M1) directly linked to them. f Network architecture. All the (sparse and random) connections are based on marmoset neuroanatomy (see Methods). g Schematic of links to/from a single excitatory cell 'e'. Each model area consists of two layers of excitatory (upper) and inhibitory (lower) graded-response leaky integrator cells with neuronal fatigue. Dense links between these layers (grey arrows) implement mutual inhibition between (e) and its neighbors. Panels (a and b) are adapted from ref. , under a CC-BY license: https://creativecommons.org/licenses/by/4.0/. Panels (f and g) are adapted from ref. , Copyright Elsevier (2013) under a CC-BY 3.0 license: https://creativecommons.org/licenses/by/3.0/. Panel (e) is adapted from ref. , under a CC-BY license: https://creativecommons.org/licenses/by/4.0/.
Fig. 2
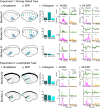
Fig. 2. Broadband and ERP markers of PE across the monkey brain.
Electrode locations for marmoset Kr (64 electrodes), Go (64 electrodes), and Fr (32 electrodes) in Experiment 1; and Nr (96 electrodes in ECoG-array, 39 used for analyses) and Ji (96 electrodes in ECoG-array, 27 used for analyses) in Experiment 2. Electrodes showing significant PE effect after computing MI between standard and deviant trials for the (a, f) Broadband (dark green circles) and (b, g) ERP (light green circles) markers of auditory prediction error. Electrodes showing significant MI for both markers are depicted in cyan. c, h Histogram of electrodes showing significant MI between tones for BB (left), ERP (middle), and both markers (right) for each animal. d, i Electrodes with the highest MI in the temporal and frontal cortex showing the BB signal for deviant and standard tones. Deviant tone (green) and standard tone (black), and the corresponding MI values in bits (effect size of the difference) for the temporal (pink trace) and frontal (orange trace) electrodes. Significant time points after a permutation test are shown as grey bars over the MI plots. e, j Electrodes with the highest MI in the temporal and frontal cortex showing the ERP signal for deviant and standard tones. Error bars indicate standard error of the mean (SEM) across trials. For MI curves, we applied one-sided non-parametric permutation tests, correcting for multiple comparisons with the method of maximum statistics (see Methods). Grey bars show significant time windows with FWER p < 0.05. Panels (a and b) are adapted from ref. , under a CC-BY license: https://creativecommons.org/licenses/by/4.0/. Panels (f and g) are adapted from ref. , under a CC-BY license: https://creativecommons.org/licenses/by/4.0/.
Fig. 3
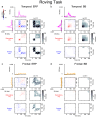
Fig. 3. Temporal synergy and redundancy within ERP and BB signals in the auditory and frontal electrodes with the highest MI for the Roving Oddball Task (experiment 1).
Co-information revealed synergistic and redundant temporal patterns within ERP (Panel a) and BB (Panel b) signals in the auditory cortex, and within ERP (c) and BB (d) signals in the frontal cortex. MI (solid traces) between standard and deviant trials for auditory (pink color) and frontal (orange color) electrodes averaged across the three monkeys. Error bars indicate SEM across electrodes. Temporal co-I was computed within the corresponding signal (ERP, BB) across time points between −100 and 350 ms after tone presentation. The average of the corresponding electrodes across monkeys is shown for the complete co-I chart (red and blue plots); for positive co-I values (redundancy only; red panel); and negative co-I values (synergy only; blue plot). The grey-scale plots show the proportion of monkeys showing significant co-I differences in the single electrodes analysis depicted in Fig. S1. Source data are provided as a Source Data file.
Fig. 4
Fig. 4. Spatio-temporal synergy and redundancy between auditory and frontal electrodes in the Roving Oddball Task (experiment 1).
Co-information revealed synergistic and redundant spatio-temporal patterns between auditory and frontal electrodes in the ERP (Panel a) and BB (Panel b) signals for the Roving Oddball Task. MI (solid traces) between standard and deviant trials for temporal (pink color) and frontal (orange color) electrodes. Error bars indicate SEM across electrodes. Co-I was computed between each pair of electrodes and across time points between −100 and 350 ms after tone presentation. The average of the temporo-frontal pairs across the three monkeys is shown for the complete co-I chart (red and blue plots); for the positive co-I values (redundancy only; red plot); and the negative co-I values (synergy only; blue plot). The proportion of electrode pairs showing significant co-I differences is shown in the corresponding grey-scale plots. The average co-I charts for the individual monkeys are shown in Fig. S3 for the ERP signals and in Fig. S6 for the BB signals. Source data are provided as a Source Data file.
Fig. 5
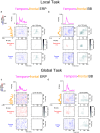
Fig. 5. Temporal synergy and redundancy within ERP and BB signals in the auditory and frontal electrodes with the highest MI for the Local/Global Task (experiment 2).
In the Local and Global contrasts, co-information revealed synergistic and redundant temporal patterns within ERP (Panels a, e) and BB (Panels b, f) signals in the auditory cortex, and within ERP (Panels c, g) and BB (Panels d, h) signals in the frontal cortex. MI (solid traces) between standard and deviant trials for auditory (pink color) and frontal (orange color) electrodes averaged across the three monkeys. Error bars indicate SEM across electrodes. Temporal co-I was computed within the corresponding signal (ERP, BB) across time points between −100 and 350 ms after tone presentation. The average of the corresponding electrodes across monkeys is shown for the complete co-I chart (red and blue plots); for positive co-I values (redundancy only; red panel); and negative co-I values (synergy only; blue plot). The grey-scale plots show the proportion of monkeys showing significant co-I differences in the single electrodes analysis depicted in Fig. S2. Source data are provided as a Source Data file.
Fig. 6
Fig. 6. Spatio-temporal synergy and redundancy between auditory and frontal electrodes in the Local/Global Task (experiment 2).
Co-information revealed synergistic and redundant spatio-temporal patterns between auditory and frontal electrodes in the ERP (Panels a, c) and BB (Panels b, d) signals. MI (solid traces) between standard and deviant trials for temporal (pink color) and frontal (orange color) electrodes. Error bars SEM across electrodes. Co-I was computed between each pair of electrodes and across time points between −100 and 350 ms after tone presentation. The average of the temporo-frontal pairs across the three monkeys is shown for the complete co-I chart (red and blue panel); for the positive co-I values (redundancy only; red panel); and the negative co-I values (synergy only; blue panel). The proportion of electrode pairs showing significant co-I differences is shown in the corresponding grey-scale panels. The average co-I charts for the individual monkeys are shown in Figs. S4 and S5 For ERP signal, and Figs. S7 and S8 for the BB. Source data are provided as a Source Data file.
Fig. 7
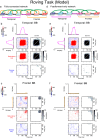
Fig. 7. Model architectures and simulation results.
A brain-constrained model of temporal and frontal areas of the marmoset brain (see Fig. 1f) was stimulated with simulated tones as in the Roving Oddball Task used in Experiment 1. a, d Different network architectures used for the simulations (see Methods). Feedforward and feedback between-area connections are depicted as black and green arrows; recurrent within-area links (panel a only) are shown in gold. Input stimuli were repeatedly presented to area A1 of the network (model correlate of primary auditory cortex) and firing rate responses of each excitatory cell within the six areas were recorded. b, c Results obtained with networks having a Fully Connected (FC) architecture (shown in panel a), which included both feedforward/feedback links and recurrent connections. e, f Results obtained using networks having a Feedforward-only (FF) architecture (panel d), in which the feedback and recurrent connections were absent. MI (solid traces) between standard and deviant trials averaged across three simulation runs (each run modelling a single monkey dataset) are plotted for the three temporal (A1, AB, PB: pink curves) and three frontal (PF, PM, M1: orange curves) areas' simulated responses. Error bars represent SEM. Co-I analyses were performed on the model temporal and frontal areas' signals. Temporal co-I was computed within the simulated firing rates across time points between −100 and 350 ms after stimulus onset. The average of the corresponding electrodes across simulated monkey datasets is shown for the complete co-I chart (red and blue panel), for positive co-I values (redundancy only; red panel) and negative co-I values (synergy only; blue panel). The grey-scale panels show the proportion of simulated monkey datasets with the highest MI within the temporal (A1, AB, PB) and frontal (PF, PM, M1) regions. Note the similarity (in terms of temporal patterns of synergy and redundancy) between the results obtained from the FC model responses (panels b and c) and those from the corresponding experimental data (the BB signal shown in Fig. 3, panels b and d, respectively).
Fig. 8
Fig. 8. Spatio-temporal synergy and redundancy of simulated signals.
The firing rate responses of the networks used to produce the results of Fig. 7 were subjected to co-I analyses between the simulated temporal and frontal areas' signals. b Results obtained using Fully Connected (FC) networks (panel a), which included both feedforward and feedback (black and green arrows) links and recurrent (golden arrows) connections. d Results obtained using Feedforward-only (FF) networks (panel c), in which the feedback and recurrent connections were absent (see Methods). MI (solid traces) between standard and deviant trials averaged across three simulation runs (each run modelling a single monkey dataset) are plotted for the three temporal (A1, AB, PB: pink curves) and three frontal (PF, PM, M1: orange curves) areas' simulated responses. Error bars indicate SEM. Co-I analyses were performed between the model temporal and frontal areas' signals. Temporal co-I was computed from the simulated firing rates across time points between −100 and 350 ms after stimulus onset. The average of the corresponding electrodes across simulated monkey datasets is shown for the complete co-I chart (red and blue panel), for positive co-I values (redundancy only; red panel), and negative co-I values (synergy only; blue panel). The grey-scale panels show the proportion of significant co-I pairs between superior-temporal (A1, AB, PB) and frontal (PF, PM, M1) areas using areas that showed significant MI between standard and deviant trials. Note the similarity (in terms of spatio-temporal patterns of synergy and redundancy) between the results obtained from the model responses and those from the corresponding BB signals in the experimental data of Fig. 4: co-I measures of network responses show significant synergy between temporal and frontal regions (see panel b), as observed in real marmoset data (Fig. 4b). Also, note that such synergistic effects disappear after the removal of the network’s feedback and recurrent links (compare the bottom-right plot of panel b, FC architecture, against that of panel d, FF architecture).

References

    1. Schotten M, Forkel S. The emergent properties of the connected brain. Science. 2022;378:505–510. doi: 10.1126/science.abq2591. - DOI - PubMed
    1. Urai A, Doiron B, Leifer A, Churchland A. Large-scale neural recordings call for new insights to link brain and behavior. Nat. Neurosci. 2022;25:11–19. doi: 10.1038/s41593-021-00980-9. - DOI - PubMed
    1. Shenoy K, Kao J. Measurement, manipulation and modeling of brain-wide neural population dynamics. Nat. Commun. 2021;12:633. doi: 10.1038/s41467-020-20371-1. - DOI - PMC - PubMed
    1. Breakspear M. Dynamic models of large-scale brain activity. Nat. Neurosci. 2017;20:340–352. doi: 10.1038/nn.4497. - DOI - PubMed
    1. Panzeri S, Moroni M, Safaai H, Harvey C. The structures and functions of correlations in neural population codes. Nat. Rev. Neurosci. 2022;23:551–567. doi: 10.1038/s41583-022-00606-4. - DOI - PubMed

Publication types