. 2024 May 10;15(1):3936.
doi: 10.1038/s41467-023-43253-8.

Consensus-building conversation leads to neural alignment

Affiliations

Consensus-building conversation leads to neural alignment

Beau Sievers et al. Nat Commun. .

Abstract

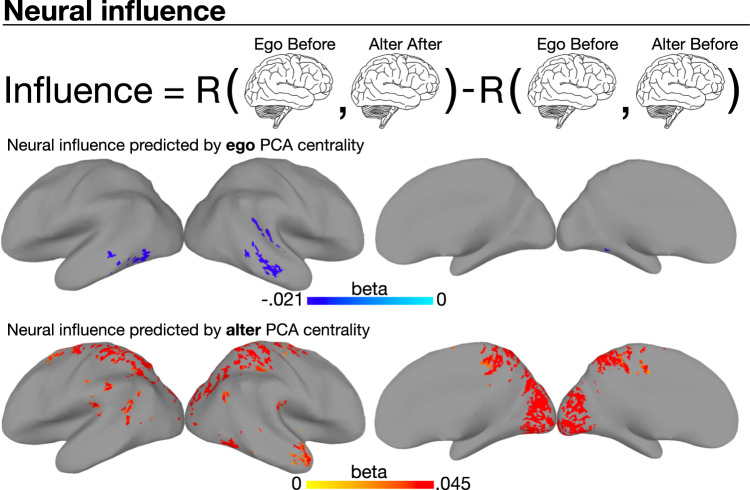
Conversation is a primary means of social influence, but its effects on brain activity remain unknown. Previous work on conversation and social influence has emphasized public compliance, largely setting private beliefs aside. Here, we show that consensus-building conversation aligns future brain activity within groups, with alignment persisting through novel experiences participants did not discuss. Participants watched ambiguous movie clips during fMRI scanning, then conversed in groups with the goal of coming to a consensus about each clip's narrative. After conversation, participants' brains were scanned while viewing the clips again, along with novel clips from the same movies. Groups that reached consensus showed greater similarity of brain activity after conversation. Participants perceived as having high social status spoke more and signaled disbelief in others, and their groups had unequal turn-taking and lower neural alignment. By contrast, participants with central positions in their real-world social networks encouraged others to speak, facilitating greater group neural alignment. Socially central participants were also more likely to become neurally aligned to others in their groups.


Conflict of interest statement

The authors declare no competing interests.

Figures

Fig. 1
Fig. 1. Method and change in alignment across all movie clips and groups.
Top: Participants (n = 49) viewed five ambiguous movie clips during brain scanning, then met in small groups and discussed the movies with the goal of reaching a consensus interpretation. Participants re-watched the movie clips during brain scanning, as well as novel clips from later in each movie. At each step, participants filled out a survey capturing their interpretations. Linear regression was used to model change in inter-subject correlation (ISC) (see Methods). Bottom left: Change in neural alignment caused by consensus-building conversation. Color shows the multiple regression beta weight for being in any conversation group, across all five movie clips (n = 703 unordered participant pairs from 9 conversation groups, control group excluded). Results were thresholded at a two-tailed permutation test P-value of 0.05 corrected for multiple comparisons. Brain maps created using AFNI/SUMA. Bottom right: Participants whose survey answers became similar showed greater neural alignment (n = 3478 unordered participant pairs across all movie clips, including control group participants that did not converse). The central diagonal line and shaded region show the regression line of best fit and its 95% confidence interval. Violin plots use width to represent the density of the distribution, with a central dashed line showing the median and dotted lines showing the lower and upper quartiles. “Brain” icon by Clockwise from Noun Project, available at https://thenounproject.com/icon/brain-1080481/. “Meeting” icon by SBTS from Noun Project, available at https://thenounproject.com/icon/meeting-5279011/. “Clipboard” by Made by Made from Noun Project, available at https://thenounproject.com/icon/clipboard-674066/. “Film” icon by NeueDeutsche from Noun Project, available at https://thenounproject.com/icon/film-531914/.
Fig. 2
Fig. 2. Cognitive processes associated with aligned brain areas.
Conversation-related neural alignment was detected in brain areas associated with a range of cognitive processes, as identified by quantitative reverse inference using Neurosynth.
Fig. 3
Fig. 3. Neural influence across all movie clips and groups.
Changes in neural alignment toward or away from individual participants was captured by a neural influence measure. For each participant pair, one was designated the ego while the other was designated the alter. Neural influence reflects the movement of the alter’s BOLD time series toward the ego’s initial BOLD time series. When egos had higher PCA centrality, alters moved away from them after conversation (top brain map, blue areas). When alters had higher PCA centrality, they moved toward their egos after conversation (bottom brain map, red areas). All movie clips and groups were analyzed using a single regression model (see Methods). Brain maps (n = 1406 ordered participant pairs from 9 conversation groups, control group excluded) show the beta weights for ego PCA centrality (middle) and alter PCA centrality (bottom) (see Methods). Brain maps created using AFNI/SUMA. “Brain” icon by Clockwise from Noun Project, availble at https://thenounproject.com/icon/brain-1080481/.
Fig. 4
Fig. 4. Change analysis example.
A worked toy example of the change analysis for two groups each containing four participants. Top: ISC matrices were calculated for both fMRI sessions. Each matrix contained ISC measurements for all participant pairs. The before-conversation ISC matrix was subtracted from the after-conversation ISC matrix to obtain the change matrix. Middle: Structure of the multiple regression analysis. Predictor matrices captured change caused simply by watching movie clips twice (the intercept), as well as change caused by consensus-building conversation within a single group. Bottom: Examples of subject-wise permutation, where rows and columns are identically shuffled.
Fig. 5
Fig. 5. Participant social networks.
Visualizations of the participants' social networks. Dot size is scaled by PCA centrality (see Methods). Red dots were participants.
Fig. 6
Fig. 6. Neural influence analysis example.
A worked example of how neural influence was calculated based on ISC, for two groups each containing four participants. The influence matrix is determined by assessing how far the alter moved toward the ego’s initial position.

References

    1. Mroz JE, Allen JA, Verhoeven DC, Shuffler ML. Do We Really Need Another Meeting? The Science of Workplace Meetings. Curr. Direc. Psychol. Sci. 2018;27:484–491. doi: 10.1177/0963721418776307. - DOI
    1. Fishkin JS. Democracy When the People Are Thinking: Deliberation and Democratic Renewal. Proc. Am. Philos. Soc. 2019;163:1–14. doi: 10.1353/pro.2019.a914693. - DOI
    1. Lazer DMJ, et al. The science of fake news. Science. 2018;359:1094–1096. doi: 10.1126/science.aao2998. - DOI - PubMed
    1. Broockman D, Kalla J. Durably reducing transphobia: A field experiment on door-to-door canvassing. Science. 2016;3352:81–87. - PubMed
    1. Pons V. Will a five-minute discussion change your mind? A countrywide experiment on voter choice in France. Am. Econ. Rev. 2018;108:1322–1363. doi: 10.1257/aer.20160524. - DOI

Publication types

LinkOut - more resources