. 2024 May 10;7(1):122.
doi: 10.1038/s41746-024-01115-7.

Generalized sleep decoding with basal ganglia signals in multiple movement disorders

Affiliations

Generalized sleep decoding with basal ganglia signals in multiple movement disorders

Zixiao Yin et al. NPJ Digit Med. .

Abstract

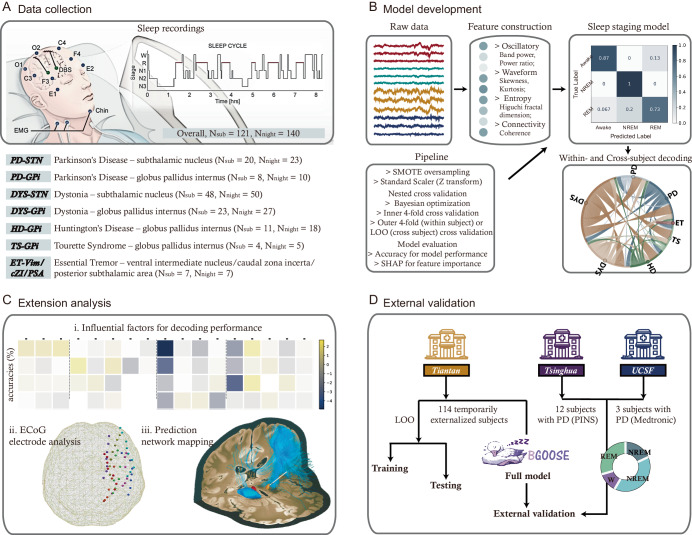
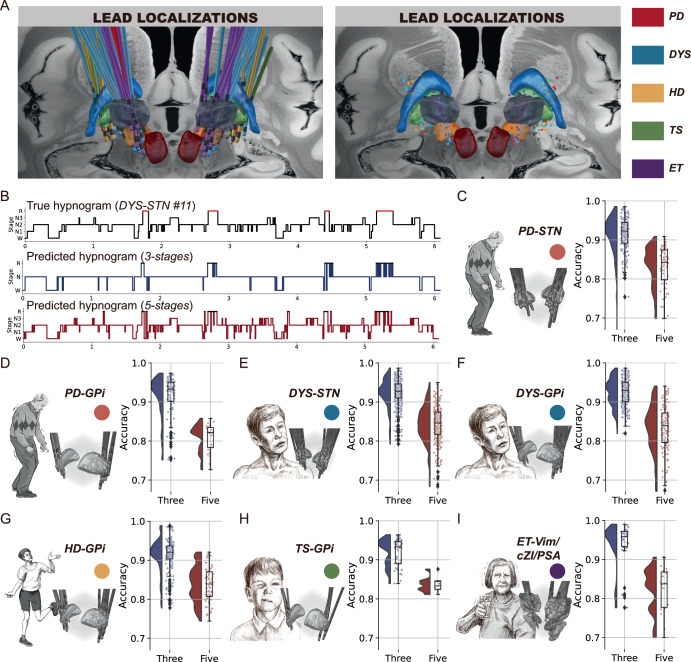
Sleep disturbances profoundly affect the quality of life in individuals with neurological disorders. Closed-loop deep brain stimulation (DBS) holds promise for alleviating sleep symptoms, however, this technique necessitates automated sleep stage decoding from intracranial signals. We leveraged overnight data from 121 patients with movement disorders (Parkinson's disease, Essential Tremor, Dystonia, Essential Tremor, Huntington's disease, and Tourette's syndrome) in whom synchronized polysomnograms and basal ganglia local field potentials were recorded, to develop a generalized, multi-class, sleep specific decoder - BGOOSE. This generalized model achieved 85% average accuracy across patients and across disease conditions, even in the presence of recordings from different basal ganglia targets. Furthermore, we also investigated the role of electrocorticography on decoding performances and proposed an optimal decoding map, which was shown to facilitate channel selection for optimal model performances. BGOOSE emerges as a powerful tool for generalized sleep decoding, offering exciting potentials for the precision stimulation delivery of DBS and better management of sleep disturbances in movement disorders.


Conflict of interest statement

WJN received honoraria for talks unrelated to this manuscript from Medtronic which is a manufacturer of deep brain stimulation devices. The remaining authors declare no competing interests.

Figures

Fig. 1
Fig. 1. The training and prediction pipeline of the BGOOSE. BGOOSE is the acronym for the basal ganglia oscillation-based model for sleep stage estimation.
A Diagram for synchronized basal ganglia and polysomnography recordings in a cohort of 121 patients who underwent DBS surgery (adapted from Yin et al.). B Pipeline for model development. See “Methods” for more details. C The extension analysis includes: (i) moderator analysis investigating factors that may influence decoding accuracies; (ii) evaluating model performance after taking ECoG signals into consideration; and (iii) prediction networking mapping analysis which aims at establishing the projection between channel localization and sleep decoding accuracy (adapted from Merk et al.). D The performance of BGOOSE is validated in two external datasets where basal ganglia local field potentials were recorded using sensing-enable devices during sleep.
Fig. 2
Fig. 2. Individualized sleep decoding with basal ganglia signals for patients with movement disorders.
A shows lead (left) and contact (right) localizations for all subjects. B shows the true and predicted hypnograms from a representative patient (DYS-STN #11). C–I shows the lead localization and results of individualized sleep decoding (training and testing the model using data from the same subject) in each movement disorders cohort. The raincloud plot shows a cloud of individual raw data points, a box plot, and a one-sided violin plot. For the boxplot, the lower and upper borders of the box represent the 25th and 75th percentiles, respectively. The centerline represents the median. The whiskers extend to the smallest and largest data points that are not outliers (1.5 times the interquartile range). The violin plot shows the probability density of the accuracies at different values. The portrait of the patient with Parkinson’s disease is adapted from Arora et al..
Fig. 3
Fig. 3. Cross-subject sleep decoding with basal ganglia signals for patients with movement disorders.
Eleven decoding contexts are generated from different combinations of 7 movement disorder cohorts. For the ALL-CROSSED condition, all subject’s data (n = 114) were used for leave-one-subject-out cross-validation (LOOCV) regardless of the disease and target differences. For the ALL-STN and ALL-GPi conditions, data from patients who had implantations in the STN (n = 67) and GPi (n = 47) were used for LOOCV, respectively, regardless of the disease information. For the ALL-PD and ALL-DYS conditions, data from patients who were diagnosed as PD (n = 28) and dystonia (n = 71) were used for LOOCV, respectively, regardless of the DBS target information. For the PD-STN (n = 19), PD-GPi (n = 9), DYS-STN (n = 48), DYS-GPi (n = 23), HD-GPi (n = 11), and TS-GPi (n = 4) conditions, data from each disease-target group were used for LOOCV in their individual groups. Decoding accuracies are shown in the middle column, with accuracy (ACC), balanced accuracy (BA), and F1 score showing below the name of the cohort. Each dot represents the accuracy value obtained from the left-out subject in that group. The deep-colored regions in the one-sided violin plots show the probability density of the decoding accuracies obtained from the best decoding channels. The light-colored regions show the decoding accuracies obtained from all channels. The vertical gray line represents the mean accuracy value of the best decoding channels. Decoding accuracies for each stage of wakefulness, NREM, and REM sleep from the best decoding channels are shown in the right column. The dashed black line represents the chance accuracy of 33%. The portrait of the patient with Parkinson’s disease is adapted from Arora et al..
Fig. 4
Fig. 4. Cross-subject decoding for the classification of NREN 1/2/3 stages with basal ganglia signals for patients with movement disorders.
The same convention as in Fig. 3.
Fig. 5
Fig. 5. Additional electrocorticography (ECoG) electrode improves sleep decoding.
A shows the localization of all temporary ECoG electrodes in a glass brain. B shows an example time-frequency representation of cortical power (upper), cortical-basal ganglia coherence (middle), and the corresponding hypnogram (bottom) in a representative subject. C shows the decoding accuracies using DBS channel features, ECoG channel features, cortical-basal ganglia coherence features (COHY), DBS plus ECoG channel features, and all features together (ALL) in the contexts of within-subject decoding (left) and cross-subject decoding (right). The gray dashed horizontal lines indicate a chance accuracy of 33%. * P < 0.05, ** P < 0.01. D shows the feature importance when conducting cross-subject decoding with all features. ECoG features are as important as basal ganglia features (P = 0.993, Mann–Whitney U test), though both features are more important than coherence features, as shown in the inset. ns, non-significant.
Fig. 6
Fig. 6. Moderator analysis and network mapping of the decoding accuracies.
A Heatmap showing the influential factors of decoding accuracies in different contexts including within-subject decoding with basal ganglia data (DBS-INDIV), cross-subject decoding with basal ganglia data (DBS-CROSS), within-subject decoding with ECoG data (ECoG-INDIV), and cross-subject decoding with ECoG data (ECoG-CROSS). Candidate factors are elaborated on in the Methods section. The right side shows the regression plot which depicts the correlation between the number of sleep fragmentations and the decoding performances. Significant associations with p values < 0.0029 (0.05/17) were highlighted with asterisks. B shows the lateral and medial view of the optimal decoding map for the basal ganglia electrodes. The map was generated by first generating a volume of tissue recorded with a radius of 5 mm for each contact and then calculating the connectivity pattern between the seed volume and the normative functional MRI connectome. The obtained whole-brain connectivity strength was then voxel-wised correlated with the decoding accuracy, resulting in the final optimal decoding map. Increased projection to the purple area indicates a higher chance to obtain good decoding results while increased projection to the blue area indicates a lower chance to obtain good decoding results. The right panel shows the repeated measurement regression plot between the spatial similarity to the optimal map and the decoding accuracies obtained in a leave-one-subject-out manner.
Fig. 7
Fig. 7. External validation for the BGOOSE.
A shows the average accuracy for the BGOOSE to classify sleep stages in two external cohorts with basal ganglia recordings during sleep. The lower and upper borders of the box represent the 25th and 75th percentiles, respectively. The centerline represents the median. The whiskers extend to the smallest and largest data points that are not outliers (1.5 times the interquartile range). The black dashed line represents the chance accuracy of 33%. B shows the decoding confusion matrices for each of the 15 unseen subjects in the two cohorts. C demonstrates the repeated measurement correlation between spatial similarity to the optimal map and the decoding accuracy. The upper inset shows the medial, posterior, and dorsal views of the optimal decoding map. D shows the correlation between spatial similarity and decoding accuracy in one representative patient (Ts#10). The channel with higher decoding accuracy (upper inset) has higher whole-brain projection similarity to the optimal map than the channel with lower decoding accuracy (bottom inset). E shows the comparison between mean accuracy values obtained from optimal-map selected channels (Opt.map), channels with worst decoding performances (Min), all channels (Avg), “sandwich” referenced channels (Sand), and channels with best decoding performances (Max). Same conventions as in Fig. 7A. P = 9.82×10⁻⁴ for the comparison of accuracy between map-based channels and worst decoding channels. P = 2.01×10⁻³ for the comparison of accuracy between map-based channels and all channels. P = 3.02×10⁻² for the comparison of accuracy between map-based channels and sandwich re-referenced channels. P = 7.69×10⁻³ for the comparison of accuracy between map-based channels and best decoding channels. Wilcoxon signed-rank test.
Fig. 8
Fig. 8. Pipeline for the optimal use of BGOOSE.
A pipeline summarizing the main function of BGOOSE and how can it be optimally used.

References

    1. da Silva AA, et al. Sleep duration and mortality in the elderly: A systematic review with meta-analysis. BMJ Open. 2016;6:e008119. doi: 10.1136/bmjopen-2015-008119. - DOI - PMC - PubMed
    1. Devore EE, Grodstein F, Schernhammer ES. Sleep duration in relation to cognitive function among older adults: A systematic review of observational studies. Neuroepidemiology. 2016;46:57–78. doi: 10.1159/000442418. - DOI - PubMed
    1. Tobaldini E, et al. Short sleep duration and cardiometabolic risk: From pathophysiology to clinical evidence. Nat. Rev. Cardiol. 2019;16:213–224. doi: 10.1038/s41569-018-0109-6. - DOI - PubMed
    1. Chattu VK, et al. The global problem of insufficient sleep and its serious public health implications. Healthc. (Basel) 2018;7:1. - PMC - PubMed
    1. Garbarino S, Lanteri P, Durando P, Magnavita N, Sannita WG. Co-morbidity, mortality, quality of life and the healthcare/welfare/social costs of disordered sleep: A rapid review. Int. J. Environ. Res Public Health. 2016;13:831. doi: 10.3390/ijerph13080831. - DOI - PMC - PubMed