. 2024 May 10;15(1):3970.
doi: 10.1038/s41467-024-48261-w.

A time-resolved multi-omics atlas of transcriptional regulation in response to high-altitude hypoxia across whole-body tissues

Affiliations

A time-resolved multi-omics atlas of transcriptional regulation in response to high-altitude hypoxia across whole-body tissues

Ze Yan et al. Nat Commun. .

Abstract

High-altitude hypoxia acclimatization requires whole-body physiological regulation in highland immigrants, but the underlying genetic mechanism has not been clarified. Here we use sheep as an animal model for low-to-high altitude translocation. We generate multi-omics data including whole-genome sequences, time-resolved bulk RNA-Seq, ATAC-Seq and single-cell RNA-Seq from multiple tissues as well as phenotypic data from 20 bio-indicators. We characterize transcriptional changes of all genes in each tissue, and examine multi-tissue temporal dynamics and transcriptional interactions among genes. Particularly, we identify critical functional genes regulating the short response to hypoxia in each tissue (e.g., PARG in the cerebellum and HMOX1 in the colon). We further identify TAD-constrained cis-regulatory elements, which suppress the transcriptional activity of most genes under hypoxia. Phenotypic and transcriptional evidence indicate that antenatal hypoxia could improve hypoxia tolerance in offspring. Furthermore, we provide time-series expression data of candidate genes associated with human mountain sickness (e.g., BMPR2) and high-altitude adaptation (e.g., HIF1A). Our study provides valuable resources and insights for future hypoxia-related studies in mammals.


Conflict of interest statement

The authors declare no competing interests.

Figures
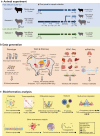
Fig. 1
Fig. 1. Schematic diagram of the study.
a Design of the animal translocation experiment. Hu sheep (gray) and Tibetan sheep (black) originally inhabited low-altitude and high-altitude environments, respectively. There were three scenarios examined in our experiment: low-altitude Hu sheep raised in the lowlands (scenario 1); high-altitude Hu sheep, namely low-altitude Hu sheep that were translocated to the highlands (scenario 2) and acclimatized until four time points; and Tibetan sheep raised in highlands (scenario 3). In addition, offspring of the ewes in the above three scenarios were included. b Sample collection and data generation. We collected 19 whole-body tissues and produced phenotypic, genomic (WGS), transcriptomic (bulk-RNA, single-cell RNA), and epigenetic (ATAC-Seq) data. Tissue marked in red (i.e., heart) was used for generating WGS data. c Major bioinformatics and statistical analysis involved in the study.
Fig. 2
Fig. 2. Characteristics of phenotype and gene expression.
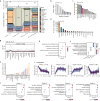
a Changes in blood oxygen saturation [SpO2, average value with 95% confidence interval (CI)] with acclimatization time. Hu sheep (n = 10): 0 d, 97.30 (CI: 96.68 − 97.92); 7 d, 82.51 (CI: 81.87 − 83.15); 14 d, 83.67 (CI: 82.68 − 84.66); 21 d, 85.38 (CI: 84.24 − 86.52); 8 mon, 87.0 (CI: 86.03 − 87.97); and Tibetan sheep (n = 10): 92.65 (CI: 91.68 − 93.62). Boxplots are represented by minima, 25% quantile, median, 75% quantile, and maxima with data points. b, c Changes in the nitric oxide synthetase (NOS) (b) and cardiac enzyme (CK) (c) values (average value with 95% CI) over time. In b, Hu sheep (n = 10): 0 d, 7.05 µmol/L (CI: 6.69 − 7.41); 7 d, 5.71 µmol/L (CI: 5.17 − 6.25); 14 d, 5.23 µmol/L (CI: 5.03 − 5.43); 21 d, 5.78 µmol/L (CI: 5.33 − 6.23); 8 mon, 5.43 µmol/L (CI: 5.07 − 5.79); and Tibetan sheep (n = 10), 6.40 µmol/L (CI: 5.88 − 6.92). In c, Hu sheep (n = 10): 0 d, 62.1 U/L (CI: 48.64 − 75.56); 7 d, 60.0 U/L (CI: 40.45 − 79.55); 14 d, 64.2 U/L (CI: 56.87 − 71.53); 21 d, 55.2 U/L (CI: 44.64 − 65.76); 8 mon, 53.3 U/L (CI: 44.91 − 61.69); and Tibetan sheep (n = 10), 146.7 U/L (CI: 69.15 − 224.25). P values in the figures ac come from the two-sided Wilcoxon rank sum test. d t-distributed stochastic neighbor embedding (t-SNE) clustering of 1277 RNA-Seq samples. e Association between gene modules and bio-indicators in blood. The rows represent the 14 gene modules (i.e., M1-M14), and the columns show 19 bio-indicators. Multiple testing was corrected using the Benjamini-Hochberg method. * FDR < 0.05. f Gene Ontology (GO) analysis for M3. g Gene examples in M3. Scatter plots show the Pearson’s correlation between the expression levels of genes and the values of bio-indicators over time. The two-sided P values are calculated by the linear regression model. Source Data are provided as Source Data file.
Fig. 3
Fig. 3. Transcriptome dynamics during hypoxia acclimatization.
a Numbers of differentially expressed genes (DEGs) (top) and percentages of DEGs (bottom) between adjacent time points comparisons across tissues. b Distribution of DEGs across numerous tissues in the “0 d vs. 7 d” comparison. c, d Numbers of tissue-shared (c) and tissue-specific (d) DEGs across tissues in the “0 d vs. 7 d” comparison. e, f GO term enrichments for tissue-shared (e) and tissue-specific (f) DEGs from the “0 d vs. 7 d” comparison. g Multi-tissue interactions in the “0 d vs. 7 d” comparison. The average log2FC value for cluster 5 is denoted with a black line. Active tissues (i.e., cerebellum, kidney, and colon) are marked with asterisks, and the interaction of NOTCH1 between tissues is highlighted with a red line. h Numbers of dynamically changed genes (DCGs) across tissues. i Fuzzy c-means clustering identified gene expression patterns of DCGs in the cerebellum. j GO terms for the four clusters identified in (i). Source Data are provided as Source Data file.
Fig. 4
Fig. 4. Hypoxia-adaptive genes in adaptation and acclimatization.
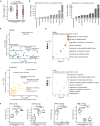
a Distribution of FST genes among differentially expressed genes (DEGs) between breeds (i.e., low-altitude Hu sheep vs. Tibetan sheep) across tissues. b Distribution of FST genes in DCGs across tissues. c Venn diagram showing the intersection of multi-tissue FST genes in inter-breed DEGs with those in DCGs. P value is calculated by two-sided permutation test. d-e, Examples of common multi-tissue FST genes. P value was calculated by permutation test with 1000 times shuffle. d Expression changes in APOLD1 (left) and NR4A3 (right) over time across tissues. expr, expression. e Phenome-wide association analysis (Phe-WAS) for APOLD1 (top) and NR4A3 (bottom). N is the sample size of GWAS. P values are calculated by two-sided Chi-square test and multiple correction is used Benjamini-Hochberg method. Source Data are provided as Source Data file.
Fig. 5
Fig. 5. Chromatin accessibility reveals the regulatory landscape of hypoxia acclimatization.
a Average peak density of each tissue at positions relative to transcription start site (TSS). b t-SNE clustering of 66 samples based on peak signal density. c, Pearson’s correlations between the numbers of expressed genes and detected peaks across tissues. The two-sided P values are calculated by the linear regression model. PCGs: protein coding genes. d Tissue-specific transcription factors (TFs) in differentially accessible regions (DARs) of the respective tissues and their gene expression over time. e Identification of common genes. f Numbers of up-regulated and down-regulated peak-gene pairs. g Common genes of liver from low-altitude Hu sheep vs. high-altitude Hu sheep comparison are enriched in biological processes related to the hypoxia response. h Examples of common up-regulated and down-regulated genes (n = 6). Peak density and expression level of the down-regulated common gene PPARG (top) in the liver and the up-regulated common gene LIMD1 (bottom) in the hypothalamus from low-altitude Hu sheep and high-altitude Hu sheep (8 mon) comparison. RefSeq, reference sequence. expr, expression. Boxplots are represented by minima, 25% quantile, median, 75% quantile, and maxima. Each dot represents individual expression level in different groups.
Fig. 6
Fig. 6. Acclimatization to high altitude in offspring.
a Changes in SpO2 in the three lamb groups. The average values with 95% confidence interval (CI) of SpO2 in lamb groups are: low-altitude Hu lamb (n = 6), 91.50 (CI: 90.63 − 92.37); high-altitude Hu lamb (n = 6), 85.92 (CI: 83.81 − 88.03); and Tibetan lamb (n = 6), 97.71 (CI: 85.87 − 89.55). b Numbers of DEGs from the high-altitude Hu lamb vs. low- altitude Hu lamb (left) and Tibetan lamb vs. low-altitude Hu lamb comparisons (right). c Common GO terms enriched with the DEGs of low-altitude Hu lambs vs. high-altitude Hu lambs and low-altitude Hu lambs vs. Tibetan lambs in the kidney (top) and cerebrum (bottom). d GO terms enriched only with the DEGs from the low-altitude Hu lamb and high-altitude Hu lamb comparison in artery (top) and lung (bottom). e Expression levels of key genes from hypoxia response-related GO terms (n = 6). expr, expression. Boxplots are represented by minima, 25% quantile, median, 75% quantile, and maxima. Each dot represents individual expression level in different groups. P values in the figures a and e come from the two-sided Wilcoxon rank sum test, “ns” indicates not significant. Source Data are provided as Source Data file.
Fig. 7
Fig. 7. Time-series transcriptome of genes implicated in adaptation and disease in human.
a Conservation of transcripts of 14 common tissues in human and sheep. t-SNE clustering of samples in our study (n = 1277) and the human GTEx v8 consortium (n = 6792) based on batch-corrected expression. Species (left) and tissue types (right) are distinguished by color. b Hierarchical clustering of common tissues in humans and sheep based on Pearson’s correlation of the median TPM value. c, d Gene examples for human pulmonary hypertension (i.e., BMPR2) and high-altitude adaptation (i.e., HIF1A). c Pearson’s correlation between humans and sheep based on the median value of BMPR2 (left). Expression patterns of BMPR2 in crucial tissues over time (right). The two-sided P values are calculated by the linear regression model. Shading: standard error of the fitting line. d, Similar to c, but for the HIF1A gene. e The expression of BMPR2 and HIF1A across cell types in the lung. AT1, alveolar type 1 cell; AT2, alveolar type 2 cell. f The expression of HIF1A in club cells (top) and classic monocytes (bottom) over time in the lung with a single replicate (n = 1). Boxplots are represented by minima, 25% quantile, median, 75% quantile, and maxima. g Cell-cell communication results for differentially expressed cell types from BMPR2 and HIF1A in adjacent time point comparisons. FIB, fibroblast; CM, mast cell; CLI, ciliated cell; AM, alveolar macrophage; PTC, proferating T cell; VEC, vein endothelial; NEUT, neutrophil; MES, mesenchymal cell; MC, mast cell; IM, interstitial macrophage. h Transcription factors (TFs) regulating HIF1A and BMPR2. Source Data are provided as Source Data file.

References

    1. Semenza GL. Oxygen sensing, hypoxia-inducible factors, and disease pathophysiology. Annu. Rev. Pathol. 2014;9:47–71. doi: 10.1146/annurev-pathol-012513-104720. - DOI - PubMed
    1. Ducsay CA, et al. Gestational Hypoxia and Developmental Plasticity. Physiol. Rev. 2018;98:1241–1334. doi: 10.1152/physrev.00043.2017. - DOI - PMC - PubMed
    1. Storz JF, Scott GR, Cheviron ZA. Phenotypic plasticity and genetic adaptation to high-altitude hypoxia in vertebrates. J. Exp. Biol. 2010;213:4125–4136. doi: 10.1242/jeb.048181. - DOI - PMC - PubMed
    1. Azad P, et al. High-altitude adaptation in human: from genomics to integrative physiology. J. Mol. Med. 2017;95:1269–1282. doi: 10.1007/s00109-017-1584-7. - DOI - PMC - PubMed
    1. Witt KE, Huerta-Sánchez E. Convergent evolution in human and domesticate adaptation to high-altitude environments. Philos. Trans. R. Soc. Lond. B. Biol. Sci. 2019;374:20180235. doi: 10.1098/rstb.2018.0235. - DOI - PMC - PubMed

Publication types