

Association between physical activity and thyroid function in American adults: a survey from the NHANES database
- PMID: 38730302
- PMCID: PMC11084014
- DOI: 10.1186/s12889-024-18768-4
Association between physical activity and thyroid function in American adults: a survey from the NHANES database
Abstract
Objective: Physical activity (PA) is closely related to our lives, and the effects of PA on thyroid function have not been elucidated.
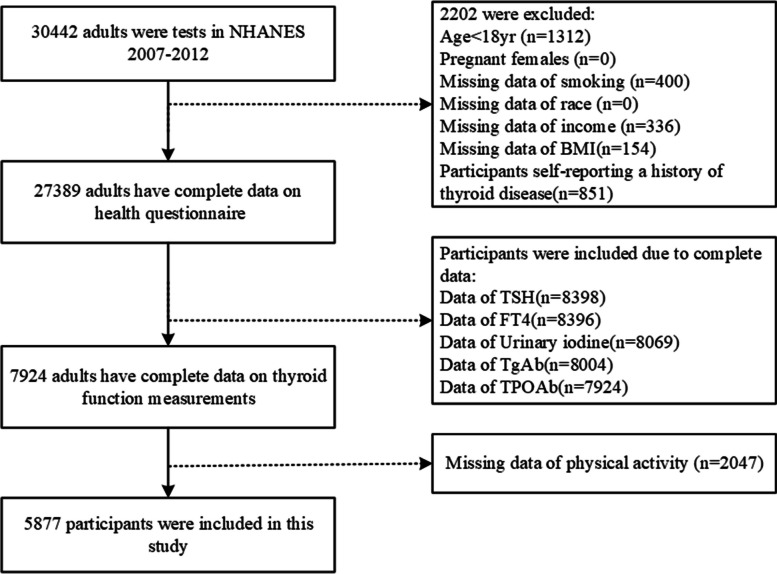
Methods: Using data from the National Health and Nutrition Examination Survey (NHANES) 2007-2012, we included 5877 participants and analyzed the associations of thyroid function with weekly physical activity (PAM, expressed in metabolic equivalents of task) and physical activity time (PAT) in American adults. Univariate and multivariate logistic analyses were used to demonstrate the associations of PAM and PAT with the primary outcome. Linear regression analysis was performed to determine the associations between thyroid biochemical indicators/diseases and PAM/PAT.
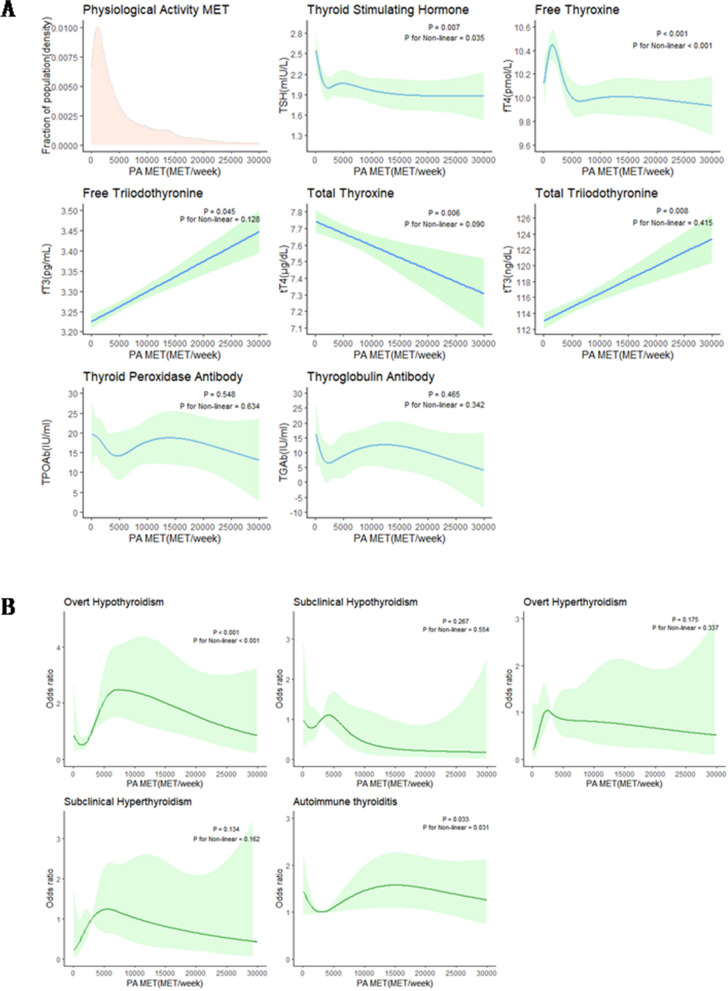
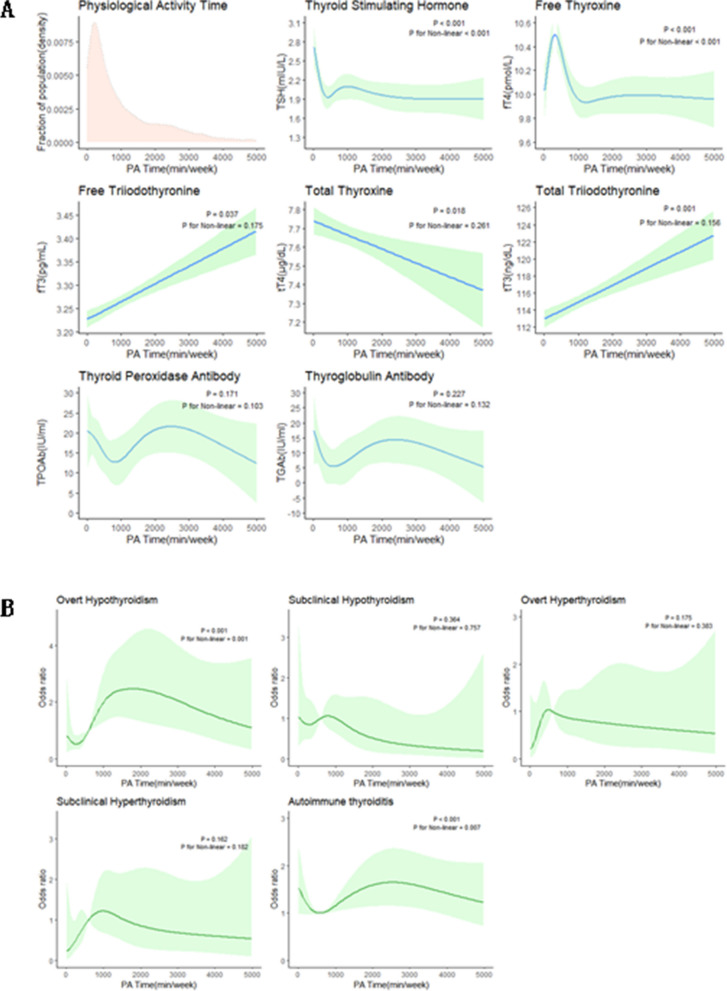
Results: Our study revealed noticeable sex differences in daily PA among the participants. The odds ratio of the fourth versus the first quartile of PAM was 3.07 (confidence interval, CI [1.24, 7.58], p = 0.02) for overt hypothyroidism, 3.25 (CI [1.12, 9.45], p = 0.03) for subclinical hyperthyroidism in adult men. PAT in the range of 633-1520 min/week was found to be associated with the occurrence of subclinical hyperthyroidism [p < 0.001, OR (95% CI) = 5.89 (1.85, 18.80)], PAT of the range of > 1520 min/week was found to be associated with the occurrence of overt hypothyroidism [p < 0.001, OR (95% CI) = 8.70 (2.80, 27.07)] and autoimmune thyroiditis (AIT) [p = 0.03, OR (95% CI) = 1.42 (1.03, 1.97)] in adult men. When PAM < 5000 MET*minutes/week or PAT < 1000 min/week, RCS showed an L-shaped curve for TSH and an inverted U-shaped curve for FT4. The changes in FT3 and TT3 in men were linearly positively correlated with PAM and PAT, while TT4 is linearly negatively correlated.
Conclusion: The amount of daily physical activity of American adults is strongly associated with changes in thyroid function, including thyroid hormone levels and thyroid diseases. Thyroid hormone levels were varied to a certain extent with changes in PAM and PAT.
Keywords: American adults; NHANES; Physical activity; TSH; Thyroid function.
© 2024. The Author(s).
Conflict of interest statement
The authors have no competing interests to report.
Figures
References
Publication types
MeSH terms
LinkOut - more resources
Full Text Sources
Medical
Miscellaneous
