. 2024 May 10;23(1):99.
doi: 10.1186/s12943-024-02017-8.

Multiomics-based molecular subtyping based on the commensal microbiome predicts molecular characteristics and the therapeutic response in breast cancer

Affiliations

Multiomics-based molecular subtyping based on the commensal microbiome predicts molecular characteristics and the therapeutic response in breast cancer

Wenxing Qin et al. Mol Cancer. .

Abstract

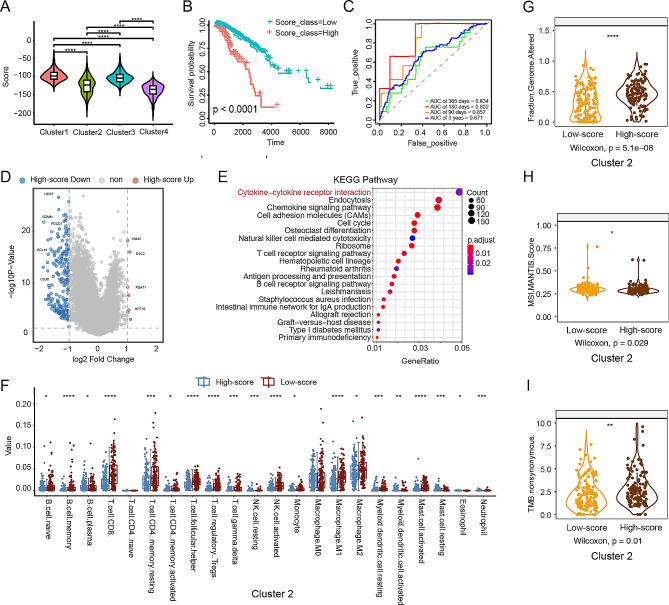
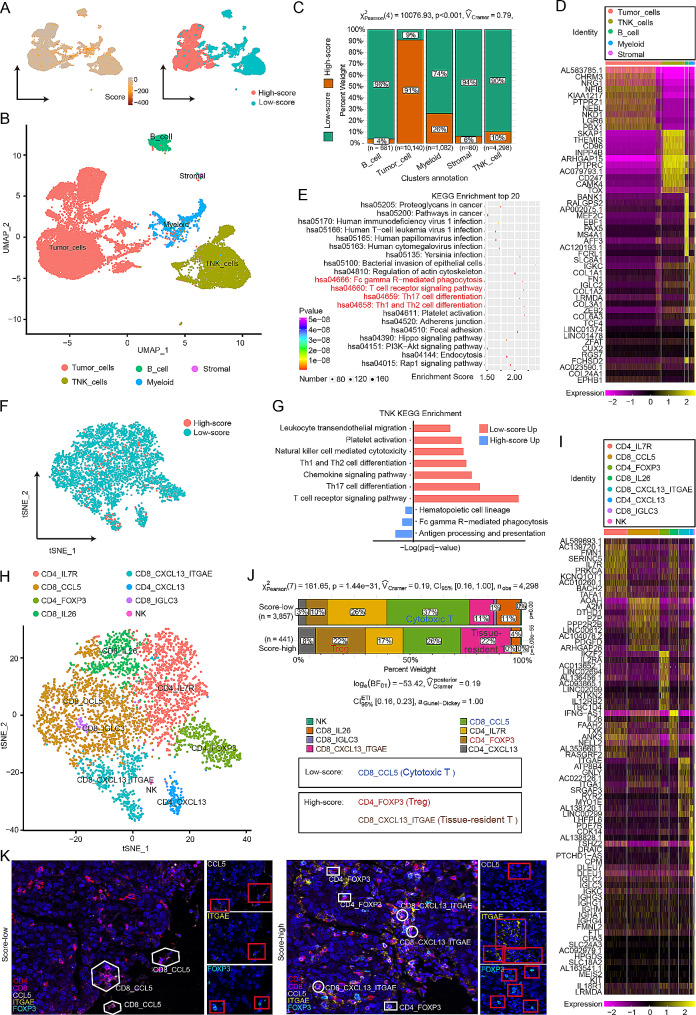
The gut microbiota has been demonstrated to be correlated with the clinical phenotypes of diseases, including cancers. However, there are few studies on clinical subtyping based on the gut microbiota, especially in breast cancer (BC) patients. Here, using machine learning methods, we analysed the gut microbiota of BC, colorectal cancer (CRC), and gastric cancer (GC) patients to identify their shared metabolic pathways and the importance of these pathways in cancer development. Based on the gut microbiota-related metabolic pathways, human gene expression profile and patient prognosis, we established a novel BC subtyping system and identified a subtype called "challenging BC". Tumours with this subtype have more genetic mutations and a more complex immune environment than those of other subtypes. A score index was proposed for in-depth analysis and showed a significant negative correlation with patient prognosis. Notably, activation of the TPK1-FOXP3-mediated Hedgehog signalling pathway and TPK1-ITGAE-mediated mTOR signalling pathway was linked to poor prognosis in "challenging BC" patients with high scores, as validated in a patient-derived xenograft (PDX) model. Furthermore, our subtyping system and score index are effective predictors of the response to current neoadjuvant therapy regimens, with the score index significantly negatively correlated with both treatment efficacy and the number of immune cells. Therefore, our findings provide valuable insights into predicting molecular characteristics and treatment responses in "challenging BC" patients.


Conflict of interest statement

All authors declare no competing interests associated with this study.

Figures

Fig. 1
Fig. 1
Gut microbiota characteristics and clustering analysis based on machine learning in BC, GC, and CRC patients. (A) Flowchart of the gut microbiota analysis. (B-D) The importance of the significantly different genera in CRC, GC and BC patients. Up: significantly upregulated genes in cancer; Down: significantly downregulated genes in cancer. (E-G) Clustering of CRC, GC and BC samples based on the self-organizing map (SOM) method. All three cancer cohorts were divided into three clusters, denoted G1, G2, and G3. Fusobacterium and Escherichia Shigella were the key genera marking the clusters of CRC patients. Faecalibacterium and Escherichia Shigella were key genera marking the clusters of GC patients. Prevotella_9 and Escherichia Shigella were key genera marking the clusters of BC patients. (H) Venn diagram of the significantly different bacterial genera among the three cancers. The differences in the overlapping bacterial genera among the three cancers were not extensive, with nearly half of the genera unique to each cancer, a phenomenon possibly related to tumour specificity. (I) Heatmap of the differentially enriched metabolic pathways among the clusters in the three cancers. The microbial functions in the BC cohort were similar to those in the CRC and GC cohorts
Fig. 2
Fig. 2
Distinct features of the BC subtypes constructed based on the commensal microbiome and metabolic pathways and genes significantly associated with survival. (A) Flowchart of the TCGA-BRCA dataset analysis. Based on the significance of the identified pancancer pathways, we selected genes associated with those pathways and filtered for pathways significantly correlated with survival. (B) Survival curves for the BC clusters. The prognostic outcomes varied significantly, with Cluster 4 displaying the best prognosis and Cluster 1 the poorest. (C-E) Proportions and chi-square test P values based on the traditional molecular subtypes, clinical stage, and TNBC status in each cluster of BC patients. (F-I) Boxplots of the TMB, aneuploidy score, fraction of genome altered, and MSIsensor score for the BC clusters at the genomic level. Cluster 2 had the highest values, and Cluster 4 had the lowest values. (J-M) Boxplots of CD4 + T-cell, CD8 + T-cell, neutrophil, and myeloid dendritic cell counts for the BC clusters at the immune level. Cluster 2 had the highest abundances among the clusters. **** P < 0.0001. *** P < 0.001. **P < 0.01. *P < 0.05. ns, P > 0.05
Fig. 3
Fig. 3
Identification and prognostic analysis of the “challenging BC” subtype and the molecular characteristics of this subtype. (A) Violin plots showing the distribution of scores across the four clusters. (B) Survival curves for the low-score and high-score groups. Patients in the high-score group exhibited poorer survival outcomes. (C) The predictive value of the score in the TCGA-BRCA cohort (AUCs: 0.857, 0.802, 0.634 and 0.671; 90-, 180- and 365-day OS, respectively). (D) Volcano plot of the DEGs between the high-score and low-score groups. Red indicates significantly upregulated genes in the high-score group, and blue indicates significantly upregulated genes in the low-score group. (E) Bar plot of differentially enriched pathways between the high-score and low-score groups. The pathways associated with cancer were significantly enriched in the high-score group, accompanied by significantly higher scores. (F) Comparison of immune cell populations in Cluster 2 between the high-score and low-score groups. (G-I) Boxplots showing the fraction of genome alterations, TMB, MSI MANTIS score and nonsynonymous TMB between the high-score and low-score groups for the BC clusters at the genomic level. The high-score group in Cluster 2 had significantly greater values of these parameters, indicating a greater mutation burden in patients in the high-score group. *** P < 0.001. **P < 0.01. *P < 0.05
Fig. 4
Fig. 4
Analysis of relevant factors in “challenging BC” at the single-cell level. (A) Uniform manifold approximation and projection (UMAP) plot showing the scores in all the clusters of single-cell sequencing data. (B) UMAP plot showing the 5 cell types identified by integrated analysis of all the clusters. (C) Heatmap showing the expression of marker genes in the indicated cell types. The bar across the top labels the clusters corresponding to specific cell types. (D) Bar plot sho wing the percentages of the annotated cell types derived from samples with high scores and samples with low scores. I Bubble charts showing the KEGG enrichment of the DEGs between the high-score group and low-score group in all clusters. (F) T-distributed stochastic neighbour embedding (t-SNE) plot showing the scores for the TNK cell types. (G) Bar graphs showing the KEGG enrichment of the TNK cell types in the high-score group and low-score group. (H) t-SNE plot showing 8 cell types identified by integrated analysis of the TNK cell types. (I) Heatmap showing the expression of marker genes in the TNK cell types. The bars on the left label the clusters corresponding to specific cell types. (J) Bar plot indicating the percentages of annotated TNK cell types derived from samples in the high-score and low-score groups. (K) Representative multispectral images of 5 markers in tumour tissues. DAPI: cyan; CD4: red; CD8: purple; CCL5: pink; ITGAE: yellow; and FOXP3: blue
Fig. 5
Fig. 5
Single-cell spatial transcriptome analysis of “challenging BC” patients. (A) UMAP plot demonstrating the cell distribution and score variance in 4 primary tumour tissues, colour-coded by the annotated cell type and score group. (B) UMAP plots and spatial feature plots demonstrating the cell distribution in every tumour tissue, colour-coded by the annotated cell type. (C) Bar charts and spatial feature plots showing the differences in the percentages of tumour cells, TNK cells, CD8 + CCL5 cells, CD4 + FOXP3 cells, and CD8 + CXCL13 + ITGAE cells between the selected tissue sections. (D) Scatter plots and spatial feature plots showing the relationships between ARHGAP15 tumour cells and CD8 + CCL5 immune cells. The scatter plots were generated with data from the TCGA cohort. (E) Scatter plots and spatial feature plots showing the relationships among TPK1, FOXP3 and ITGAE. The scatter plots were generated with data from the TCGA cohort. (F) Bar graphs showing the pathways associated with the differences identified by KEGG analysis between ARHGAP15 tumour cells and CD8 + CCL5 immune cells. (G) Bar graphs showing the pathways associated with the differences identified by KEGG analysis between TPK1 + tumour cells and CD4 + FOXP3 immune cells. (H) Bar graphs showing the pathways associated with the differences identified by KEGG analysis between TPK1 + tumour cells and CD8 + CXCL13 + ITGAE immune cells. (I) Schematic diagram showing the experimental procedure for the implantation of patient-derived xenografts (YZL-1) into NOG mice injected with placebo, sonidegib (20 mg/kg), or rapamycin (10 mg/kg) (n = 5 mice per group). Student’s test; ***P < 0.001. The data are presented as the means ± SDs. (J) Tumour images and tumour volume curve showing the changes in tumour volume after treatment with sonidegib (20 mg/kg). Student’s test; ***P < 0.001. The data are presented as the means ± SDs. (K) Tumour images and tumour volume curve showing the changes in tumour volume after treatment with rapamycin (10 mg/kg). Student’s test; ***P < 0.001. The data are presented as the means ± SDs.
Fig. 6
Fig. 6
Patients with different molecular subtypes exhibit varied responses to and efficacies of neoadjuvant therapy. (A) Principal coordinate analysis was performed based on the Bray‒Curtis distance matrix generated from the clusters in the neoadjuvant therapy cohort. We selected 221 samples from patients who underwent neoadjuvant therapy (anthracycline and/or taxane-based therapy) to assess the impact of molecular subtype on treatment response and efficacy. (B-E) Proportions and chi-square P values for stage (P = 0.56, 95% CIs [0.00, 1.00]), TNBC status (P = 1.25e-09, 95% CIs [0.30, 1.00]), traditional molecular subtype (P = 1.19e-11, 95% CIs [0.26, 1.00]) and therapeutic response (P = 3.59e-03, 95% CIs [0.00, 1.00]) in each cluster. Upon molecular subtyping and evaluation of molecular features, we found consistent results in the new dataset, with Cluster 2 showing enrichment in TNBC samples compared with samples of other subtypes. (F-J) Boxplots showing the difference in the score between the pCR and RD groups in each cluster and in TNBC samples in Cluster 2. The four clusters exhibited different responses to treatment, with significantly higher scores in the RD group in Clusters 1, 2, and 4 (but not in Cluster 3). Similar patterns were observed in the TNBC samples. (K) Volcano plot of the differentially expressed genes between the pCR and RD groups in TNBC samples. Genes significantly upregulated in the pCR group are shown in red, and those significantly upregulated in the RD group are shown in blue. (L) Bar plot of differentially enriched pathways between the pCR and RD groups in TNBC samples. Immune activation-related pathways were significantly enriched in the pCR group. (M) Correlation analysis between the highly expressed genes in the pCR group and the score revealed a significant negative correlation, indicating that as the score decreased, immune-activating gene expression increased. *** P < 0.001. **P < 0.01. *P < 0.05

References

    1. Park EM, et al. Targeting the gut and tumor microbiota in cancer. Nat Med. 2022;28(4):690–703. doi: 10.1038/s41591-022-01779-2. - DOI - PubMed
    1. Lee KA, et al. The gut microbiome: what the oncologist ought to know. Br J Cancer. 2021;125(9):1197–209. doi: 10.1038/s41416-021-01467-x. - DOI - PMC - PubMed
    1. Yu J, et al. Bifidobacterium longum promotes postoperative liver function recovery in patients with hepatocellular carcinoma. Cell Host Microbe; 2023. - PubMed
    1. Amoroso C et al. The role of gut microbiota biomodulators on mucosal immunity and intestinal inflammation. Cells, 2020. 9(5). - PMC - PubMed
    1. Chidambaram SB et al. The influence of gut dysbiosis in the Pathogenesis and management of ischemic stroke. Cells, 2022. 11(7). - PMC - PubMed

Publication types

Substances