. 2024 May 9;23(1):83.
doi: 10.1186/s12943-024-01997-x.

Autologous patient-derived exhausted nano T-cells exploit tumor immune evasion to engage an effective cancer therapy

Affiliations

Autologous patient-derived exhausted nano T-cells exploit tumor immune evasion to engage an effective cancer therapy

José L Blaya-Cánovas et al. Mol Cancer. .

Abstract

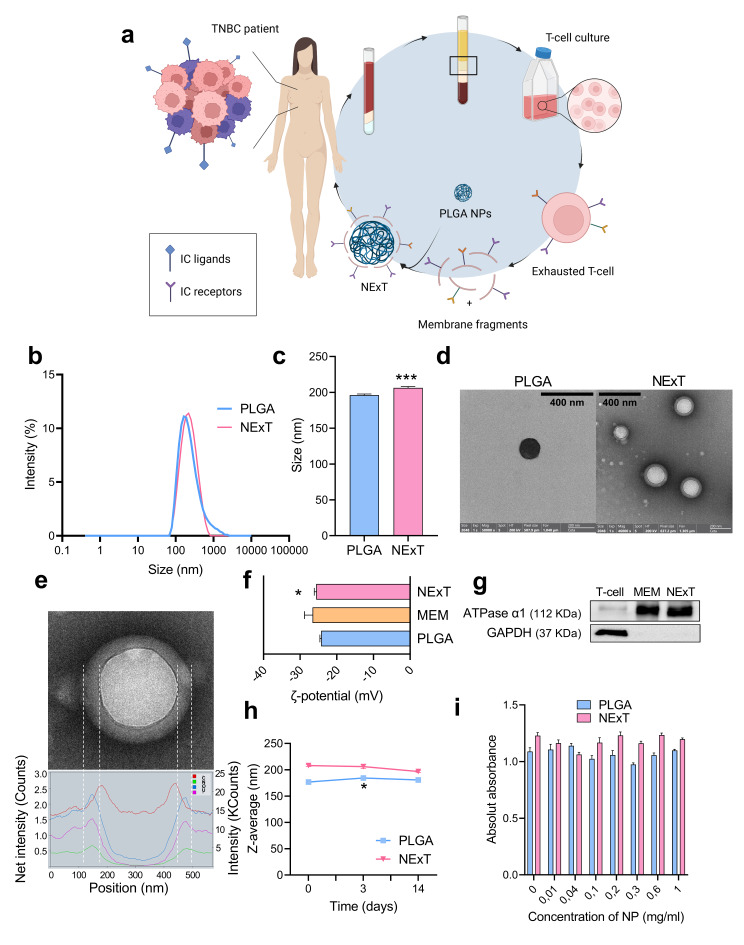
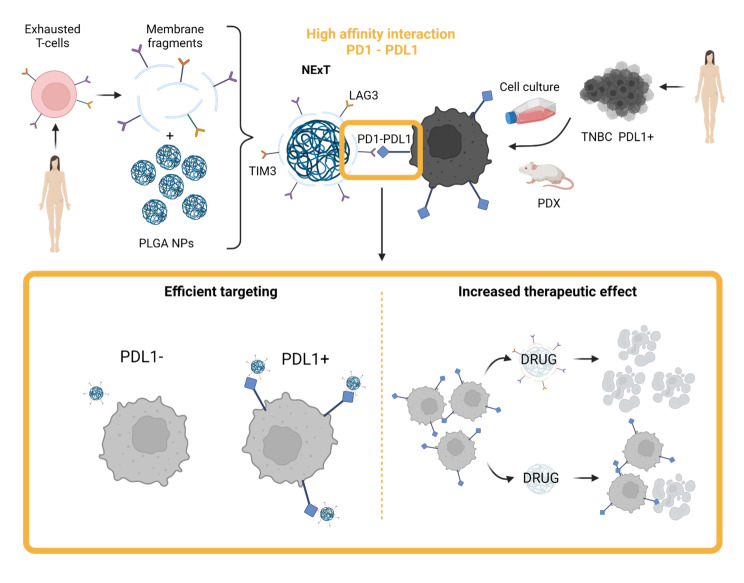
Background: Active targeting by surface-modified nanoplatforms enables a more precise and elevated accumulation of nanoparticles within the tumor, thereby enhancing drug delivery and efficacy for a successful cancer treatment. However, surface functionalization involves complex procedures that increase costs and timelines, presenting challenges for clinical implementation. Biomimetic nanoparticles (BNPs) have emerged as unique drug delivery platforms that overcome the limitations of actively targeted nanoparticles. Nevertheless, BNPs coated with unmodified cells show reduced functionalities such as specific tumor targeting, decreasing the therapeutic efficacy. Those challenges can be overcome by engineering non-patient-derived cells for BNP coating, but these are complex and cost-effective approaches that hinder their wider clinical application. Here we present an immune-driven strategy to improve nanotherapeutic delivery to tumors. Our unique perspective harnesses T-cell exhaustion and tumor immune evasion to develop a groundbreaking new class of BNPs crafted from exhausted T-cells (NExT) of triple-negative breast cancer (TNBC) patients by specific culture methods without sophisticated engineering.

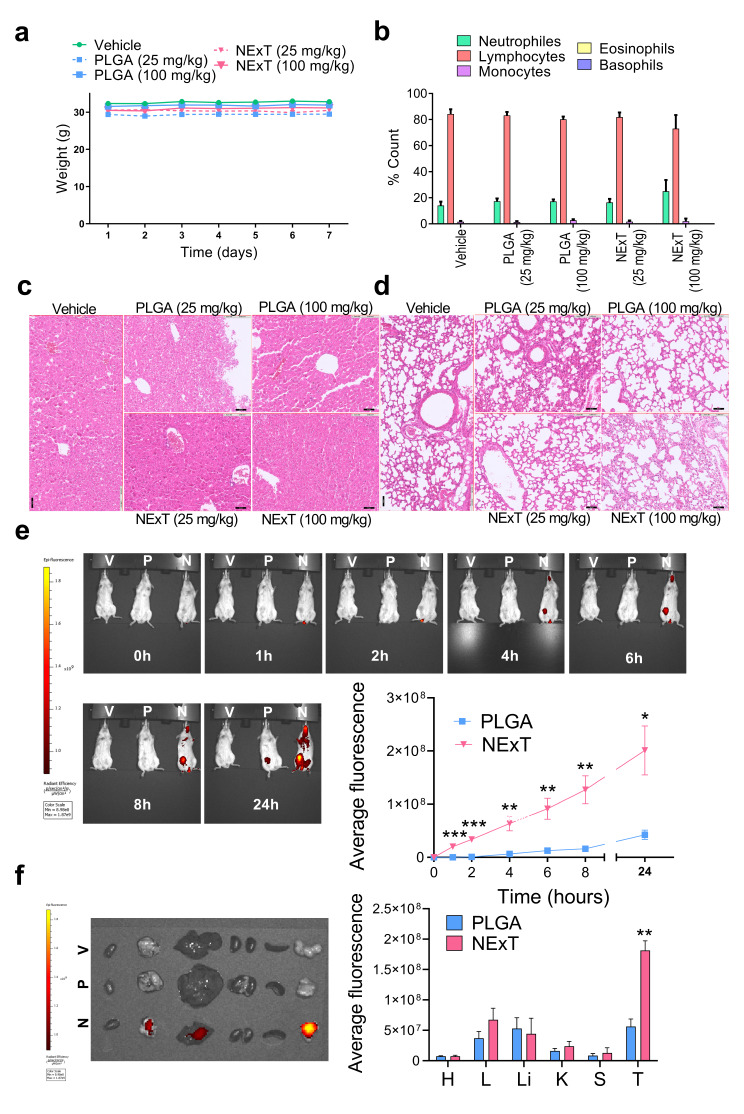
Methods: NExT were generated by coating PLGA (poly(lactic-co-glycolic acid)) nanoparticles with TNBC-derived T-cells exhausted in vitro by acute activation. Physicochemical characterization of NExT was made by dynamic light scattering, electrophoretic light scattering and transmission electron microscopy, and preservation and orientation of immune checkpoint receptors by flow cytometry. The efficacy of chemotherapy-loaded NExT was assessed in TNBC cell lines in vitro. In vivo toxicity was made in CD1 mice. Biodistribution and therapeutic activity of NExT were determined in cell-line- and autologous patient-derived xenografts in immunodeficient mice.

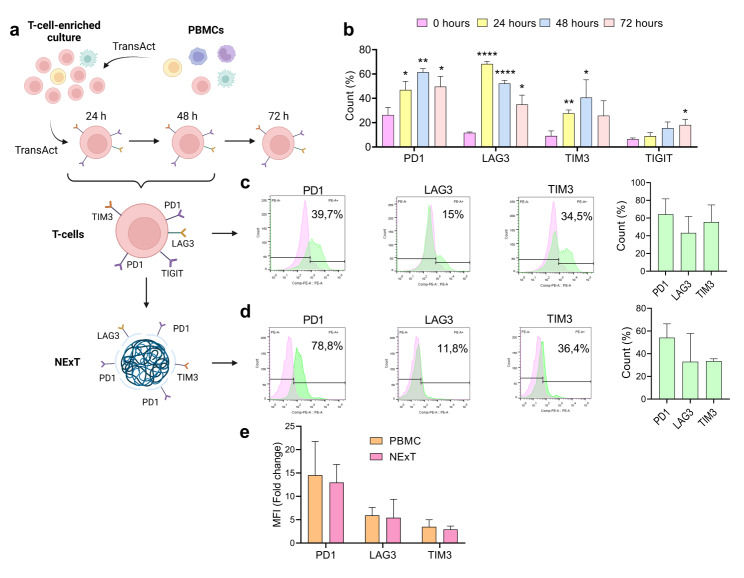
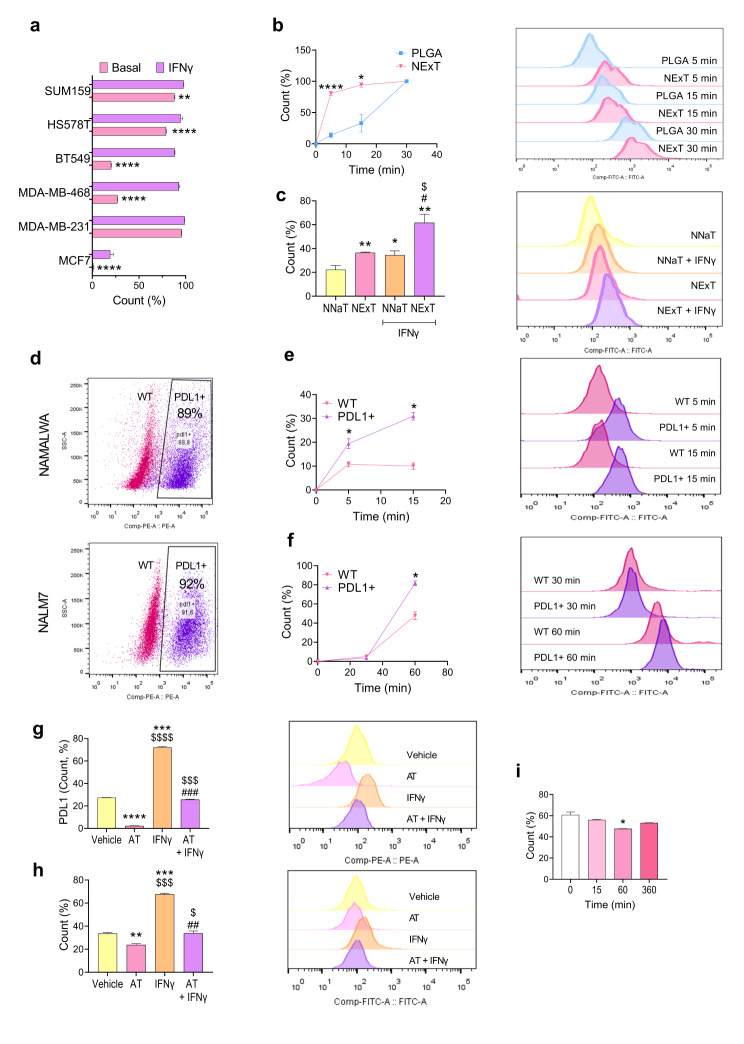
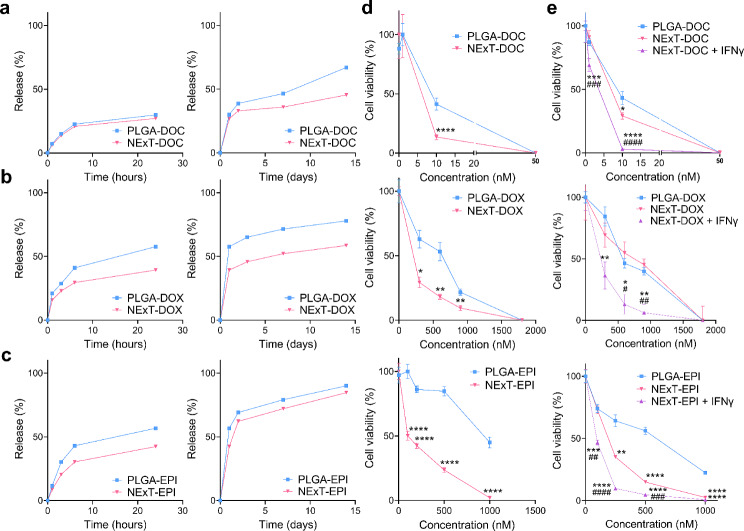
Results: We report a cost-effective approach with a good performance that provides NExT naturally endowed with immune checkpoint receptors (PD1, LAG3, TIM3), augmenting specific tumor targeting by engaging cognate ligands, enhancing the therapeutic efficacy of chemotherapy, and disrupting the PD1/PDL1 axis in an immunotherapy-like way. Autologous patient-derived NExT revealed exceptional intratumor accumulation, heightened chemotherapeutic index and efficiency, and targeted the tumor stroma in a PDL1+ patient-derived xenograft model of triple-negative breast cancer.

Conclusions: These advantages underline the potential of autologous patient-derived NExT to revolutionize tailored adoptive cancer nanotherapy and chemoimmunotherapy, which endorses their widespread clinical application of autologous patient-derived NExT.

Keywords: Biomimetic nanoparticles; Immune checkpoint; Immune evasion; Immunotherapy; PD1; PDL1; Patient-derived xenograft; T-cell exhaustion; Triple-negative breast cancer.


Conflict of interest statement

The authors declare no competing interests.

Figures

Fig. 1
Fig. 1
Synthesis and characterization of biomimetic nanoparticles. a Schematic illustration of the synthesis process of biomimetic nanoparticles coated with membranes of exhausted T-lymphocytes (NExT) from TNBC. b Size distribution of PLGA and NExT nanoparticles. c Average size of PLGA and NExT nanoparticles (n = 1 patient). Comparison with PLGA: ***p < 0.001. d TEM images of PLGA and NExT particles. e Chemical composition profile of NExT by TEM. f Zeta-potential of PLGA, membranes, and NExT (n = 1 patient) in MilliQ water (pH 6.6–6.8). Comparison with PLGA: *p < 0.05. g Western blot of the α1 subunit of ATPase (ATPase α1), and GAPDH in T-cells, T-cell membranes, and NExT. h Size (z-average) showing the stability of PLGA and NExT for 14 days in PBS (n = 1 patient). Comparison with day 0: *p < 0.05. i Toxicity of PLGA and NExT in SUM159 at different concentrations (n = 1 patient, six replicates). Data are represented as mean ± SEM. *p < 0.05, and ***p < 0.001
Fig. 2
Fig. 2
T-cell exhaustion and characterization of surface functionalization of NExT. a Schematic depicting the obtention of T-cell-enriched cultures, derived from TNBC patients, with high expression of immune checkpoint receptors for NExT preparation. b PD1, LAG3, TIM3, and TIGIT, and levels measured by flow cytometry in T-cell-enriched cultures after activation with TransAct at 0, 24, 48, or 72 h (n = 4 patients). c Representative flow cytometry histograms and PD1, LAG3, and TIM3 levels on the surface of cells (n = 3 patients) and d NExT derived from T-cell-enriched cultures re-activated and collected at 24 and 48 h (n = 3 patients) (green histograms) compared with their corresponding isotypes (pink histograms). e Mean of Fluorescence Intensity (MFI) fold change of surface PD1, LAG3, and TIM3 normalized with their corresponding (n = 3 patients). Data are represented as mean ± SEM. Comparison with baseline (0 h): *p < 0.05, **p < 0.01, and ****p < 0.0001
Fig. 3
Fig. 3
Functional characterization for tumor cell targeting by NExT. a Basal and IFNγ-induced (100 ng/ml for 24 h) PDL1 levels in different breast cancer cell lines. b Quantification and representative flow cytometry histograms of the percentage of cells positive for coumarin-6 after treatment with PLGA or NExT for 5 and 15 min in SUM159 cells (n = 2 patients). Comparison with PLGA: *p < 0.05 and ****p < 0.0001. c Quantification and representative flow cytometry histograms of the percentage of cells positive for coumarin-6 after treatment with PLGA NPs coated with membranes from T-cell enriched cultures (NNaT) or NExT in MDA-MB-468 cells stimulated or not with IFNγ (100 ng/ml for 24 h) for 15 min (n = 2 patients). Comparison with NNaT: *p < 0.05 and **p < 0.01; Comparison with NExT: $p < 0.05; Comparison with NNaT + IFNγ: #p < 0.05. d Representative dot plot of PDL1 levels in Namalwa and Nalm7 cells transduced with PDL1 plasmid (PDL1+) or wild type (WT). e Quantification and representative flow cytometry histograms of coumarin-6-positive cells after treatment with PLGA or NExT in Namalwa (WT and PDL1+) cells treated for 5 and 15 min, and f Nalm7 (WT and PDL1+) cells treated for 30 and 60 min (n = 2 patients). Comparison with WT: *p < 0.05. g Quantification and representative flow cytometry histograms of PDL1 levels and h percentage of coumarin-6-positive cells after treatment with NExT in MDA-MB-468 cells stimulated or not with IFNγ (100 ng/ml for 24 h) and blocked or not with atezolizumab (AT) (10 µg/ml for 24 h) for 15 min (n = 2 patients). Comparison with Vehicle: **p < 0.01, ***p < 0.001 and ****p < 0.0001; Comparison with AT: $$$p < 0.001 and $$$p < 0.0001; Comparison with IFNγ: ##p < 0.01 and ###p < 0.001. i PDL1 levels in SUM159 cells treated with NExT for 0, 15, 60, and 360 min. Comparison with basal levels (0 h): *p < 0.05. Data are represented as mean ± SEM.
Fig. 4
Fig. 4
In vitro therapeutic efficacy of NExT. aIn vitro release of docetaxel (DOC), b doxorubicin (DOX), and c epirubicin (EPI) for 1, 3, 6, and 24 h (left), and 1, 3, 7, and 14 days (right) in PBS Tween (0.1%) (pH 7.4) at 37 °C. d Cell proliferation of SUM159 cells and e MDA-MB-468 cells, stimulated or not with IFNγ (100 ng/ml), treated with PLGA NPs and NExT loaded with DOC, DOX, and EPI for 48 h (n = 3 patients, four replicates). Data are represented as mean ± SEM. Comparison with PLGA: *p < 0.05, **p < 0.01, ***p < 0.001, and ****p < 0.0001; Comparison with NExT: #p < 0.05, ##p < 0.01, ###p < 0.001, and ####p < 0.0001
Fig. 5
Fig. 5
In vivo safety, distribution and tumor targeting of NExT. a Weight, b Leukocyte formula, and c Representative images of livers and d lungs stained with hematoxylin/eosin (H&E) of CD1 mice treated with Vehicle, empty PLGA (25 and 100 mg/kg), and empty NExT (25 and 100 mg/kg) (n = 3 mice/group). Scale bar = 50 μm. e Representative images and in vivo quantification of intratumor accumulation of fluorescence in SUM159-xenograft mice treated with IR780-loaded PLGA (P) or NExT (N) or Vehicle (V) for 0, 1, 2, 4, 6, 8, and 24 h (n = 6 mice/group). f Representative images and quantification of fluorescence in the organs (Heart: H; Lung: L; Liver: Li; Kidneys: K; Spleen: S) and tumor (T) of mice treated with IR780-loaded PLGA (P) or NExT (N) or Vehicle (V) for 24 h (n = 6 mice/group). Data are represented as mean ± SEM. *p < 0.05, **p < 0.01, and ***p < 0.001
Fig. 6
Fig. 6
Therapeutic efficiency of NExT in a PDX model of TNBC. a Schematic illustration of the therapeutic schedule for the PDX mouse model (UGR01). b Immunohistochemistry of ER (estrogen receptor) and PR (progesterone receptor) and assessment of negative HER2 amplification by FISH showing two copies of the gene (red) and centromere 17 (green) per nucleus (blue). Scale bar = 500 μm. c Representative confocal images of PDL1 (green) in the PDX model (UGR01) (original optical objective: 40×). Scale bar = 50 μm. d Tumor volume fold change of UGR01-PDX-bearing mice treated with Vehicle, free docetaxel (Free-DOC), docetaxel-loaded PLGA (PLGA-DOC), and docetaxel-loaded NExT (NExT-DOC) (n = 5 mice/group) and representative images of excised tumors at day 14. e Representative confocal images (original optical objective: 40×), H&E, and quantification (n = 5 mice/group) of Ki67 (green) in UGR01 PDX tumors. DiL was used to stain cell membranes. Scale bar = 50 μm. Data are represented as mean ± SEM. Comparison with Vehicle: **p < 0.01, and ***p < 0.001; Comparison with Free-DOC: #p < 0.05, and ###p < 0.001; Comparison with PLGA-DOC: $$p < 0.01, and $$$p < 0.001
Fig. 7
Fig. 7
PDL1 and stromal α-SMA expression in the PDX tumor tissue. a Representative confocal images (original optical objective: 20×) and quantification of PDL1 and b stromal α-SMA in UGR01 PDX tumors (n = 3 mice/group). Scale bar = 50 μm. Comparison with Vehicle: **p < 0.01, and ****p < 0.0001; Comparison with Free-DOC: ##p < 0.01, and ####p < 0.0001; Comparison with PLGA-DOC: $$p < 0.01, and $$$$p < 0.0001
Fig. 8
Fig. 8
Schematic illustration of conclusions

References

    1. Shi J, Kantoff PW, Wooster R, Farokhzad OC. Cancer nanomedicine: progress, challenges and opportunities. Nat Rev Cancer. 2017;17:20–37. doi: 10.1038/nrc.2016.108. - DOI - PMC - PubMed
    1. Sau S, Petrovici A, Alsaab HO, Bhise K, Iyer AK. PDL-1 antibody drug conjugate for selective chemo-guided Immune Modulation of Cancer. Cancers (Basel) 2019;11:232. doi: 10.3390/cancers11020232. - DOI - PMC - PubMed
    1. Rosenblum D, Joshi N, Tao W, Karp JM, Peer D. Progress and challenges towards targeted delivery of cancer therapeutics. Nat Commun. 2018;9:1410. doi: 10.1038/s41467-018-03705-y. - DOI - PMC - PubMed
    1. Hu C-MJ, Zhang L, Aryal S, Cheung C, Fang RH, Zhang L. Erythrocyte membrane-camouflaged polymeric nanoparticles as a biomimetic delivery platform. Proc Natl Acad Sci U S A. 2011;108:10980–5. doi: 10.1073/pnas.1106634108. - DOI - PMC - PubMed
    1. Cao H, Dan Z, He X, Zhang Z, Yu H, Yin Q, et al. Liposomes coated with isolated macrophage membrane can target lung metastasis of breast Cancer. ACS Nano. 2016;10:7738–48. doi: 10.1021/acsnano.6b03148. - DOI - PubMed

Publication types