

Differential Expression of LMNA/C and Insulin Receptor Transcript Variants in Peripheral Blood Mononuclear Cells of Leukemia Patients
- PMID: 38731097
- PMCID: PMC11084221
- DOI: 10.3390/jcm13092568
Differential Expression of LMNA/C and Insulin Receptor Transcript Variants in Peripheral Blood Mononuclear Cells of Leukemia Patients
Abstract
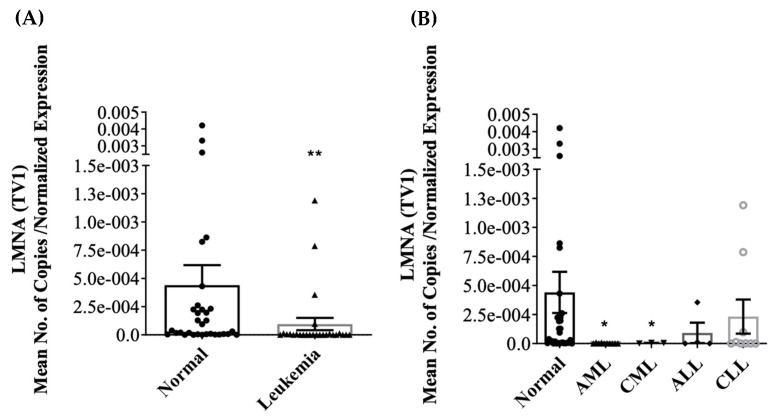
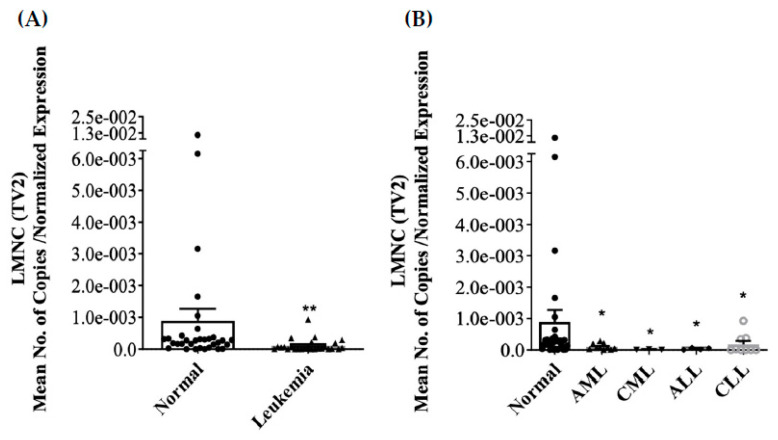
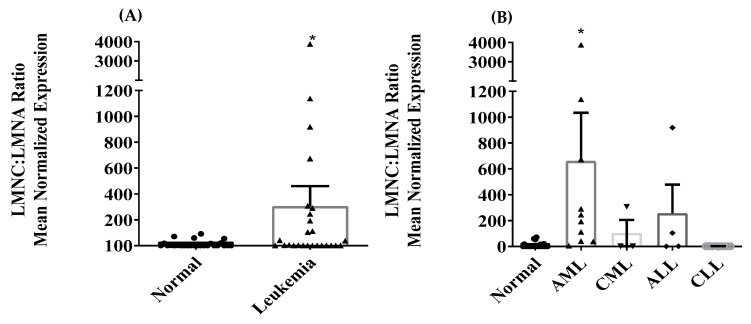
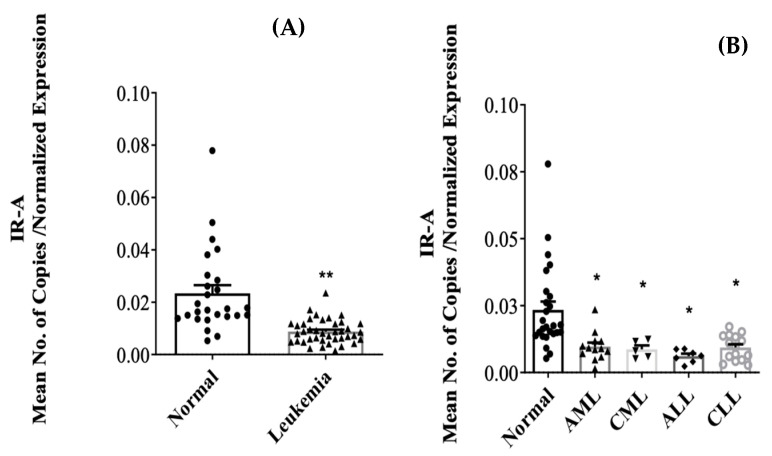
Background: Recent research has identified alternative transcript variants of LMNA/C (LMNA, LMNC, LMNAΔ10, and LMNAΔ50) and insulin receptors (INSRs) as potential biomarkers for various types of cancer. The objective of this study was to assess the expression of LMNA/C and INSR transcript variants in peripheral blood mononuclear cells (PBMCs) of leukemia patients to investigate their potential as diagnostic biomarkers. Methods: Quantitative TaqMan reverse transcriptase polymerase chain reaction (RT-qPCR) was utilized to quantify the mRNA levels of LMNA/C (LMNA, LMNC, LMNAΔ10, and LMNAΔ50) as well as INSR (IR-A and IR-B) variants in PBMCs obtained from healthy individuals (n = 32) and patients diagnosed with primary leukemias (acute myeloid leukemia (AML): n = 17; acute lymphoblastic leukemia (ALL): n = 8; chronic myeloid leukemia (CML): n = 5; and chronic lymphocytic leukemia (CLL): n = 15). Results: Only LMNA and LMNC transcripts were notably present in PBMCs. Both exhibited significantly decreased expression levels in leukemia patients compared to the healthy control group. Particularly, the LMNC:LMNA ratio was notably higher in AML patients. Interestingly, IR-B expression was not detectable in any of the PBMC samples, precluding the calculation of the IR-A:IR-B ratio as a diagnostic marker. Despite reduced expression across all types of leukemia, IR-A levels remained detectable, indicating its potential involvement in disease progression. Conclusions: This study highlights the distinct expression patterns of LMNA/C and INSR transcript variants in PBMCs of leukemia patients. The LMNC:LMNA ratio shows promise as a potential diagnostic indicator for AML, while further research is necessary to understand the role of IR-A in leukemia pathogenesis and its potential as a therapeutic target.
Keywords: LMNA/C transcript variants; insulin receptor transcript variants; leukemia; mononuclear cells.
Conflict of interest statement
The researchers in this study have no personal or financial conflicts of interest to declare, ensuring the impartiality and credibility of their work.
Figures
References
-
- Hamid G.A. Classification of acute leukemia. Ann. Intern. Med. 2011;87:740–753. - PubMed
-
- Laosai J., Chamnongthai K. Classification of acute leukemia using medical-knowledge-based morphology and CD marker. Biomed. Signal Process. Control. 2018;44:127–137. doi: 10.1016/j.bspc.2018.01.020. - DOI
-
- Taylor C.G., Stasi R., Bastianelli C., Venditti A., del Poeta G., Amadori S., Sargent J.M. Diagnosis and classification of the acute leukemias: Recent advances and controversial issues. Hematop. Mol. Hematol. 1996;10:1–38. - PubMed
LinkOut - more resources
Full Text Sources
Miscellaneous
