. 2024 May 4;29(9):2137.
doi: 10.3390/molecules29092137.

Pioglitazone Phases and Metabolic Effects in Nanoparticle-Treated Cells Analyzed via Rapid Visualization of FLIM Images

Affiliations

Pioglitazone Phases and Metabolic Effects in Nanoparticle-Treated Cells Analyzed via Rapid Visualization of FLIM Images

Biagio Todaro et al. Molecules. .

Abstract

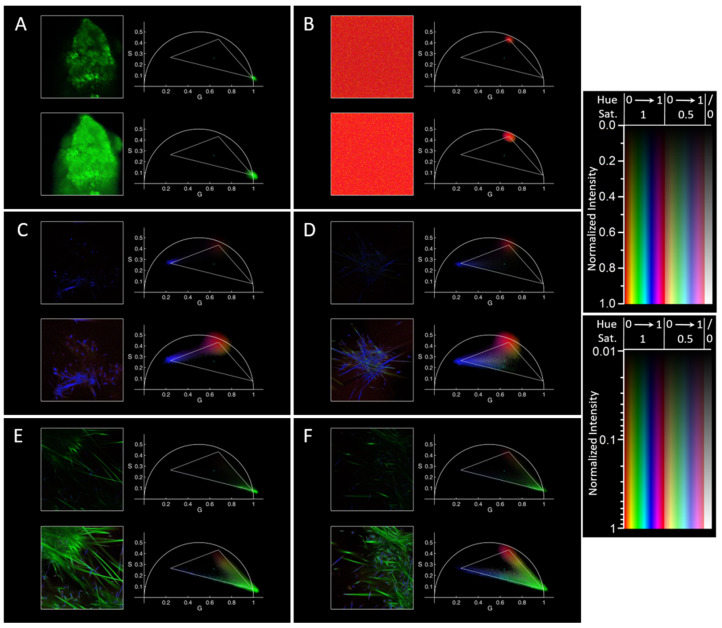
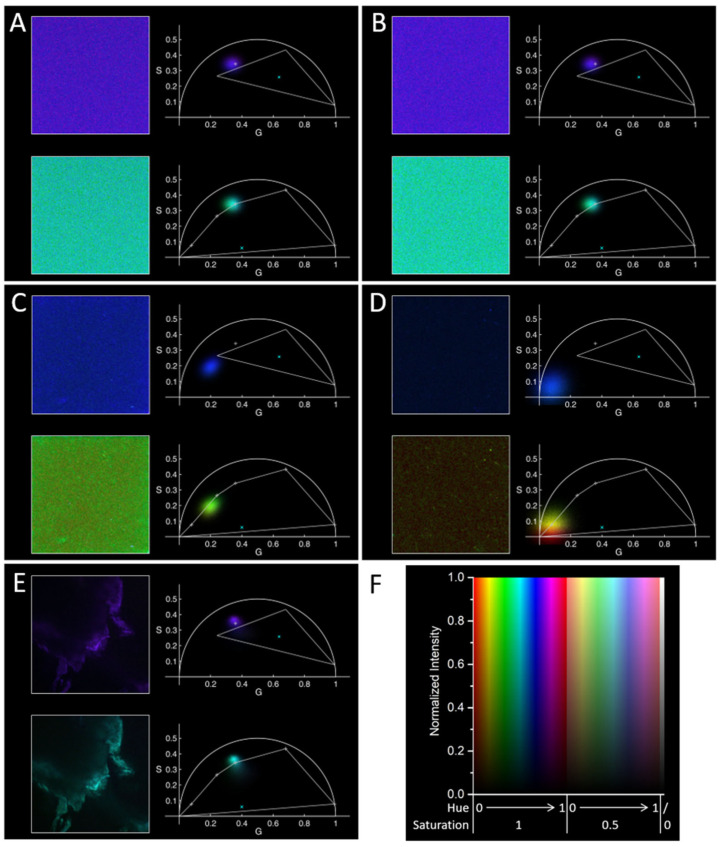
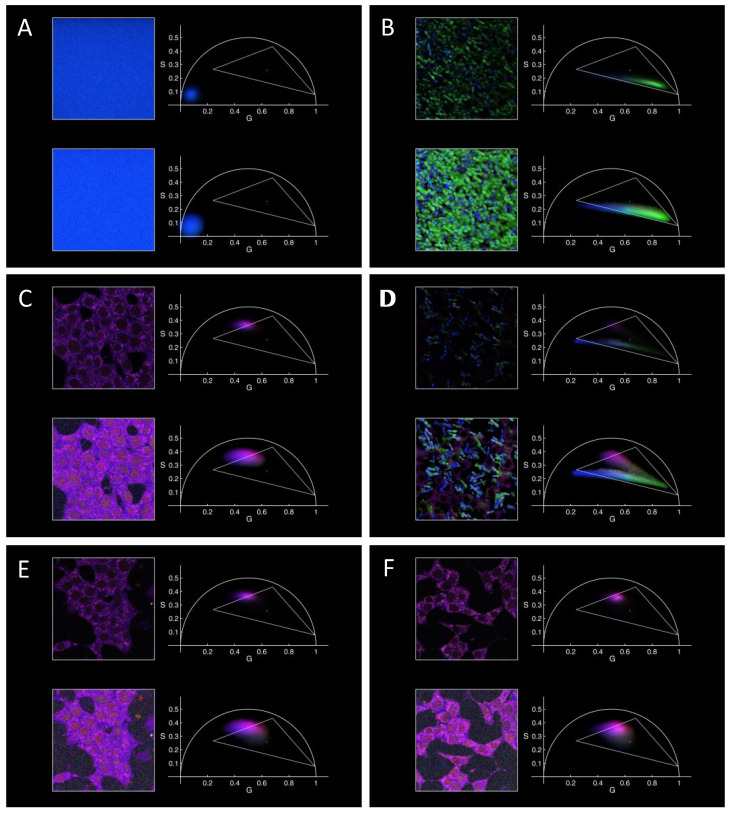
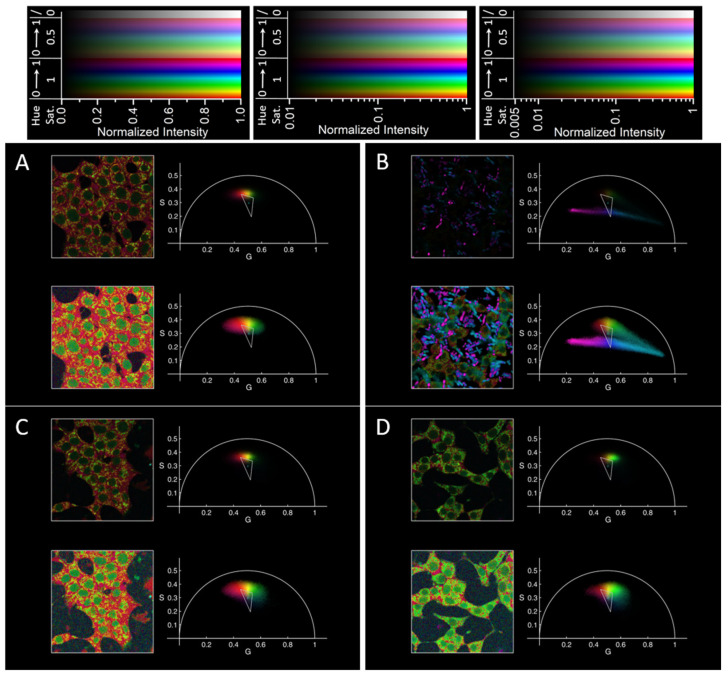
Fluorescence lifetime imaging microscopy (FLIM) has proven to be a useful method for analyzing various aspects of material science and biology, like the supramolecular organization of (slightly) fluorescent compounds or the metabolic activity in non-labeled cells; in particular, FLIM phasor analysis (phasor-FLIM) has the potential for an intuitive representation of complex fluorescence decays and therefore of the analyzed properties. Here we present and make available tools to fully exploit this potential, in particular by coding via hue, saturation, and intensity the phasor positions and their weights both in the phasor plot and in the microscope image. We apply these tools to analyze FLIM data acquired via two-photon microscopy to visualize: (i) different phases of the drug pioglitazone (PGZ) in solutions and/or crystals, (ii) the position in the phasor plot of non-labelled poly(lactic-co-glycolic acid) (PLGA) nanoparticles (NPs), and (iii) the effect of PGZ or PGZ-containing NPs on the metabolism of insulinoma (INS-1 E) model cells. PGZ is recognized for its efficacy in addressing insulin resistance and hyperglycemia in type 2 diabetes mellitus, and polymeric nanoparticles offer versatile platforms for drug delivery due to their biocompatibility and controlled release kinetics. This study lays the foundation for a better understanding via phasor-FLIM of the organization and effects of drugs, in particular, PGZ, within NPs, aiming at better control of encapsulation and pharmacokinetics, and potentially at novel anti-diabetics theragnostic nanotools.

Keywords: MATLAB tool; PLGA nanoparticles; drug delivery; fluorescence lifetime imaging microscopy (FLIM); insulinoma (INS-1) cells; phasor-FLIM analysis; pioglitazone characterization.


Conflict of interest statement

The authors declare no conflicts of interest. The funders had no role in the design of the study; in the collection, analyses, or interpretation of data; in the writing of the manuscript; or in the decision to publish the results.

Figures

Figure 1
Figure 1
Characterization of free PGZ using FLIM. For each panel, on the left are reported the FLIM images and on the right the phasor plots (with corresponding colors): (A) PGZ solid, (B) PGZ in DMF at 37 °C at time 0, (C) PGZ in DMF at 37 °C at 20 min, (D) at 30 min, (E) at 50 min, and (F) at 55 min in a different position; in the phasor plot, vertices of the triangle correspond to the “principal” points, and the “center” point, where the saturation is 0 (see Section 3 and Section 4.5) is shown in cyan. For all the panels: on top, figures with a linear intensity scale (normalized to maximum); on the bottom, the same figures with a logarithmic intensity scale starting from a 0.01 fraction of the maximum intensity in the image; on the right these intensity scales are shown in corresponding positions for various values of hue and saturation. Note how the evaporation of DMF with time causes the formation of PGZ crystals, and that the used color coding based on the position of the phasor plot for each pixel allows appreciating at a glance the different forms of PGZ and their position within the images. The side of the square microscopy image is 106 µm here and in all the following figures.
Figure 2
Figure 2
Characterization of empty PLGA nanoparticles and PGZ-loaded PLGA NPs using FLIM. For each panel, on the left are reported the FLIM images and on the right the phasor plots (with corresponding colors) for exemplary cases for NPs (AD) and for solid PLGA (E): (A) empty PLGA NPs in RPMI, (B) PGZ-loaded PLGA NPs in RPMI, (C) empty PLGA NPs in PBS, (D) PGZ-loaded PLGA NPs in PBS, (E) solid PLGA. A linear scale was used for the intensity normalized to the maximum in each picture (like on top in Figure 1; color scale reported in panel (F)). Two color codes were used, one like in Figure 1 (top figures in each panel), one with additional principal points (see main text), as shown in the right bottom figure in each panel (vertices of the polygon and light gray crosses), with hue of 0/1 at (0,0) and increasing clockwise, and a “center” point (cyan ×) inside but towards the bottom of the polygon.
Figure 3
Figure 3
FLIM of PGZ and of INS-1E cells in RPMI medium, also upon co-incubation and incubation with nanoparticles for 24 h at 37 °C. (A) RPMI, (B) PGZ in RPMI, (C) INS-1E in RPMI, (D) INS-1E in RPMI in the presence of 0.1 mg/mL PGZ, (E) INS-1E in RPMI in presence of empty PLGA NPs, (F) INS-1E in RPMI in presence of PGZ-loaded PLGA NPs. Each panel has the same composition, color coding, and intensity scales as in Figure 1 (and in the top parts of the panels in Figure 2 for the linear intensity scale), in order to compare more easily the results and to show at-a-glance possible signals arising from the species observed in the previous cases.
Figure 4
Figure 4
FLIM characterization of INS-1E cells interacting with PGZ and with the nanoparticles considered in this work. The same data of Figure 3C–F are here reported with a different color encoding for phasor position (principal points at the vertices of the triangle and center point in cyan in the right part of each panel), in order to better appreciate the position of phasors characterizing fluorescence arising from within the cells. (A) INS-1E in RPMI, (B) INS-1E in RPMI in the presence of PGZ, (C) INS-1E in RPMI in the presence of empty PLGA NPs, (D) INS-1E in RPMI in the presence of PGZ-loaded PLGA NPs. For each panel: on the left, FLIM images; on the right, phasor plots with corresponding colors; on the top, a linear intensity scale is used (the most on the left on the top of the figure), on the bottom a logarithmic one starting from 1% (panels (A,C,D), center color scale on top of the figure) or from 0.5% (panel (B), rightmost color scale on the top of the figure) of the maximum intensity in each image. Note that, on average, the apparent intensities of cells in the bottom image of panel (B) are similar to the ones on the top images in the other panels.

Similar articles

References

    1. Vitali M., Picazo F., Prokazov Y., Duci A., Turbin E., Götze C., Llopis J., Hartig R., Visser A.J.W.G., Zuschratter W. Wide-Field Multi-Parameter FLIM: Long-Term Minimal Invasive Observation of Proteins in Living Cells. PLoS ONE. 2011;6:e15820. doi: 10.1371/journal.pone.0015820. - DOI - PMC - PubMed
    1. Stringari C., Cinquin A., Cinquin O., Digman M.A., Donovan P.J., Gratton E. Phasor Approach to Fluorescence Lifetime Microscopy Distinguishes Different Metabolic States of Germ Cells in a Live Tissue. Proc. Natl. Acad. Sci. USA. 2011;108:13582–13587. doi: 10.1073/pnas.1108161108. - DOI - PMC - PubMed
    1. Sameni S., Syed A., Marsh J.L., Digman M.A. The Phasor-FLIM Fingerprints Reveal Shifts from OXPHOS to Enhanced Glycolysis in Huntington Disease. Sci. Rep. 2016;6:34755. doi: 10.1038/srep34755. - DOI - PMC - PubMed
    1. Lakner P.H., Monaghan M.G., Möller Y., Olayioye M.A., Schenke-Layland K. Applying Phasor Approach Analysis of Multiphoton FLIM Measurements to Probe the Metabolic Activity of Three-Dimensional in Vitro Cell Culture Models. Sci. Rep. 2017;7:42730. doi: 10.1038/srep42730. - DOI - PMC - PubMed
    1. Bec J., Vela D., Phipps J.E., Agung M., Unger J., Margulies K.B., Southard J.A., Buja L.M., Marcu L. Label-Free Visualization and Quantification of Biochemical Markers of Atherosclerotic Plaque Progression Using Intravascular Fluorescence Lifetime. JACC Cardiovasc. Imaging. 2021;14:1832–1842. doi: 10.1016/j.jcmg.2020.10.004. - DOI - PMC - PubMed

Substances

LinkOut - more resources