. 2024 Apr 25;25(9):4686.
doi: 10.3390/ijms25094686.

Variable Penetrance and Expressivity of a Rare Pore Loss-of-Function Mutation (p.L889V) of Nav1.5 Channels in Three Spanish Families

Affiliations

Variable Penetrance and Expressivity of a Rare Pore Loss-of-Function Mutation (p.L889V) of Nav1.5 Channels in Three Spanish Families

María Gallego-Delgado et al. Int J Mol Sci. .

Abstract

A novel rare mutation in the pore region of Nav1.5 channels (p.L889V) has been found in three unrelated Spanish families that produces quite diverse phenotypic manifestations (Brugada syndrome, conduction disease, dilated cardiomyopathy, sinus node dysfunction, etc.) with variable penetrance among families. We clinically characterized the carriers and recorded the Na+ current (INa) generated by p.L889V and native (WT) Nav1.5 channels, alone or in combination, to obtain further insight into the genotypic-phenotypic relationships in patients carrying SCN5A mutations and in the molecular determinants of the Nav1.5 channel function. The variant produced a strong dominant negative effect (DNE) since the peak INa generated by p.L889V channels expressed in Chinese hamster ovary cells, either alone (-69.4 ± 9.0 pA/pF) or in combination with WT (-62.2 ± 14.6 pA/pF), was significantly (n ≥ 17, p < 0.05) reduced compared to that generated by WT channels alone (-199.1 ± 44.1 pA/pF). The mutation shifted the voltage dependence of channel activation and inactivation to depolarized potentials, did not modify the density of the late component of INa, slightly decreased the peak window current, accelerated the recovery from fast and slow inactivation, and slowed the induction kinetics of slow inactivation, decreasing the fraction of channels entering this inactivated state. The membrane expression of p.L889V channels was low, and in silico molecular experiments demonstrated profound alterations in the disposition of the pore region of the mutated channels. Despite the mutation producing a marked DNE and reduction in the INa and being located in a critical domain of the channel, its penetrance and expressivity are quite variable among the carriers. Our results reinforce the argument that the incomplete penetrance and phenotypic variability of SCN5A loss-of-function mutations are the result of a combination of multiple factors, making it difficult to predict their expressivity in the carriers despite the combination of clinical, genetic, and functional studies.

Keywords: Brugada syndrome; Nav1.5; SCN5A; cardiac conduction defect; dilated cardiomyopathy; mutation; phenotypic penetrance; phenotypic variability.


Conflict of interest statement

The authors declare no conflicts of interest.

Figures
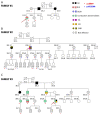
Figure 1
Figure 1
(AC) Pedigrees of the three families analyzed in this study. The arrows indicate the probands. Circles, squares, and triangles represent females, males, and abortions, respectively. Deceased individuals are marked with a diagonal line. White symbols represent subjects that were not studied; the correspondence of other symbols/colors is indicated in the figure. Aft: atrial flutter; BrS: Brugada syndrome; DCM: dilated cardiomyopathy; SD: sudden death; SND: sinus node dysfunction; VA: ventricular arrhythmias.
Figure 2
Figure 2
(A) INav1.5 traces recorded by applying the protocol shown at the top in three different CHO cells transfected or not with the cDNA encoding WT, p.L889V, or WT and p.L889V Nav1.5. (B,C) Mean current density–voltage (B) and peak current density values (C) for INav1.5 recorded in the three experimental groups. In (B,C), each point/bar represents the mean ± SEM of ‘n’ experiments/cells and in (C), each dot represents one single experiment. In (B,C), * p < 0.05 vs. WT. ANOVA followed by Tukey’s test and a multilevel mixed-effects model.
Figure 3
Figure 3
(A,B) Normalized conductance–voltage (activation) (A) and inactivation (B) curves for INav1.5 recorded in CHO cells transfected or not with the cDNA encoding WT, p.L889V, or WT and p.L889V Nav1.5. The solid lines represent the fit of a Boltzmann function to the data. Each point represents the mean ± SEM of the number of experiments indicated in the figures. ANOVA followed by Tukey’s test and multilevel mixed-effects model. (CE) Expanded representation of the overlapping area between the activation and inactivation curves (window current) for INav1.5 recorded in CHO expressing WT (C) or p.L889V (D) Nav1.5 and the probability of being within this window (E).
Figure 4
Figure 4
(A,B) Fast and slow time constants (A) and relative amplitudes (B) of the exponential components obtained by fitting a biexponential function to the decay of the currents recorded in CHO cells transfected or not with the cDNA encoding WT (at −30 mV), p.L889V (at −10 mV), or WT and p.L889V (at −10 mV) Nav1.5. (C) Time course of reactivation for INav1.5 recorded using the protocol shown on the left in CHO cells transfected or not with the cDNA encoding WT, p.L889V, or WT and p.L889V Nav1.5. The solid lines represent the fit of a monoexponential function to the data. WT and LV: membrane potential when recording INa generated by WT and p.L889V channels, respectively. In (AC), bars/points represent the mean ± SEM of ‘n’ experiments/cells and in A-B, each dot represents one single experiment. ANOVA followed by Tukey’s test and multilevel mixed-effects model.
Figure 5
Figure 5
(A,B) Time course of development (A) and recovery (B) of/from slow inactivation for currents recorded in CHO cells transfected with the cDNA encoding WT, p.L889V, or WT and p.L889V Nav1.5 assessed with the double-pulse protocols shown at the top of each panel. WT and LV: membrane potential when recording INa generated by WT and p.L889V channels, respectively. In (A,B), the solid lines represent the fit of a monoexponential function to the data, and each point represents the mean ± SEM of the number of experiments indicated in the figures. ANOVA followed by Tukey’s test and multilevel mixed-effects model.
Figure 6
Figure 6
(A) INav1.5 traces recorded by applying 500 ms pulses from −120 mV to −30 or −10 mV in CHO cells transfected with the cDNA encoding WT or p.L889V Nav1.5, respectively. WT and LV: membrane potential when recording INa generated by WT and p.L889V channels, respectively. (B) Mean INa,L measured at the end of the 500 ms pulses and expressed as percentage of the peak current recorded in CHO cells transfected with the cDNA encoding WT (at −30 mV), p.L889V (at −10 mV), or WT and p.L889V (at −10 mV) Nav1.5. (C) Normalized current traces of the INaL recorded by applying a human ventricular AP command signal as voltage protocol in CHO transfected with the cDNA encoding WT or p.L889V Nav1.5. For clarity, an expanded view of traces (≈100 ms) shows the persistent inward Na current that deviates from the background current generated during the AP. (D) Mean AUC of the INaL traces recorded in the three experimental groups. (E) Normalized current traces of the INaL recorded by applying the ramp protocol shown at the top in CHO transfected with the cDNA encoding WT or p.L889V Nav1.5. (F) Mean AUC of the INaL traces recorded in CHO transfected with the cDNA encoding WT, p.L889V, or WT and p.L889V Nav1.5. In (B,D,F), bars represent the mean ± SEM of ‘n’ experiments, and each dot represents one single experiment. ANOVA followed by Tukey’s test and multilevel mixed-effects model.
Figure 7
Figure 7
(A,B) Representative Western blot images (A) and densitometric analysis (B) of biotinylation assays showing the total (input) or surface (membrane) expression of WT and p.L889V Nav1.5 channels. The cytosolic protein ezrin was used as a negative control. In (B) (left), the corresponding stain-free gel is depicted to show the total protein. MW: molecular weight. In (B), bars show the mean ± SEM of 3 independent experiments. ** p < 0.01 vs. Nav1.5 WT. Unpaired student t-test.
Figure 8
Figure 8
Molecular modeling of WT and p.L889V Nav1.5 channels. (A) Top panel. Ribbon representation of the cryo-EM structure of rat Nav1.5 (PDB: 6UZ3). The transmembrane segments (TM) are represented in gray, and the L889 residue has been highlighted. The inset shows a close view of the S5, P loop, and part of the S6 of DII. (B) Sticks representation of the amino acid side-chains from WT (green skeleton) and p.L889V (gray skeleton) showing the H-bonds established by the surrounding residues (F885, R863, and E898) in the presence of L889 (yellow) or V889 (gray). (C) Sticks representation of the R893 and E898 amino acids showing that in the presence of the valine ((right) panel), but not leucine ((left) panel), at position 889, a H-bond can be established between both (dashed line). (D) Sticks representation of the amino acid side-chains showing the distances (in Å and nm) among the residues of the DEKA motif (D372-E898-K1419-A1711) in WT Nav1.5 (L889, (left) panel) or in the presence of the mutation (V889, (right) panel). Throughout the figure, the numbering of the human Nav1.5 clone (NM_198056.3, Uniprot ID: Q14524) has been used.

References

    1. Remme C.A., Verkerk A.O., Hoogaars W.M.H., Aanhaanen W.T.J., Scicluna B.P., Annink C., van den Hoff M.J.B., Wilde A.A., van Veen T.A.B., Veldkamp M.W., et al. The Cardiac Sodium Channel Displays Differential Distribution in the Conduction System and Transmural Heterogeneity in the Murine Ventricular Myocardium. Basic Res. Cardiol. 2009;104:511–522. doi: 10.1007/s00395-009-0012-8. - DOI - PMC - PubMed
    1. Rivaud M.R., Delmar M., Remme C.A. Heritable Arrhythmia Syndromes Associated with Abnormal Cardiac Sodium Channel Function: Ionic and Non-Ionic Mechanisms. Cardiovasc. Res. 2020;116:1557–1570. doi: 10.1093/cvr/cvaa082. - DOI - PMC - PubMed
    1. Schwartz P.J., Ackerman M.J., Antzelevitch C., Bezzina C.R., Borggrefe M., Cuneo B.F., Wilde A.A.M. Inherited Cardiac Arrhythmias. Nat. Rev. Dis. Primers. 2020;6:58. doi: 10.1038/s41572-020-0188-7. - DOI - PMC - PubMed
    1. Wilde A.A.M., Amin A.S. Clinical Spectrum of SCN5A Mutations: Long QT Syndrome, Brugada Syndrome, and Cardiomyopathy. JACC Clin. Electrophysiol. 2018;4:569–579. doi: 10.1016/j.jacep.2018.03.006. - DOI - PubMed
    1. Remme C.A., Verkerk A.O., Nuyens D., van Ginneken A.C.G., van Brunschot S., Belterman C.N.W., Wilders R., van Roon M.A., Tan H.L., Wilde A.A.M., et al. Overlap Syndrome of Cardiac Sodium Channel Disease in Mice Carrying the Equivalent Mutation of Human SCN5A-1795insD. Circulation. 2006;114:2584–2594. doi: 10.1161/CIRCULATIONAHA.106.653949. - DOI - PubMed

Substances

LinkOut - more resources