Review
. 2024 Apr 25;25(9):4690.
doi: 10.3390/ijms25094690.

Plasma Metabolite Profiling in the Search for Early-Stage Biomarkers for Lung Cancer: Some Important Breakthroughs

Affiliations
Review

Plasma Metabolite Profiling in the Search for Early-Stage Biomarkers for Lung Cancer: Some Important Breakthroughs

Jill Meynen et al. Int J Mol Sci. .

Abstract

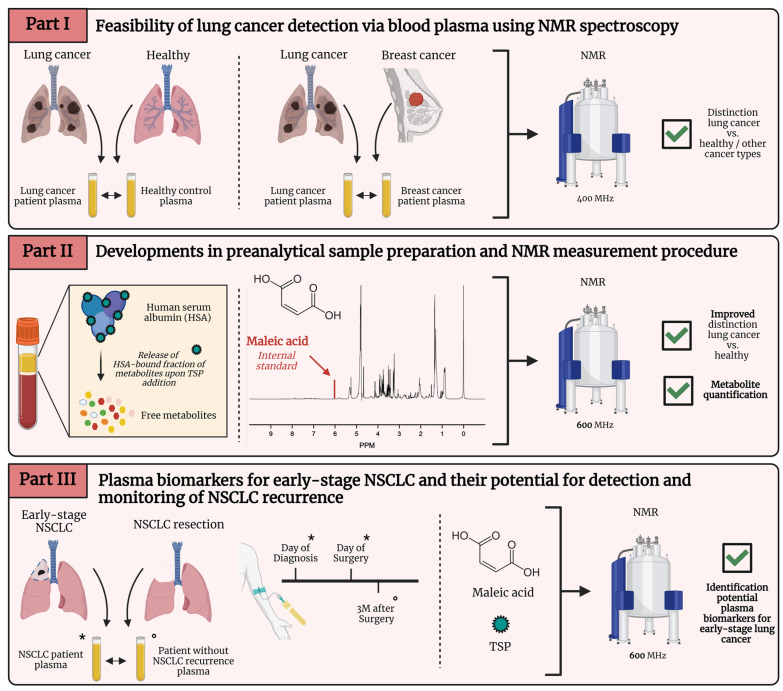
Lung cancer is the leading cause of cancer-related mortality worldwide. In order to improve its overall survival, early diagnosis is required. Since current screening methods still face some pitfalls, such as high false positive rates for low-dose computed tomography, researchers are still looking for early biomarkers to complement existing screening techniques in order to provide a safe, faster, and more accurate diagnosis. Biomarkers are biological molecules found in body fluids, such as plasma, that can be used to diagnose a condition or disease. Metabolomics has already been shown to be a powerful tool in the search for cancer biomarkers since cancer cells are characterized by impaired metabolism, resulting in an adapted plasma metabolite profile. The metabolite profile can be determined using nuclear magnetic resonance, or NMR. Although metabolomics and NMR metabolite profiling of blood plasma are still under investigation, there is already evidence for its potential for early-stage lung cancer diagnosis, therapy response, and follow-up monitoring. This review highlights some key breakthroughs in this research field, where the most significant biomarkers will be discussed in relation to their metabolic pathways and in light of the altered cancer metabolism.

Keywords: NMR (nuclear magnetic resonance); biomarkers; lung cancer; metabolomics.


Conflict of interest statement

The authors declare no conflicts of interest.

Figures

Figure A1
Figure A1
Graphical overview of parts I, II, and III. * indicate preoperative plasma samples, ° indicate postoperative plasma samples. MHz, megahertz; NMR, nuclear magnetic resonance; NSCLC, non-small cell lung cancer; TSP, trimethylsilyl-2,2,3,3-tetradeuteropropionic acid. Figure created with BioRender.com.
Figure A2
Figure A2
(a) Example of the 1H-NMR spectrum of a healthy control using a 600 MHz NMR spectrometer, with TSP as HSA-binding competitor and maleate as the internal standard for normalization. Chemical shift values are reported in parts per million (ppm). The area under the peak corresponds with the molar amount of hydrogen atoms and, therefore, the metabolite concentration. (b) Magnification of the 1.2–1.5 ppm region, where alanine, lactate, and β-hydroxybutyrate are identified using metabolite spiking. (c) Magnification of the 0.8–1.1 ppm region, where valine, isoleucine, and leucine are identified using metabolite spiking. Ala, alanine; Ile, isoleucine; Leu, leucine; TSP, trimethylsilyl-2,2,3,3-tetradeuteropropionic acid; Val, valine. Figure adapted from reference [15].
Figure 1
Figure 1
Differentiation between lung cancer patients and healthy controls based on metabolic profiling in plasma. (a) Orthogonal partial least squares discriminant analysis (OPLS-DA) score plot from the training cohort shows a distinction between the plasma metabolite profiles of lung cancer patients and controls with a sensitivity of 78% and a specificity of 92%. (b) OPLS-DA score plot from the independent validation cohort shows a distinction between the metabolite profiles of lung cancer patients and controls with a sensitivity of 71% and specificity of 81%. (c) Receiver operating curves show the high predictive accuracy of the OPLS-DA model of the training cohort for both cross-validation and independent validation, reaching AUC values of 0.88 and 0.84, respectively. AUC, area under the curve; C, controls; CV, cross-validation; LC, lung cancer patients; PS, predicted scores. Figure adapted from reference [18].
Figure 2
Figure 2
Differentiation between lung and breast cancer patients based on metabolic profiling in plasma. (a) Orthogonal partial least squares discriminant analysis (OPLS-DA) score plot from the training cohort shows a distinction between the metabolite profiles of lung cancer patients and breast cancer patients with a sensitivity of 93% (93% of the lung cancer patients were correctly classified) and a specificity of 99% (99% of the breast cancer patients were correctly classified). (b) Receiver operating curves show the high predictive accuracy of the OPLS-DA model of the training cohort for both cross-validation and independent validation, reaching AUC values of 0.96 and 0.94, respectively. (c) OPLS-DA score plot from the independent validation cohort shows a distinction between the metabolite profiles of lung cancer patients and breast cancer patients with a sensitivity of 89% and specificity of 82%. AUC, area under the curve; BC, breast cancer patients; CV, cross-validation; LC, lung cancer patients; PS, predicted scores. Figure adapted from reference [19].
Figure 3
Figure 3
The addition of TSP leads to the dissociation of the HSA-bound fraction of metabolites due to the extremely high affinity of TSP for HSA. While some plasma metabolites do not show affinity for HSA, others are attracted and bind to HSA, resulting in an underestimation of the actual plasma metabolite concentration. After adding TSP, which is characterized by an even higher HSA affinity compared to the plasma metabolites, TSP will bind to HSA, resulting in the release of the bound metabolites. HSA, human serum albumin; TSP, trimethylsilyl-2,2,3,3-tetradeuteropropionic acid. Figure created with BioRender.com.
Figure 4
Figure 4
Differentiation between lung cancer patients and healthy controls based on metabolic profiling in plasma using a new methodology including TSP, as a human serum albumin (HSA)-binding competitor, and MA as an internal standard for metabolite quantification. (a) Unsupervised principal component analysis (PCA) shows a distinctive trend between the plasma metabolite profiles of the lung cancer patients (green triangles) and controls (orange circles). (b) Orthogonal partial least squares discriminant analysis (OPLS-DA) shows a clear distinction between the plasma metabolite profiles of the 80 lung cancer patients and 80 controls within the training cohort. The constructed model was characterized by a sensitivity and specificity of 85% and 93%, respectively. (c) The receiver operating characteristic (ROC) curve of the OPLS-training model confirmed the overall performance with an AUC of 0.95. (d) Validation of the constructed OPLS-DA model on an independent validation cohort resulted in a distinction between the plasma metabolite profiles of the 34 lung cancer patients and 38 controls with a sensitivity and specificity of 74% each. AUC, area under the curve; C, controls; LC, lung cancer patients; MA, maleic acid; PC, principal component; PS, predicted scores; TSP, trimethylsilyl-2,2,3,3-tetradeuteropropionic acid. Figure adapted from reference [20].
Figure 5
Figure 5
Differentiation between pre- and postoperative plasma samples based on metabolic profiling. The clear separation on the x-axis represents the metabolic variation between the pre- and postoperative groups, both when comparing baseline/effect (B/E) and control/effect (C/E). (a) Supervised orthogonal partial least squares discriminant analysis (OPLS-DA) shows an excellent distinction between the plasma metabolite profiles of preoperative (baseline: B, blue circles) and postoperative (effect: E (after 3 months), orange triangles) datasets within the training cohort consisting of 50 NSCLC patients. Sensitivity and specificity rates of 92% (92% of the preoperative samples correctly identified as preoperative) and 96% (96% of the postoperative samples correctly identified as postoperative), respectively, were reached. (b) Validation of the constructed OPLS-DA model in the validation cohort consisting of 24 NSCLC patients also resulted in a clear distinction between pre- and postoperative profiles with a sensitivity and specificity of 88% and 92%, respectively. (c) OPLS-DA model shows a great distinction between the preoperative (control; C; green circles) and postoperative datasets within the training cohort consisting of 50 NSCLC patients. Sensitivity and specificity rates of 88% and 90%, respectively, were reached. (d) Validation of the constructed OPLS-DA model in the validation cohort consisting of 23 NSCLC patients again resulted in a clear distinction between pre- and postoperative profiles with a sensitivity and specificity of 96% and 91%, respectively. PS, predictive scores. Figure adapted from reference [21].
Figure 6
Figure 6
Overview of all the receiver operating curves (ROC), showing the area under the curve (AUC) values, in the three different comparisons, for both training and validation cohorts. Excellent AUC values were reached in both training and validation cohorts when comparing preoperative profiles (baseline: B, and control: C) with postoperative profiles (effect: E). The blue zone represents the 95% confidence interval of the obtained AUC values by internal validation via bootstrapping resampling. Figure reused from reference [21].
Figure 7
Figure 7
Integration values, normalized to MA, of lactate, cysteine, acetate, and asparagine in preoperative (baseline: blue) and postoperative datasets (effect: orange). Lactate, cysteine, and asparagine showed a significant increase in plasma concentrations after surgery. Acetate showed a significant decrease in plasma concentration after surgery. (*** p < 0.001) (· represents a datapoint outside the 1.5 IQR range). MA, maleic acid. Figure reused from reference [21].
Figure 8
Figure 8
Metabolic symbiosis between glycolytic and oxidative lung cancer cells showing the lactate shuttle. Glycolytic cancer cells use aerobic glycolysis (aerobic fermentation) to obtain intermediates for biosynthesis, while oxidative phosphorylation is used to yield energy for further tumor growth. Nevertheless, glycolysis is mainly increased in the glycolytic cancer cells, while oxidative phosphorylation is decreased. As aerobic glycolysis is used, lactate is formed and released in the microenvironment by MCT4 transporters. Lactate can be taken up by oxidative cancer cells (“Lactate shuttle”) by the MCT1 transporters for gluconeogenesis. The glucose that is eventually formed will undergo glycolysis to stimulate biosynthesis via its intermediates and partially enter the TCA cycle after conversion to pyruvate to yield energy. Additionally, lactate will bind to the GRP81 receptor, which is upregulated by lactate itself via STAT3 in lung cancer cells, resulting in angiogenesis, tumor cell growth, and tumor cell immune escape. Enzymes, receptor labels, and arrows in green represent an upregulation, while red represents a downregulation. Akt, protein kinase B; α-KG, alpha-ketoglutarate; cAMP, cyclic adenosine monophosphate; GLUT3, glucose transporter 3; GLUT5, glucose transporter 5; GPR81, G-protein coupled receptor 81; G6P, glucose-6-phosphate; HK, hexokinase; LDH; lactate dehydrogenase; MCT1, monocarboxylate transporter 1; MCT4, monocarboxylate transporter 4; OXPHOS, oxidative phosphorylation; PC, pyruvate carboxylase; PEP, phosphoenolpyruvate; PCK2, phosphoenolpyruvate carboxykinase 2; PKM2, pyruvate kinase M2; PI3K, phosphoinositide 3-kinase; STAT3, signal transducer and activator of transcription 3; TAZ, transcriptional coactivator with PDZ-binding motif; TCA, tricarboxylic acid cycle. Figure created with BioRender.com.

Similar articles

References

    1. Hirsch F.R., Scagliotti G.V., Mulshine J.L., Kwon R., Curran W.J., Wu Y.-L., Paz-Ares L. Lung cancer: Current therapies and new targeted treatments. Lancet. 2017;389:299–311. doi: 10.1016/S0140-6736(16)30958-8. - DOI - PubMed
    1. Wood D.E., Kazerooni E.A., Baum S.L., Eapen G.A., Ettinger D.S., Hou L., Jackman D.M., Klippenstein D., Kumar R., Lackner R.P., et al. Lung Cancer Screening, Version 3.2018, NCCN Clinical Practice Guidelines in Oncology. J. Natl. Compr. Cancer Netw. 2018;16:412–441. doi: 10.6004/jnccn.2018.0020. - DOI - PMC - PubMed
    1. Lancaster H., Heuvelmans M.A., Oudkerk M. Low-dose computed tomography lung cancer screening: Clinical evidence and implementation research. J. Intern. Med. 2022;292:68–80. doi: 10.1111/joim.13480. - DOI - PMC - PubMed
    1. The National Lung Screening Trial Research Team Reduced lung-cancer mortality with low-dose computed tomographic screening. N. Engl. J. Med. 2011;365:395–409. doi: 10.1056/NEJMoa1102873. - DOI - PMC - PubMed
    1. Duffy S.W., Field J. Mortality Reduction with Low-Dose CT Screening for Lung Cancer. N. Engl. J. Med. 2020;382:572–573. doi: 10.1056/NEJMe1916361. - DOI - PubMed

Substances