

Pure-Shift-Based Proton Magnetic Resonance Spectroscopy for High-Resolution Studies of Biological Samples
- PMID: 38731917
- PMCID: PMC11083948
- DOI: 10.3390/ijms25094698
Pure-Shift-Based Proton Magnetic Resonance Spectroscopy for High-Resolution Studies of Biological Samples
Abstract
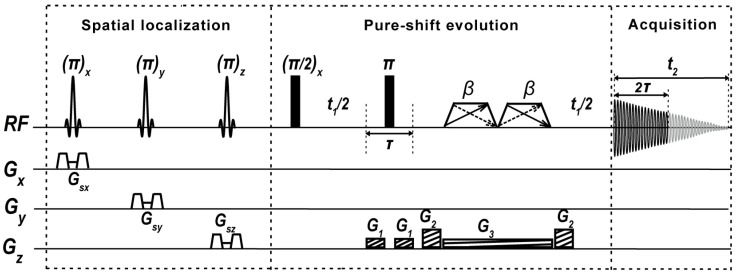
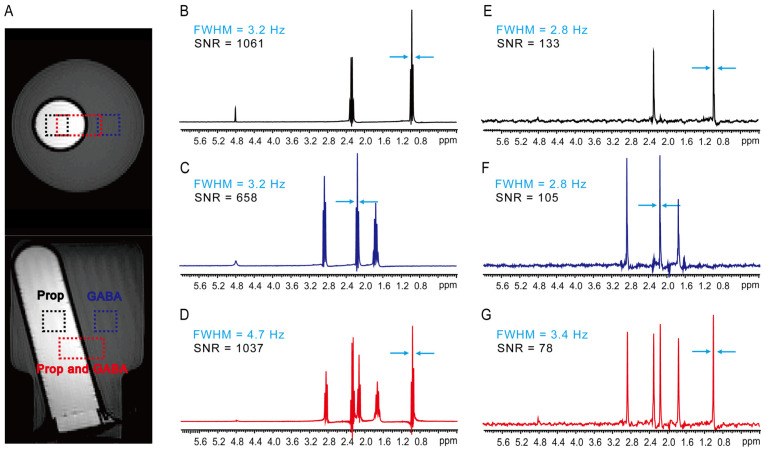
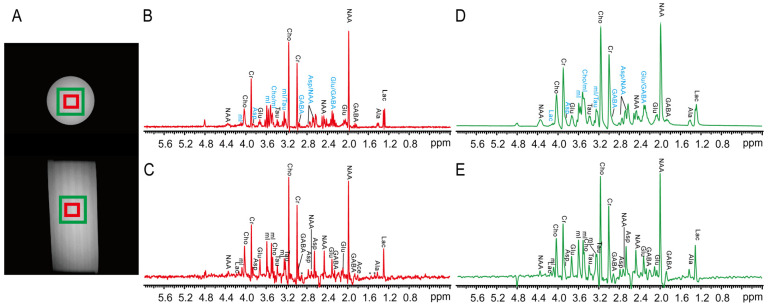
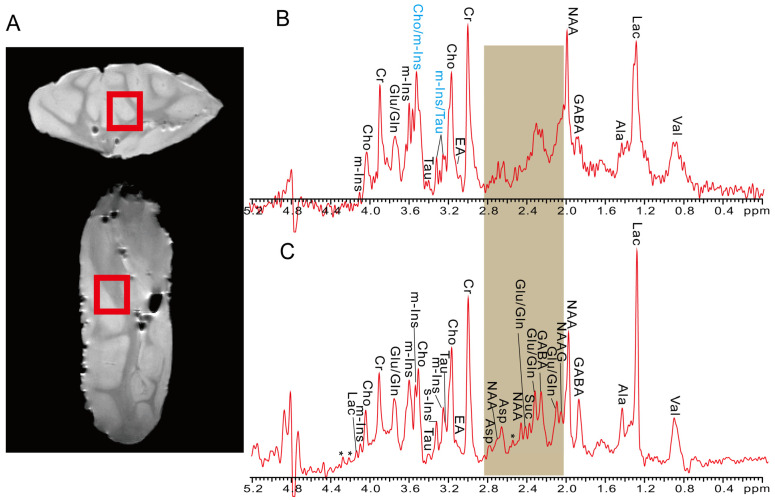
Proton magnetic resonance spectroscopy (1H MRS) presents a powerful tool for revealing molecular-level metabolite information, complementary to the anatomical insight delivered by magnetic resonance imaging (MRI), thus playing a significant role in in vivo/in vitro biological studies. However, its further applications are generally confined by spectral congestion caused by numerous biological metabolites contained within the limited proton frequency range. Herein, we propose a pure-shift-based 1H localized MRS method as a proof of concept for high-resolution studies of biological samples. Benefitting from the spectral simplification from multiplets to singlet peaks, this method addresses the challenge of spectral congestion encountered in conventional MRS experiments and facilitates metabolite analysis from crowded NMR resonances. The performance of the proposed pure-shift 1H MRS method is demonstrated on different kinds of samples, including brain metabolite phantom and in vitro biological samples of intact pig brain tissue and grape tissue, using a 7.0 T animal MRI scanner. This proposed MRS method is readily implemented in common commercial NMR/MRI instruments because of its generally adopted pulse-sequence modules. Therefore, this study takes a meaningful step for MRS studies toward potential applications in metabolite analysis and disease diagnosis.
Keywords: ISIS localization; biological samples; magnetic resonance spectroscopy; pure shift; spectral congestion.
Conflict of interest statement
The authors declare no conflicts of interest.
Figures
Similar articles
-
Adaptable Singlet-Filtered Nuclear Magnetic Resonance Spectroscopy for Chemical and Biological Applications.Anal Chem. 2022 Mar 15;94(10):4201-4208. doi: 10.1021/acs.analchem.1c04210. Epub 2022 Mar 3. Anal Chem. 2022. PMID: 35238535
-
Spatially Localized Two-Dimensional J-Resolved NMR Spectroscopy via Intermolecular Double-Quantum Coherences for Biological Samples at 7 T.PLoS One. 2015 Jul 24;10(7):e0134109. doi: 10.1371/journal.pone.0134109. eCollection 2015. PLoS One. 2015. PMID: 26207739 Free PMC article.
-
Quantitative NMR-Based Metabolomics on Tissue Biomarkers and Its Translation into In Vivo Magnetic Resonance Spectroscopy.Methods Mol Biol. 2019;1978:369-387. doi: 10.1007/978-1-4939-9236-2_23. Methods Mol Biol. 2019. PMID: 31119675
-
A practical guide to in vivo proton magnetic resonance spectroscopy at high magnetic fields.Anal Biochem. 2017 Jul 15;529:30-39. doi: 10.1016/j.ab.2016.10.019. Epub 2016 Oct 20. Anal Biochem. 2017. PMID: 27773654 Review.
-
Development and applications of in vivo clinical magnetic resonance spectroscopy.Prog Biophys Mol Biol. 1996;65(1-2):45-81. doi: 10.1016/s0079-6107(96)00006-5. Prog Biophys Mol Biol. 1996. PMID: 9029941 Review.
Cited by
-
PyAMARES, an Open-Source Python Library for Fitting Magnetic Resonance Spectroscopy Data.Diagnostics (Basel). 2024 Nov 27;14(23):2668. doi: 10.3390/diagnostics14232668. Diagnostics (Basel). 2024. PMID: 39682576 Free PMC article.
References
-
- Mohajeri S., Bezabeh T., Ijare O.B., King S.B., Thomas M.A., Minuk G., Lipschitz J., Kirkpatrick I., Micflikier A.B., Summers R., et al. In vivo 1H MRS of human gallbladder bile in understanding the pathophysiology of primary sclerosing cholangitis (PSC): Immune-mediated disease versus bile acid-induced injury. NMR Biomed. 2019;32:e4065. doi: 10.1002/nbm.4065. - DOI - PubMed
-
- Singhania M., Zaher A., Pulliam C.F., Bayanbold K., Searby C.C., Schoenfeld J.D., Mapuskar K.A., Fath M.A., Allen B.G., Spitz D.R., et al. Quantitative MRI evaluation of Ferritin overexpression in non-small-cell lung cancer. Int. J. Mol. Sci. 2024;25:2398. doi: 10.3390/ijms25042398. - DOI - PMC - PubMed
MeSH terms
Grants and funding
LinkOut - more resources
Full Text Sources
