. 2024 Apr 27;25(9):4781.
doi: 10.3390/ijms25094781.

Examination of the Complex Molecular Landscape in Obesity and Type 2 Diabetes

Affiliations

Examination of the Complex Molecular Landscape in Obesity and Type 2 Diabetes

Uladzislau Vadadokhau et al. Int J Mol Sci. .

Abstract

The escalating prevalence of metabolic disorders, notably type 2 diabetes (T2D) and obesity, presents a critical global health challenge, necessitating deeper insights into their molecular underpinnings. Our study integrates proteomics and metabolomics analyses to delineate the complex molecular landscapes associated with T2D and obesity. Leveraging data from 130 subjects, including individuals with T2D and obesity as well as healthy controls, we elucidate distinct molecular signatures and identify novel biomarkers indicative of disease progression. Our comprehensive characterization of cardiometabolic proteins and serum metabolites unveils intricate networks of biomolecular interactions and highlights differential protein expression patterns between T2D and obesity cohorts. Pathway enrichment analyses reveal unique mechanisms underlying disease development and progression, while correlation analyses elucidate the interplay between proteomics, metabolomics, and clinical parameters. Furthermore, network analyses underscore the interconnectedness of cardiometabolic proteins and provide insights into their roles in disease pathogenesis. Our findings may help to refine diagnostic strategies and inform the development of personalized interventions, heralding a new era in precision medicine and healthcare innovation. Through the integration of multi-omics approaches and advanced analytics, our study offers a crucial framework for deciphering the intricate molecular underpinnings of metabolic disorders and paving the way for transformative therapeutic strategies.

Keywords: data integration; metabolomics; obesity; proteomics; type 2 diabetes.


Conflict of interest statement

The authors declare no conflicts of interest.

Figures

Figure 1
Figure 1
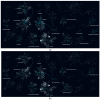
Differentially expressed proteins visualized as volcano plots where the x-axis represents log2 of the fold-change of protein expression, while the y-axis represents −log10 of the p-value after statistical analysis. (A) Differentially expressed proteins between control subjects and subjects with obesity; (B) Differentially expressed proteins between control subjects and subjects with type 2 diabetes (T2D); (C) Differentially expressed proteins between subjects with obesity and subjects with T2D.
Figure 2
Figure 2
Pathway-enrichment analysis in the case of differentially expressed proteins. (a) Pathways enriched with proteins altered between control subjects and subjects with type 2 diabetes (T2D); (b) Pathways enriched with proteins altered between control subjects and subjects with obesity; (c) Pathways enriched with proteins altered between subjects with obesity and subjects with T2D. The higher resolution images of the networks are presented in Figure S2.
Figure 2
Figure 2
Pathway-enrichment analysis in the case of differentially expressed proteins. (a) Pathways enriched with proteins altered between control subjects and subjects with type 2 diabetes (T2D); (b) Pathways enriched with proteins altered between control subjects and subjects with obesity; (c) Pathways enriched with proteins altered between subjects with obesity and subjects with T2D. The higher resolution images of the networks are presented in Figure S2.
Figure 3
Figure 3
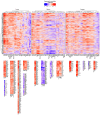
Correlation analysis. Spearman’s correlation coefficients were represented as a heatmap, followed by row and column clustering. Rows represent proteins, while columns represent either a clinical parameter, an amino acid, or a biogenic amine. Several clusters were highlighted under the heatmap.
Figure 4
Figure 4
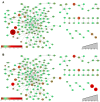
Network analysis of differentially expressed proteins. (A) Interaction network of proteins in comparison of protein expression between controls and subjects with obesity; (B) Interaction network of proteins in comparison of protein expression between controls and patients with type 2 diabetes (T2D). The size of the nodes is proportional to the obese/control or T2D/control NPX quotients. The green color indicates quotients close to 1, while the change of color toward dark brown and red indicates the deviation from the control group.

Similar articles

Cited by

References

    1. Kopelman P.G. Obesity as a Medical Problem. Nature. 2000;404:635–643. doi: 10.1038/35007508. - DOI - PubMed
    1. Stumvoll M., Goldstein B.J., Van Haeften T.W. Type 2 Diabetes: Principles of Pathogenesis and Therapy. Lancet. 2005;365:1333–1346. doi: 10.1016/S0140-6736(05)61032-X. - DOI - PubMed
    1. Guh D.P., Zhang W., Bansback N., Amarsi Z., Birmingham C.L., Anis A.H. The Incidence of Co-Morbidities Related to Obesity and Overweight: A Systematic Review and Meta-Analysis. BMC Public Health. 2009;9:88. doi: 10.1186/1471-2458-9-88. - DOI - PMC - PubMed
    1. Dettmer K., Aronov P.A., Hammock B.D. Mass Spectrometry-based Metabolomics. Mass Spectrom. Rev. 2007;26:51–78. doi: 10.1002/mas.20108. - DOI - PMC - PubMed
    1. Fiehn O. Metabolomics—The Link between Genotypes and Phenotypes. Plant Mol. Biol. 2002;48:155–171. doi: 10.1023/A:1013713905833. - DOI - PubMed