Review
. 2024 Apr 29;25(9):4860.
doi: 10.3390/ijms25094860.

Radiopharmaceuticals for Skeletal Muscle PET Imaging

Affiliations
Review

Radiopharmaceuticals for Skeletal Muscle PET Imaging

Joo Yeon Park et al. Int J Mol Sci. .

Abstract

The skeletal muscles account for approximately 40% of the body weight and are crucial in movement, nutrient absorption, and energy metabolism. Muscle loss and decline in function cause a decrease in the quality of life of patients and the elderly, leading to complications that require early diagnosis. Positron emission tomography/computed tomography (PET/CT) offers non-invasive, high-resolution visualization of tissues. It has emerged as a promising alternative to invasive diagnostic methods and is attracting attention as a tool for assessing muscle function and imaging muscle diseases. Effective imaging of muscle function and pathology relies on appropriate radiopharmaceuticals that target key aspects of muscle metabolism, such as glucose uptake, adenosine triphosphate (ATP) production, and the oxidation of fat and carbohydrates. In this review, we describe how [18F]fluoro-2-deoxy-D-glucose ([18F]FDG), [18F]fluorocholine ([18F]FCH), [11C]acetate, and [15O]water ([15O]H2O) are suitable radiopharmaceuticals for diagnostic imaging of skeletal muscles.

Keywords: positron emission tomography; radiopharmaceutical; skeletal muscle atrophy.


Conflict of interest statement

The authors declare no conflicts of interest. The funders had no role in the design, data collection, analyses, interpretation, writing of the manuscript, or the decision to publish the results.

Figures
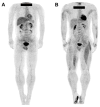
Figure 1
Figure 1
Representative images of whole-body positron emission tomography (PET) for the control (A) and baseball pitcher groups (B). Participants refrained from food and drink for a minimum of 6 h prior to the [18F]FDG PET evaluation and avoided intense physical activity for at least 1 day before the experiment. Prior to the injection of approximately 37 MBq of [18F]FDG, participants threw 40 baseballs, followed by 40 ball pinches. PET/CT images were obtained 50 min after injection, revealing a significant increase in glucose metabolism in the muscle groups within the utilized areas. Reproduced from [28], copyright © 2021, Journal of the International Society of Sports Nutrition.
Figure 2
Figure 2
Representative images of whole-body positron emission tomography (PET) from a hemiparetic participant. (A) The coronal PET image (middle) is captured 6 cm in front of the subject’s posterior, depicting minimal [18F]fluoro-2-deoxy-D-glucose ([18F]FDG) uptake in the muscles of the affected (right) lower limb and elevated [18F]FDG uptake in the muscles of the unaffected (left) lower limb. This image provides an anterior–posterior view. (B) PET image in the axial plane of the pelvis showing reduced [18F]FDG uptake in the gluteus minimus muscle of the affected (right) lower limb. This image provides an inferior–superior view. (C) Axial PET image of the thigh showing increased [18F]FDG uptake in the medial hamstring muscle of the unaffected (left) lower limb. (D) Axial PET image of the lower leg showing reduced [18F]FDG uptake in the muscles of the affected (right) lower limb. TA, tibialis anterior muscle; TP, tibialis posterior muscle. Reproduced from [31], copyright © 2015, The Tohoku Journal of Experimental Medicine.
Figure 3
Figure 3
Representative images of whole-body positron emission tomography (PET) from a healthy participant. These images illustrate the delineation of regions of interest (ROIs) within each lower leg muscle on PET scans. (A) PET image was taken 6 cm in front of the subject’s posterior, providing an anterior–posterior perspective. The marked line indicates the axial magnetic resonance image used to identify the muscle. (B) An axial PET image (right lower leg) is used to define the ROI for each muscle, providing an inferior-to-superior perspective. TA, tibialis anterior muscle; TP, tibialis posterior muscle. Reproduced from [31], copyright © 2015, The Tohoku Journal of Experimental Medicine.
Figure 4
Figure 4
Comparison of [18F]FCH uptake by hindlimb skeletal muscle of control rats (UN) and rats in which muscle atrophy was induced by starvation (ST). Muscle atrophy model rats exhibited significantly lower [18F]FCH uptake than that of the control group. Choline uptake in atrophic muscle tissues was assessed using PET/CT with [18F]FCH. The volume of interest (VOI; white arrows) indicates both hindlimbs. The graph indicates the SUVmean in the VOI of the control (UN, n = 6) and starvation groups (ST, n = 7). CT, computed tomography; PET, positron emission tomography; SUVmean, mean standardized uptake value; Reproduced from [13], copyright © 2022, Diagnostics.
Figure 5
Figure 5
PET/CT with [11C]acetate was conducted at three weeks (A) and three months (B) after right hip arthroplasty using the posterior “Kocher Langerhans” approach. The images depict the iliopsoas and obturator muscles, with the upper and lower rows displaying resting and after-exercise PET, respectively. In each row, from left to right, the images represent PET alone, PET/CT superposition, and low-dose CT alone. The notable surge in [11C]acetate uptake during exercise was similarly observed on the unaffected side of the body in the iliac, psoas, and internal obturator muscles. Conversely, on the operated side, these muscles (indicated by arrows) exhibited similar activity levels during rest and exercise at the 3-week mark. The postsurgical [11C]acetate PET hyperactivity extending into the external obturator muscle on the right side, directly related to the surgical approach, remained stable at rest and exercise. The iliopsoas and obturator muscles affected by surgery ((B), indicated by arrows) show almost complete recovery. [11C]acetate uptake from surgical sites increased with exercise, similar to [11C]acetate uptake from healthy body sites. CT, computed tomography; PET, positron emission tomography. Reproduced from [36], copyright © 2011 Molecular Imaging and Biology.

References

    1. Chen X., Ji Y., Liu R., Zhu X., Wang K., Yang X., Liu B., Gao Z., Huang Y., Shen Y., et al. Mitochondrial dysfunction: Roles in skeletal muscle atrophy. J. Transl. Med. 2023;21:503. doi: 10.1186/s12967-023-04369-z. - DOI - PMC - PubMed
    1. Galpin A.J., Raue U., Jemiolo B., Trappe T.A., Harber M.P., Minchev K., Trappe S. Human skeletal muscle fiber type specific protein content. Anal. Biochem. 2012;425:175–182. doi: 10.1016/j.ab.2012.03.018. - DOI - PMC - PubMed
    1. Hargreaves M., Spriet L.L. Exercise metabolism: Fuels for the fire. Cold Spring Harb. Perspect. Med. 2018;8:a029744. doi: 10.1101/cshperspect.a029744. - DOI - PMC - PubMed
    1. Chen K., Gao P., Li Z., Dai A., Yang M., Chen S., Su J., Deng Z., Li L. Forkhead Box O signaling pathway in skeletal muscle atrophy. Am. J. Pathol. 2022;192:1648–1657. doi: 10.1016/j.ajpath.2022.09.003. - DOI - PubMed
    1. Dhillon R.J.S., Hasni S. Pathogenesis and management of sarcopenia. Clin. Geriatr. Med. 2017;33:17–26. doi: 10.1016/j.cger.2016.08.002. - DOI - PMC - PubMed

MeSH terms

Substances

LinkOut - more resources