. 2024 Apr 30;25(9):4887.
doi: 10.3390/ijms25094887.

Tigecycline Opposes Bortezomib Effect on Myeloma Cells Decreasing Mitochondrial Reactive Oxygen Species Production

Affiliations

Tigecycline Opposes Bortezomib Effect on Myeloma Cells Decreasing Mitochondrial Reactive Oxygen Species Production

Carlos Ramos-Acosta et al. Int J Mol Sci. .

Abstract

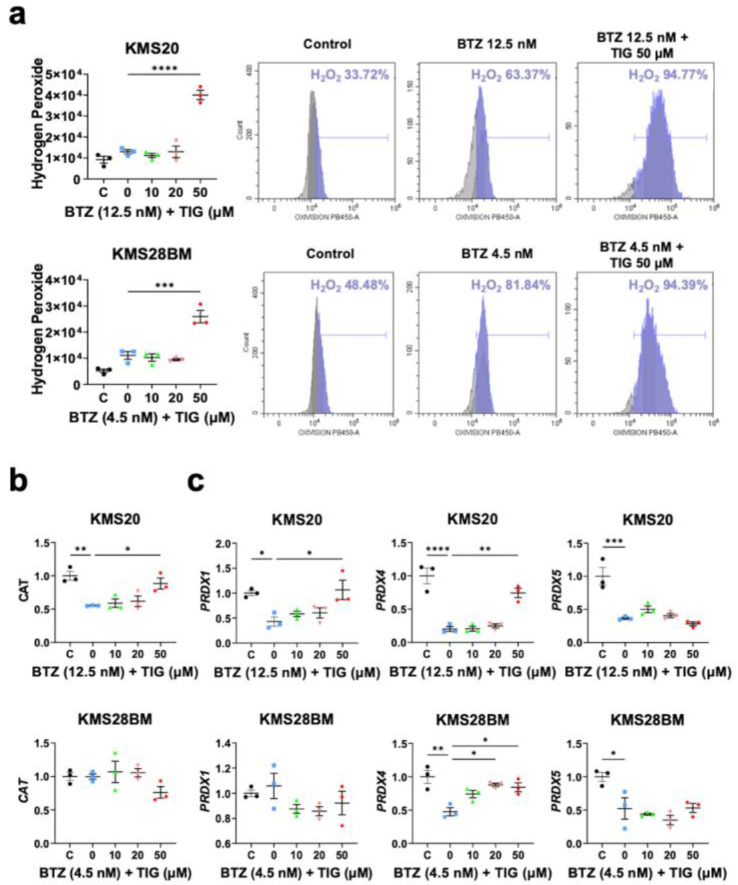
Multiple myeloma is an incurable plasma cell malignancy. Most patients end up relapsing and developing resistance to antineoplastic drugs, like bortezomib. Antibiotic tigecycline has activity against myeloma. This study analyzed tigecycline and bortezomib combination on cell lines and plasma cells from myeloma patients. Apoptosis, autophagic vesicles, mitochondrial mass, mitochondrial superoxide, cell cycle, and hydrogen peroxide were studied by flow cytometry. In addition, mitochondrial antioxidants and electron transport chain complexes were quantified by reverse transcription real-time PCR (RT-qPCR) or western blot. Cell metabolism and mitochondrial activity were characterized by Seahorse and RT-qPCR. We found that the addition of tigecycline to bortezomib reduces apoptosis in proportion to tigecycline concentration. Supporting this, the combination of both drugs counteracts bortezomib in vitro individual effects on the cell cycle, reduces autophagy and mitophagy markers, and reverts bortezomib-induced increase in mitochondrial superoxide. Changes in mitochondrial homeostasis and MYC upregulation may account for some of these findings. These data not only advise to avoid considering tigecycline and bortezomib combination for treating myeloma, but caution on the potential adverse impact of treating infections with this antibiotic in myeloma patients under bortezomib treatment.

Keywords: ROS; antagonism; bortezomib; cell cycle; multiple myeloma; tigecycline.


Conflict of interest statement

The authors declare no conflicts of interest. The funders had no role in the design of the study; in the collection, analyses, or interpretation of data; in the writing of the manuscript; or in the decision to publish the results.

Figures

Figure 1
Figure 1
BTZ and TIG individually decrease cell viability in KMS20 and KMS28BM cells in a dose- and time-dependent manner. (a) Graphical depiction of cell viability and early apoptosis analysis of KMS20 (top panels) and KMS28BM cells (bottom panels) treated with increasing concentrations of BTZ, as indicated, for 24 h (in blue) or 48 h (in red) and analyzed by flow cytometry. On the left panels, cell viability represented by annexin V (AV) and 7AAD double negative cells. On the right, early apoptosis, AV positive/7AAD negative cells. Three biologically independent experiments were performed for each assay (2 technical replicas of each), and they were analyzed by one-way ANOVA. In the viability study, data of control cells incubated with vehicle (0) were set to 100 and in the apoptosis analysis control were fixed to 0; the results of the other culture conditions are expressed in relation to control cells. Plots show means ± SEM. * p < 0.05, ** p < 0.01, *** p < 0.001, and **** p < 0.0001. (b) Calculation of the half maximal effective concentration (EC50) of bortezomib in KMS20 (left) and KM28BM (right) cell lines. Log: logarithm. EC50 for each cell line is indicated. (c) Cell viability and early apoptosis analysis of KMS20 (top panels) and KMS28BM cells (bottom panels) treated with increasing concentrations of TIG, as indicated, for 24 h (in blue) or 48 h (in red) and analyzed by flow cytometry (n = 3–2). Plots and analysis as in (a).
Figure 2
Figure 2
TIG and BTZ combination and BTZ treatment show opposed effects on cell death. (a) Cell viability and early apoptosis analysis of KMS20 cells studied by flow cytometry. On the left-hand side, plot of viable cells defined as annexin V (AV)/7AAD double-negative; control, C, is set to 100 and the results of the other culture conditions are expressed as a percentage of it (Y axis). On the right side, plot of early apoptotic cells displayed as annexin V-positive/7AAD-negative; results of the different conditions were compared to the control cells established as 0 (Y axis). In each experiment, cells were treated with their respective EC50 of BTZ only (0) or together with increasing TIG concentrations, as indicated on the X-axis. Control, C: vehicle (DMSO)-treated cells. Data for 24 h (in blue) and 48 h (in red) drug exposure are shown. Three biologically independent experiments were performed for each assay (2 technical replicas of each), and they were analyzed by one-way ANOVA comparing each drug concentration with BTZ single treatment data. Plots show means ± SEM. * p < 0.05, ** p < 0.01, and *** p < 0.001 (comparing BTZ single treatment with each BTZ plus TIG combination). (b) Plots of KMS28BM cell viability (left-hand side) and early apoptosis (right side) studies displayed and analyzed as in (a).
Figure 3
Figure 3
Apoptosis reduction produced by TIG plus BTZ combination versus BTZ single treatment correlates with mitochondrial mass decrease and associates to cell cycle changes. (a) Mitochondrial mass, assessed with MitoTracker Green staining and flow cytometry analysis. In each experiment, cells were treated with vehicle (DMSO), their respective EC50 of BTZ only (0), or BTZ EC50 together with increasing TIG concentrations, as indicated. On the left-hand side, plot of the analysis on KMS20 cells. Data of control, DMSO-treated cells (C) were fixed to 1 and the results of the different conditions referred to it. Data for 24 h (in blue) and 48 h (in red) drug exposure are shown. Three biologically independent experiments were performed for each assay (2 technical replicas of each), and they were analyzed by one-way ANOVA comparing each drug concentration with BTZ single treatment data. Plot shows means ± SEM. * p < 0.05, ** p < 0.01, and *** p < 0.001. On the right-hand side, plot of the study on KMS28BM cells performed and analyzed as before. (b) Cell cycle study of KMS20 cells by flow cytometry using APC BrdU Flow kit after 48 h of single drug treatment. Plots of data obtained from cells incubated with increasing concentrations of BTZ (left-hand side panel) and tigecycline (right-hand side panel) are shown. Control, C: vehicle (DMSO)-treated cells (black dots). Statistical analysis as before. Error bars indicate means ± SEM of three independent experiments. * p < 0.05, ** p < 0.01, and **** p < 0.0001. (c) Cell cycle study of BTZ and TIG combined treatment of KMS20 (left-hand side panel) and KMS28BM (right-hand side panel) cells studied by flow cytometry, analyzed and plotted as in (b). Error bars indicate means ± SEM of three independent experiments. * p < 0.05 and ** p < 0.01.
Figure 4
Figure 4
The addition of TIG to BTZ reverses BTZ-linked increased autophagy markers. (a) Left, plot of the mean fluorescence signal of monodansylcadaverine (MDC)-stained autophagic vacuoles (autophagosomes) assessed by flow cytometry of KMS20 cells treated with four different conditions: C, DMSO control; 0, BTZ EC50 (12.5 nM); 20, 12.5 nM BTZ plus 20 μM TIG; and 50, 12.5 nM BTZ with 50 μM TIG. Means ± SEM of 3 independent experiments after 24 h and 48 h drug incubation are shown in blue and red, respectively, * p < 0.05 (comparing BTZ single treatment with each BTZ plus TIG combination). Right, representative flow cytometry study, for simplicity only control (DMSO), BTZ EC50 (12.5 nM), and 12.5 nM BTZ plus 50 μM TIG after 48 h incubation are shown. A. C., autophagic cells (b) Levels of autophagy central protein LC3B analyzed by western blot. Left hand side, quantification of LC3B-II normalized with beta actin in KMS20 cells, after 48 h drug incubation as in (a) (n = 3). Western blot densitometry analysis was performed using ImageJ Fiji win64 software. Results are expressed using box and whiskers diagrams, where lines represent the median value, boxes the 25th and 75th percentiles, and whiskers mark maximum and minimum values, * p < 0.05. Right hand side, representative western blot showing LC3B (forms I and II, as indicated) and beta actin (β-ACTIN) control. MW: molecular weight marker from the same gel electrophoresis cut from its original loading position; C: DMSO (vehicle) control. (c) RNA expression of autophagy key genes MAP1LC3B, coding for LC3B, (left) and ULK1 (right) quantified by RT-qPCR in KMS20 cells after 48 h drug exposure as in (a). Levels were normalized with both TBP and RPL30 expression with similar results; for simplicity, only TBP normalized data are shown. Error bars indicate means ± SEM of three independent experiments, * p < 0.05, and ** p < 0.01. (d) RNA expression of mitophagy master genes PINK1 (left) and MFN2 (right). Analysis and plots as in (c).
Figure 4
Figure 4
The addition of TIG to BTZ reverses BTZ-linked increased autophagy markers. (a) Left, plot of the mean fluorescence signal of monodansylcadaverine (MDC)-stained autophagic vacuoles (autophagosomes) assessed by flow cytometry of KMS20 cells treated with four different conditions: C, DMSO control; 0, BTZ EC50 (12.5 nM); 20, 12.5 nM BTZ plus 20 μM TIG; and 50, 12.5 nM BTZ with 50 μM TIG. Means ± SEM of 3 independent experiments after 24 h and 48 h drug incubation are shown in blue and red, respectively, * p < 0.05 (comparing BTZ single treatment with each BTZ plus TIG combination). Right, representative flow cytometry study, for simplicity only control (DMSO), BTZ EC50 (12.5 nM), and 12.5 nM BTZ plus 50 μM TIG after 48 h incubation are shown. A. C., autophagic cells (b) Levels of autophagy central protein LC3B analyzed by western blot. Left hand side, quantification of LC3B-II normalized with beta actin in KMS20 cells, after 48 h drug incubation as in (a) (n = 3). Western blot densitometry analysis was performed using ImageJ Fiji win64 software. Results are expressed using box and whiskers diagrams, where lines represent the median value, boxes the 25th and 75th percentiles, and whiskers mark maximum and minimum values, * p < 0.05. Right hand side, representative western blot showing LC3B (forms I and II, as indicated) and beta actin (β-ACTIN) control. MW: molecular weight marker from the same gel electrophoresis cut from its original loading position; C: DMSO (vehicle) control. (c) RNA expression of autophagy key genes MAP1LC3B, coding for LC3B, (left) and ULK1 (right) quantified by RT-qPCR in KMS20 cells after 48 h drug exposure as in (a). Levels were normalized with both TBP and RPL30 expression with similar results; for simplicity, only TBP normalized data are shown. Error bars indicate means ± SEM of three independent experiments, * p < 0.05, and ** p < 0.01. (d) RNA expression of mitophagy master genes PINK1 (left) and MFN2 (right). Analysis and plots as in (c).
Figure 5
Figure 5
TIG reverses BTZ-dependent mitochondrial ROS increase without increased expression of superoxide antioxidants. (a) Analysis of superoxide production in mitochondria by MitoSOX Red flow cytometry assessment in KMS20 (left) and KMS28BM (right) cell lines. Cells were incubated with their EC50 of BTZ only (0) or with it plus increasing concentrations of TIG, as shown. C, control: vehicle-treated cells. Plots show means ± SEM of the data for 24 h (in blue) and 48 h (in red) culture in each condition. N = 3. * p < 0.05, ** p < 0.01, *** p < 0.001 and **** p < 0.0001. (b) SOD2 protein levels analyzed by western blot in KMS20 (top) and KMS28BM (bottom) cells after 48 h drug incubation as in (a). On the left panels, quantification of SOD2 levels normalized with beta actin, analysis using ImageJ Fiji win64 software (n = 3). Results are expressed using box and whiskers diagrams, where lines represent the median value, boxes the 25th and 75th percentiles, and whiskers mark maximum and minimum values; p values are shown. On the right, representative western blots for each cell line (KMS20 on the top and KMS28BM on the bottom) showing SOD2 and beta actin (β-ACTIN) control, as indicated. MW: molecular weight marker. C, control: vehicle-treated cells; 0, BTZ EC50 (12.5 nM); 20, 12.5 nM BTZ plus 20 μM TIG, and 50, 12.5 nM BTZ with 50 μM TIG. (ce) mRNA expression of genes encoding antioxidant proteins SOD1, NFE2L2, and G6PD, respectively, analyzed by RT-qPCR as in Figure 4c. KMS20 cells are shown in the top panels and studies on KMS28BM in the bottom ones. Culture conditions for 48 h drug exposure and statistical significance as in (a). Plots show means ± SEM of 3 independent experiments.
Figure 6
Figure 6
TIG plus BTZ treatment increases hydrogen peroxide and endoplasmic reticulum peroxiredoxin (PRDX4) expression in KMS20 and KMS28BM cells, while the expression of other H2O2 scavengers is variable, depending on the cell line, or decreases. (a) Hydrogen peroxide analysis by flow cytometry. On the left-hand side, plot representing the mean ± SEM of three experiments (two replicas of each) in KMS20 (top) and KMS28BM (bottom) after 24 h incubation with vehicle (control, C), BTZ EC50 (0) or BTZ EC50 plus the indicated concentration of TIG. *** p < 0.001 and **** p < 0.0001. On the right-hand side, representative flow cytometry analysis for each cell line. (b,c) mRNA expression of genes encoding H2O2 neutralizers analyzed by RT-qPCR as in Figure 4c. Culture conditions for 48 h drug exposure. Plots show means ± SEM of 3 independent experiments. * p < 0.05, ** p < 0.01, *** p < 0.001, and **** p < 0.0001. (b) Plots corresponding to CAT analysis; results of KMS20 cells are shown in the top panels and studies on KMS28BM in the bottom ones. (c) Peroxiredoxins studies (PRDX1, PRDX4, and PRDX5). Plots of data of KMS20 and KMS28BM cells are shown in the top and bottom panels, respectively.
Figure 7
Figure 7
TIG counteracts BTZ effect on gene expression of key regulators of mitochondrial function. (a) POLRMT, TFAM, and TFB1M mRNA expression, as indicated, quantified by RT-qPCR in KMS20 (top) and KMS28BM (bottom) cells after 48 h incubation with either DMSO vehicle (C), the EC50 of BTZ for each cell line (0), or BTZ EC50 plus increasing concentrations of TIG, as shown. Plot and analysis as in Figure 4c, TBP normalized data are shown, error bars indicate means ± SEM of 2–3 independent experiments, * p < 0.05, ** p < 0.01. (b) MYC expression of in KMS20 (top) and KMS28BM (bottom) analyzed and shown as in (a) (n = 3). (c) Basal oxygen consumption rate (OCR) study in KMS20 (top) and KMS28BM (bottom) cells incubated for 48 h with either vehicle (C); the EC50 of BTZ or EC50 of BTZ plus tigecycline at the concentration that induce significant apoptosis in combination with BTZ, as indicated. Plots show means ± SEM basal respiration (before addition of oligomycin) of 2–3 independent experiments, * p < 0.05 and **** p < 0.0001. (d) ATP5B mRNA quantification in KMS20 (top) and KMS28BM (bottom). Culture conditions, graphs, and analysis as in (a).
Figure 8
Figure 8
Evaluation of oxidative phosphorylation complexes in KMS20 cells shows a reduction under BTZ treatment. Western blot analysis of mitochondrial respiratory chain complexes, from complex I to complex V, in KMS20 cells (n = 4). (ae) Histograms displaying the protein/α-TUBULIN ratio upon quantification of band intensities from control (vehicle-treated cells, C) (n = 3–4), BTZ EC50 (0) (n = 3–4), BTZ EC 50 + 20 µM TIG (20) (n = 3–4), and BTZ + 50 µM TIG (50) (n = 4). Results are expressed using box and whiskers diagrams, where lines represent the median value, boxes the 25th and 75th percentiles, and whiskers mark maximum and minimum values. Significant p-values are shown above the boxes. (f) Representative western blot analysis of mitochondrial respiratory chain complexes, from complex I to complex V, in KMS20 cells (n = 4) (α-TUBULIN used as loading control). MW: molecular weight marker.
Figure 9
Figure 9
In primary human plasma cell neoplasms TIG-BTZ association partly counteracts BTZ caused viability reduction. Percentage of viable primary plasma cells defined as annexin V (AV) and 7ADD double-negative, CD38-positive cells. Control: AV-/7ADD-, CD38+ cells (blue bars), treated with DMSO vehicle without drugs for 48 h, was set to 100%. Viable CD38+ cells after culturing for 48h with either 12.5 nM bortezomib (BTZ) or BTZ plus 50 µM tigecycline (TIG) (green and pink bars, respectively); the means of two replicas were referred to control. The proportion of viable primary plasma cells was higher after incubating with TIG plus BTZ than after culturing with BTZ, with the exception of patient 3 at the time of progressing to MM (3′) 15 weeks after plasmacytoma diagnosis (3). The patient number corresponds to Table 1.
Figure 10
Figure 10
Summarized model of the effect of BTZ and TIG of MM cells. O2: superoxide.

References

    1. Kumar S.K., Rajkumar V., Kyle R.A., van Duin M., Sonneveld P., Mateos M.V., Gay F., Anderson K.C. Multiple myeloma. Nat. Rev. Dis. Primers. 2017;3:17046. doi: 10.1038/nrdp.2017.46. - DOI - PubMed
    1. Rajkumar S.V., Dimopoulos M.A., Palumbo A., Blade J., Merlini G., Mateos M.V., Kumar S., Hillengass J., Kastritis E., Richardson P., et al. International Myeloma Working Group updated criteria for the diagnosis of multiple myeloma. Lancet Oncol. 2014;15:e538–e548. doi: 10.1016/S1470-2045(14)70442-5. - DOI - PubMed
    1. Huang J., Chan S.C., Lok V., Zhang L., Lucero-Prisno D.E., 3rd, Xu W., Zheng Z.J., Elcarte E., Withers M., Wong M.C.S. The epidemiological landscape of multiple myeloma: A global cancer registry estimate of disease burden, risk factors, and temporal trends. Lancet Haematol. 2022;9:e670–e677. doi: 10.1016/S2352-3026(22)00165-X. - DOI - PubMed
    1. Siegel R.L., Giaquinto A.N., Jemal A. Cancer statistics, 2024. CA Cancer J. Clin. 2024;74:12–49. doi: 10.3322/caac.21820. - DOI - PubMed
    1. Li X., Wang Y., Li M., Wang H., Dong X. Metal Complexes or Chelators with ROS Regulation Capacity: Promising Candidates for Cancer Treatment. Molecules. 2021;27:148. doi: 10.3390/molecules27010148. - DOI - PMC - PubMed

MeSH terms