

Iron Supplementation Increases Tumor Burden and Alters Protein Expression in a Mouse Model of Human Intestinal Cancer
- PMID: 38732562
- PMCID: PMC11085868
- DOI: 10.3390/nu16091316
Iron Supplementation Increases Tumor Burden and Alters Protein Expression in a Mouse Model of Human Intestinal Cancer
Abstract
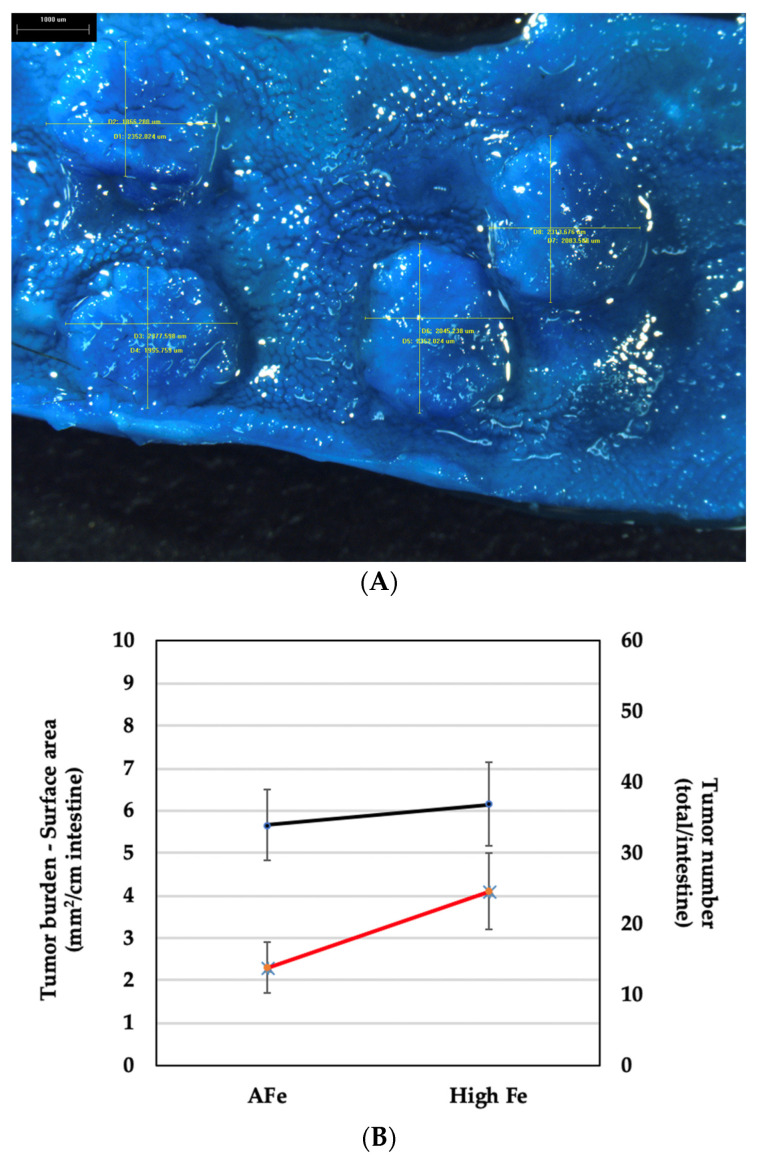
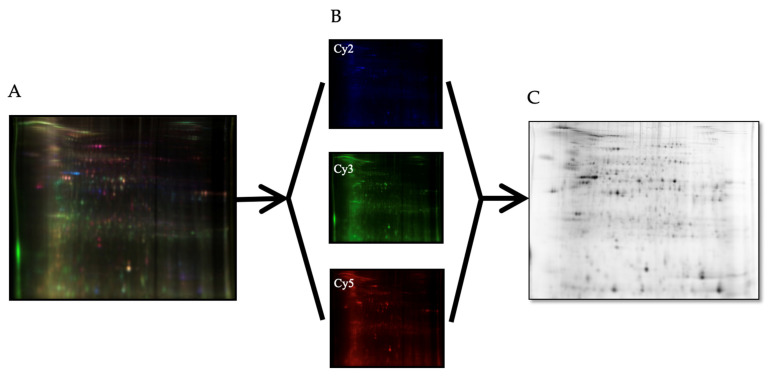
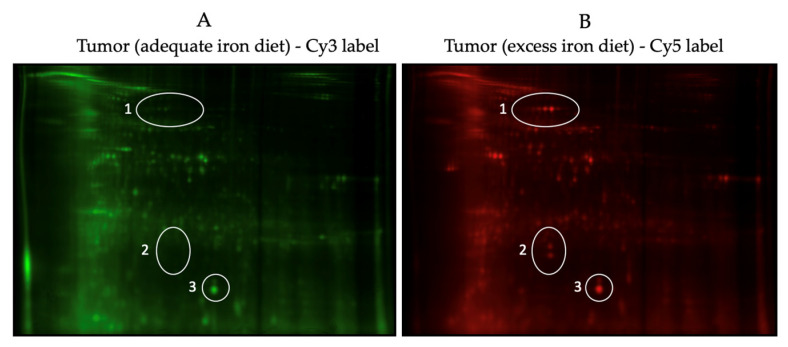
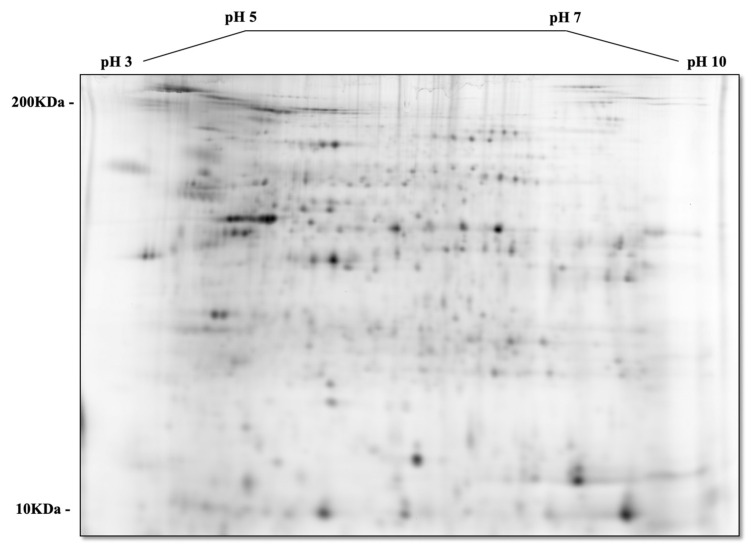
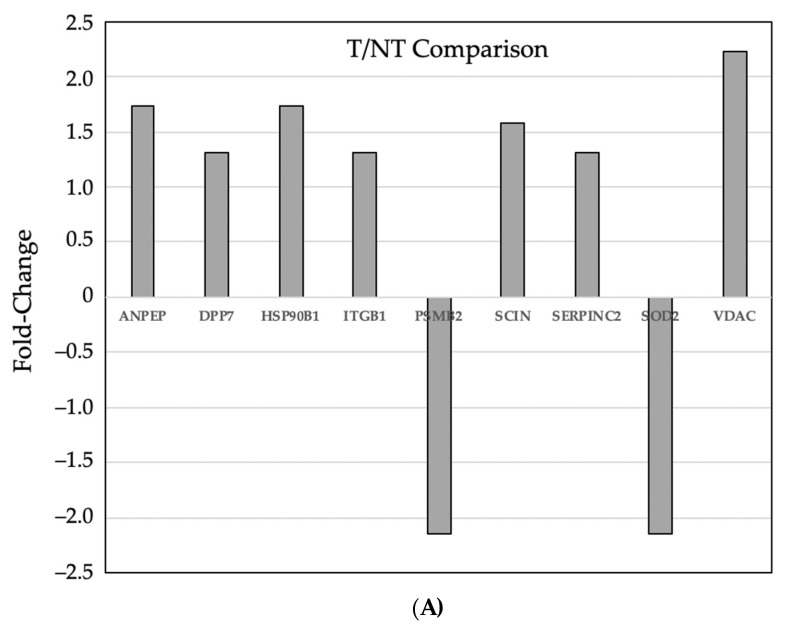
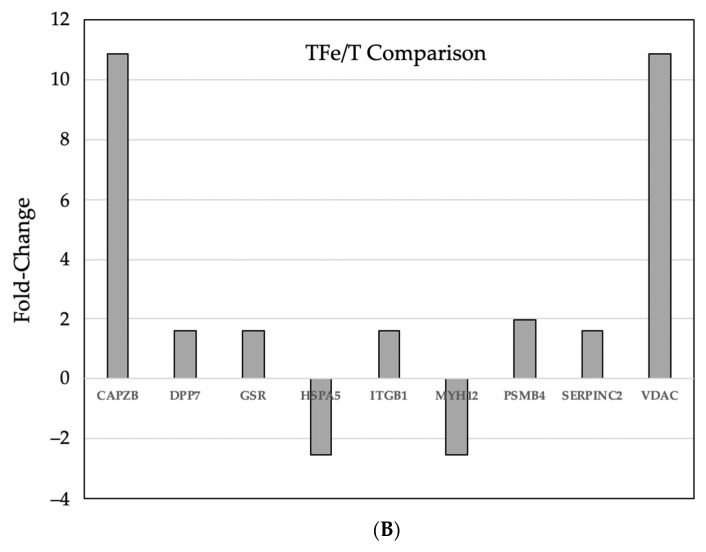
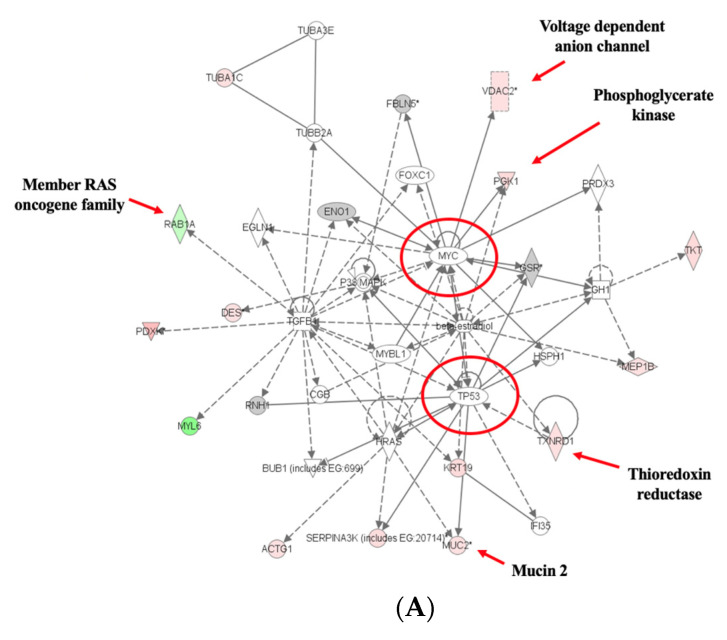
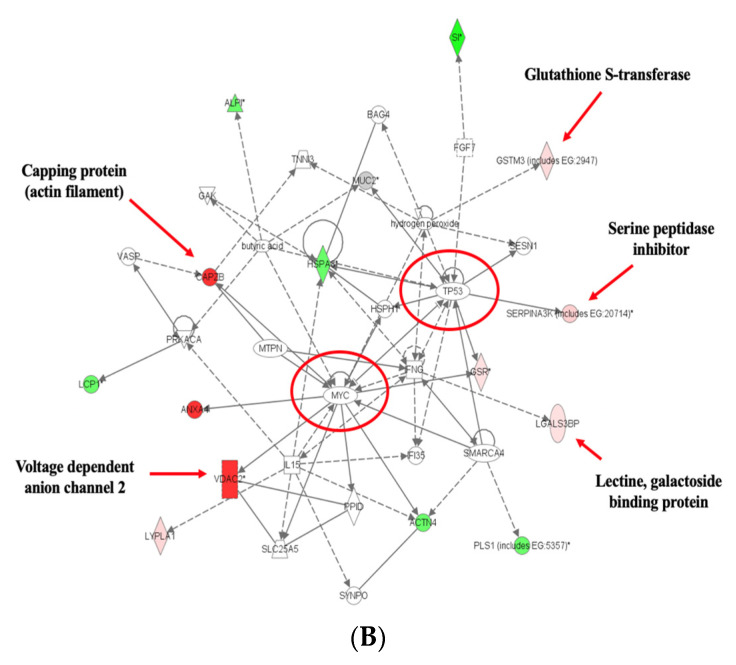
Iron supplements are widely consumed. However, excess iron may accelerate intestinal tumorigenesis. To determine the effect of excess iron on intestinal tumor burden and protein expression changes between tumor and normal tissues, ApcMin/+ mice were fed control (adequate) and excess iron (45 and 450 mg iron/kg diet, respectively; n = 9/group) for 10 wk. Tumor burden was measured, and two-dimensional fluorescence difference gel electrophoresis was used to identify differentially expressed proteins in tumor and normal intestinal tissues. There was a significant increase (78.3%; p ≤ 0.05) in intestinal tumor burden (mm2/cm) with excess iron at wk 10. Of 980 analyzed protein spots, 69 differentially expressed (p ≤ 0.05) protein isoforms were identified, representing 55 genes. Of the isoforms, 56 differed (p ≤ 0.05) between tumor vs. normal tissues from the adequate iron group and 23 differed (p ≤ 0.05) between tumors from the adequate vs. excess iron. Differentially expressed proteins include those involved in cell integrity and adaptive response to reactive oxygen species (including, by gene ID: ANPEP, DPP7, ITGB1, PSMA1 HSPA5). Biochemical pathway analysis found that iron supplementation modulated four highly significant (p ≤ 0.05) functional networks. These findings enhance our understanding of interplay between dietary iron and intestinal tumorigenesis and may help develop more specific dietary guidelines regarding trace element intake.
Keywords: intestinal cancer; iron supplementation; micronutrient; mouse model; protein expression; tumor.
Conflict of interest statement
The authors declare no conflicts of interest.
Figures
Similar articles
-
Cables1 is a tumor suppressor gene that regulates intestinal tumor progression in Apc(Min) mice.Cancer Biol Ther. 2013 Jul;14(7):672-8. doi: 10.4161/cbt.25089. Epub 2013 May 31. Cancer Biol Ther. 2013. PMID: 23792637 Free PMC article.
-
Stromal Indian hedgehog signaling is required for intestinal adenoma formation in mice.Gastroenterology. 2015 Jan;148(1):170-180.e6. doi: 10.1053/j.gastro.2014.10.006. Epub 2014 Oct 13. Gastroenterology. 2015. PMID: 25307863
-
Dietary Iron Deficiency and Oversupplementation Increase Intestinal Permeability, Ion Transport, and Inflammation in Pigs.J Nutr. 2016 Aug;146(8):1499-505. doi: 10.3945/jn.116.231621. Epub 2016 Jun 29. J Nutr. 2016. PMID: 27358414 Free PMC article.
-
Application of the Apc(Min/+) mouse model for studying inflammation-associated intestinal tumor.Biomed Pharmacother. 2015 Apr;71:216-21. doi: 10.1016/j.biopha.2015.02.023. Epub 2015 Feb 24. Biomed Pharmacother. 2015. PMID: 25960239 Review.
-
Mouse models of intestinal inflammation and cancer.Arch Toxicol. 2016 Sep;90(9):2109-2130. doi: 10.1007/s00204-016-1747-2. Epub 2016 Jun 16. Arch Toxicol. 2016. Retraction in: Arch Toxicol. 2018 Nov;92(11):3441. doi: 10.1007/s00204-018-2312-y. PMID: 27311821 Retracted. Review.
References
-
- Ems T., St Lucia K., Huecker M.R. StatPearls. StatPearls Publishing; Treasure Island, FL, USA: 2023. Biochemistry, Iron Absorption. - PubMed
MeSH terms
Substances
Grants and funding
LinkOut - more resources
Full Text Sources
Medical
Research Materials
Miscellaneous
