. 2024 May 1;16(9):1378.
doi: 10.3390/nu16091378.

The Impact of a Nutritional Intervention on Glycemic Control and Cardiovascular Risk Markers in Type 2 Diabetes

Affiliations

The Impact of a Nutritional Intervention on Glycemic Control and Cardiovascular Risk Markers in Type 2 Diabetes

Tatiana Palotta Minari et al. Nutrients. .

Abstract

Introduction: Nutritional management plays a crucial role in treating patients with type 2 diabetes (T2D), working to prevent and control the progression of chronic non-communicable diseases.

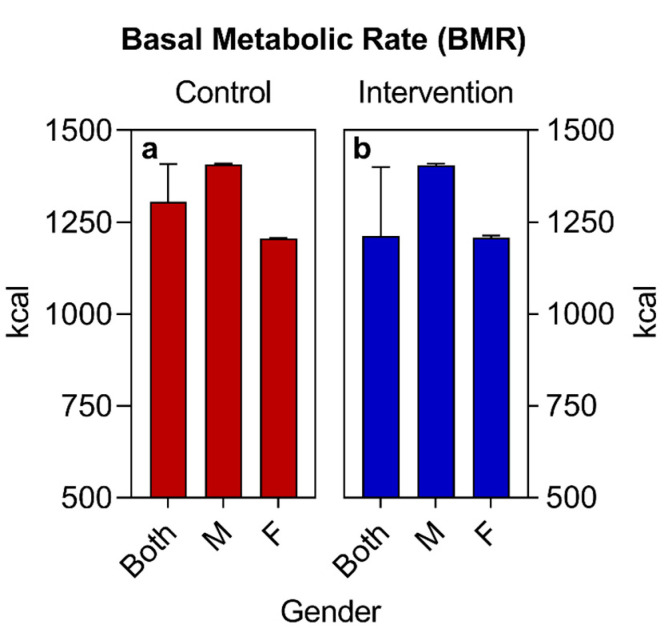
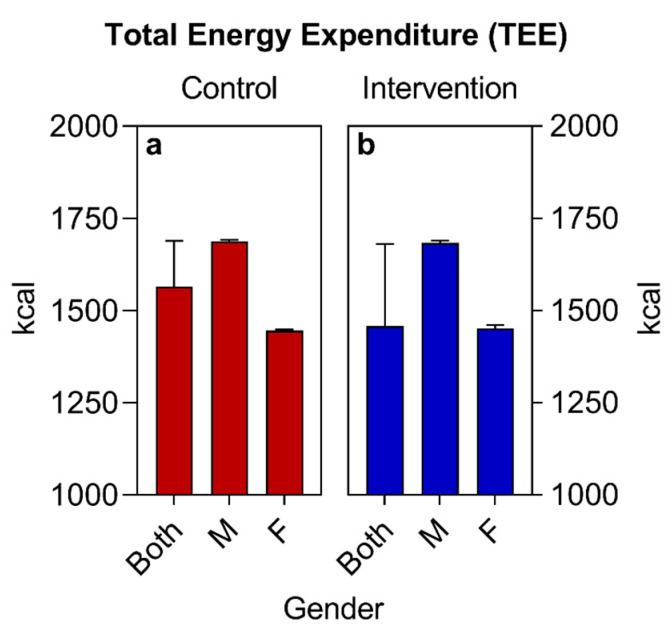
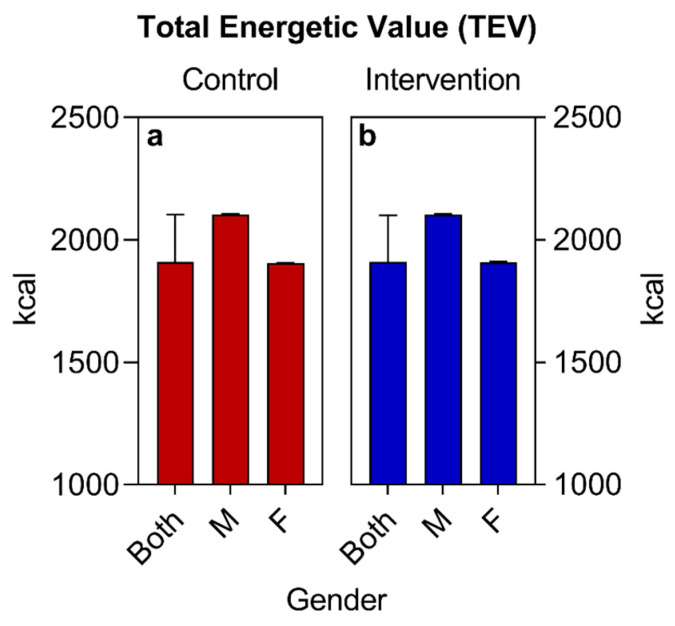
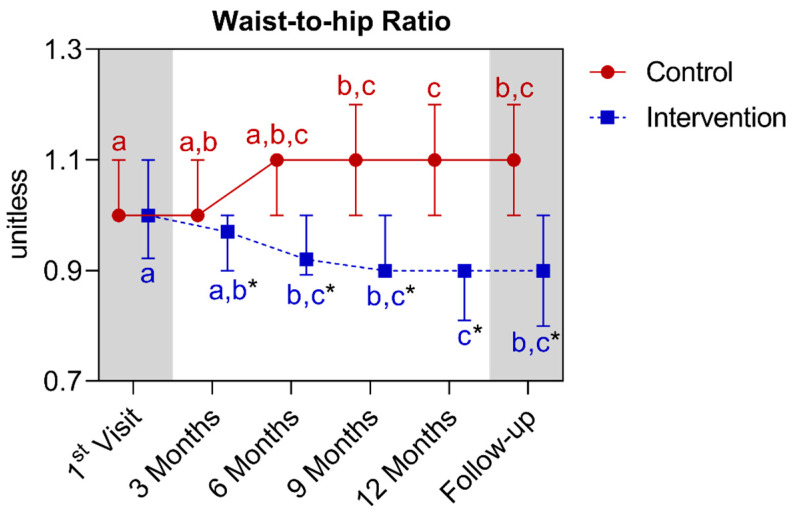
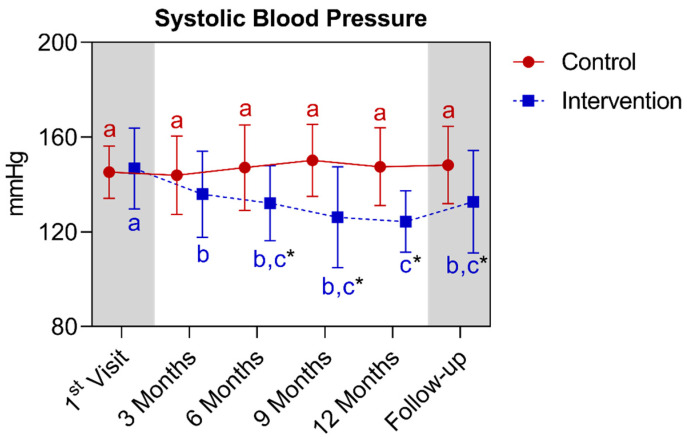
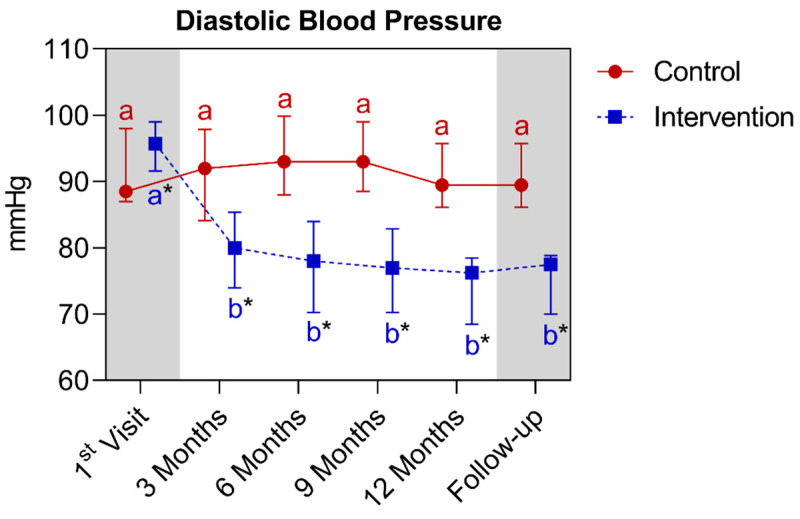
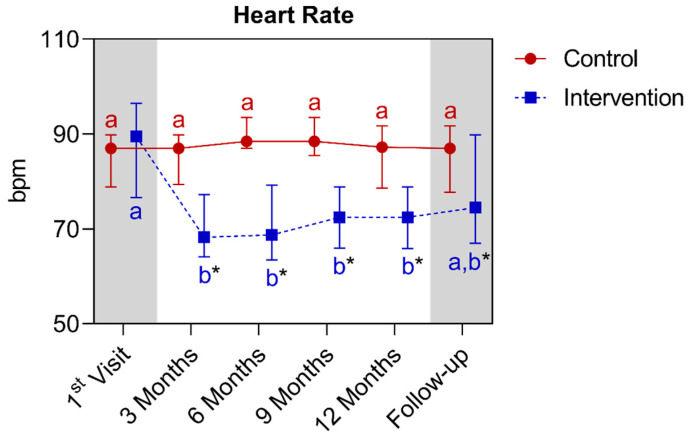
Objectives: To evaluate the effects of individualized nutritional interventions on weight, body mass index (BMI), waist circumference (WC), waist-to-hip ratio (WHR), fasting blood glucose (FBG), hemoglobin A1c (HbA1c), total cholesterol (TC), LDL cholesterol (LDL-C), HDL cholesterol (HDL-C), triglycerides (TGs), systolic blood pressure (SBP), diastolic blood pressure (DBP), and heart rate (HR)} over 12 months and subsequently at follow-up (15 months).

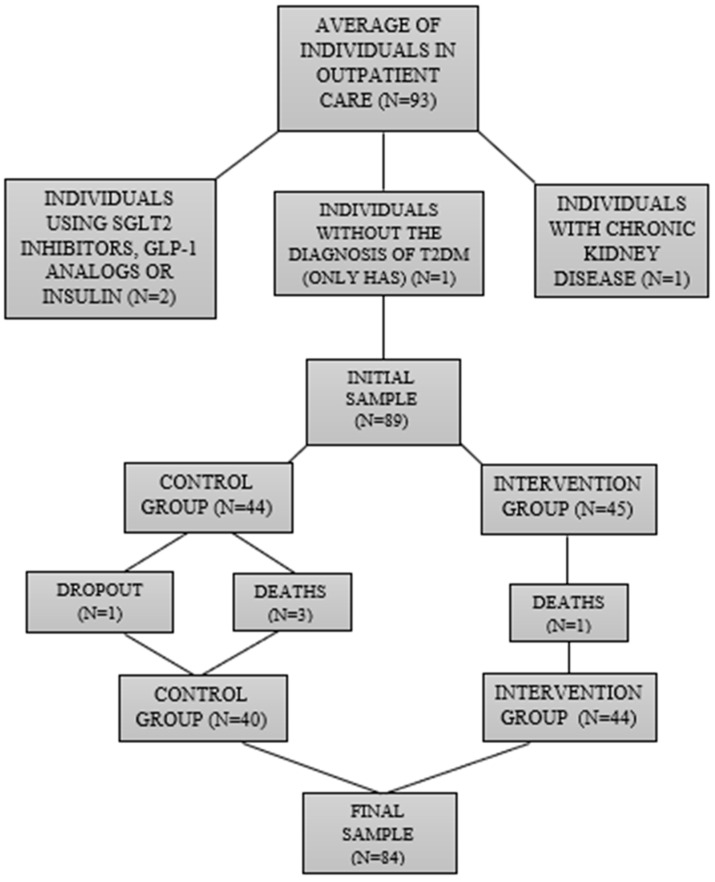
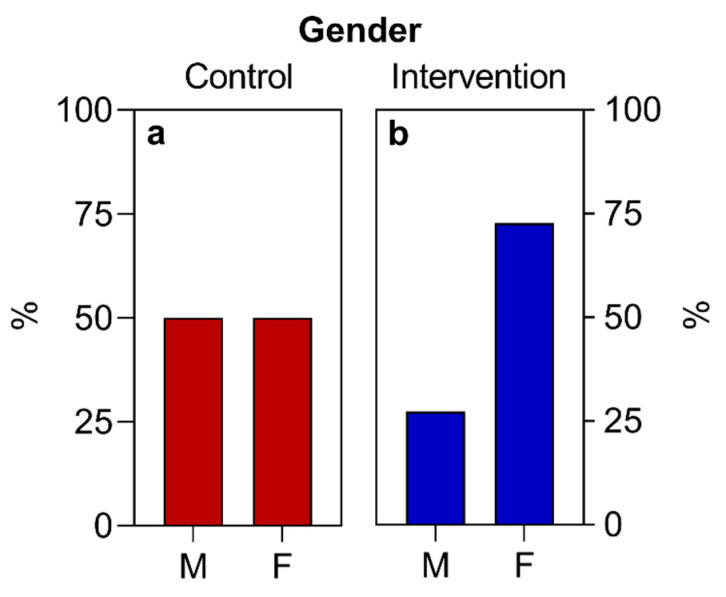
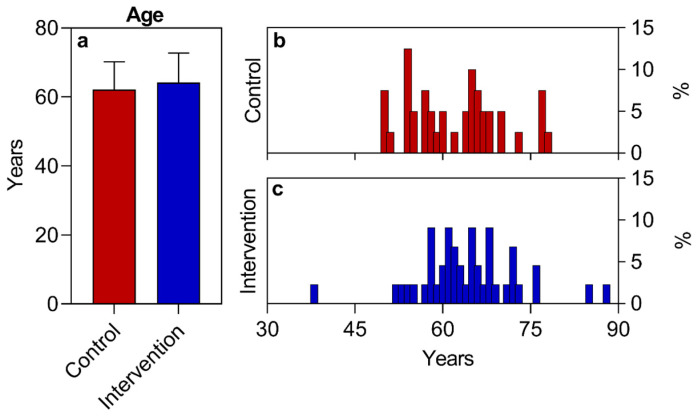
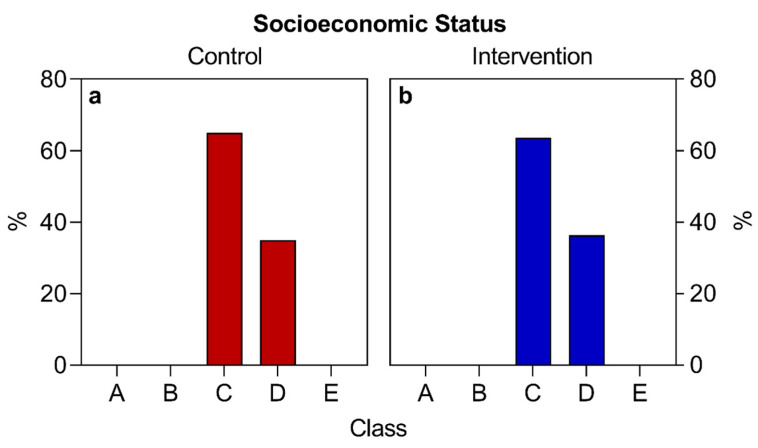
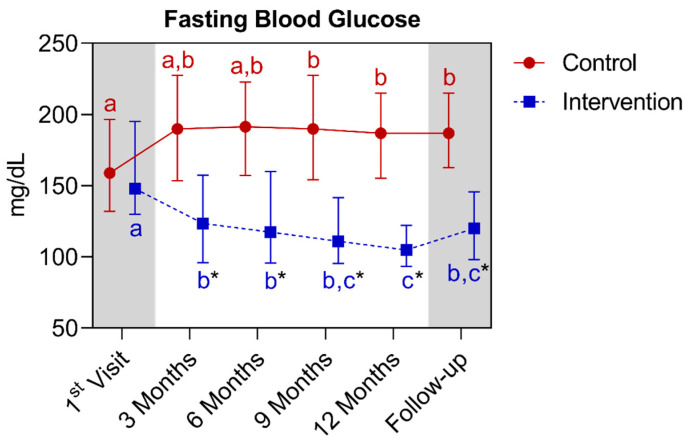
Methods: This longitudinal experimental study (without randomization and blinding) enrolled 84 sedentary participants with T2D (both sexes, aged 18-80 years). They were divided into a control group of 40 participants who received only medical consultations, and an intervention group of 44 participants who received the same medical care along with a nutritional assessment. Consultations occurred quarterly from August 2020 to November 2022 (first-twelfth month), with six to nine patients per session. Subsequently, a follow-up was conducted from December 2022 to November 2023, during which the intervention group had only medical care (during the 12th-15th months). Personalized dietary planning was inspired by the Mediterranean/DASH diets adapted to Brazilian foods and socioeconomic cultures.

Statistical analysis: Normal variables were compared between groups for each time point and also within each group across different time points using a two-way ANOVA (repeated measures for intragroup) followed by the Šídák post hoc test. Non-normal variables were compared between groups for each time point using Kruskal-Wallis followed by the Dunn post hoc test, and within each group across different time points using Friedman followed by the Dunn post hoc test. Data with a Gaussian distribution were presented as mean ± standard deviation (SD), and data with a non-Gaussian distribution were presented as median ± interquartile range (IQR). For all cases, α < 0.05 and p < 0.05 were adopted.

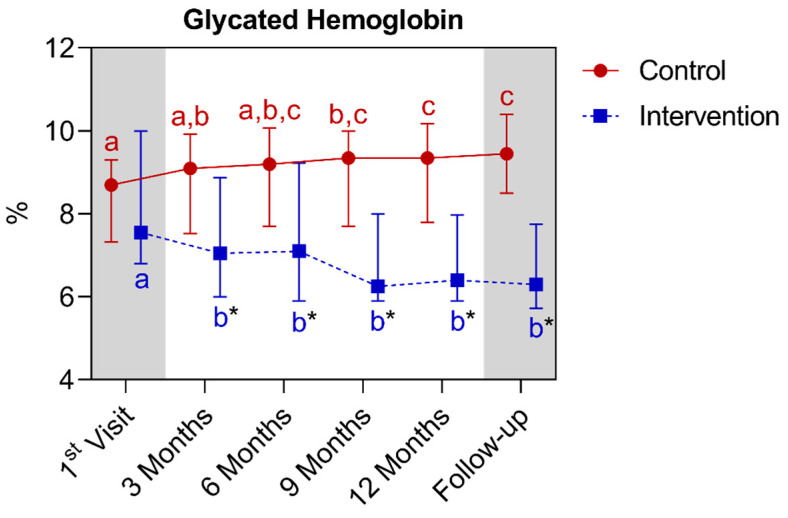
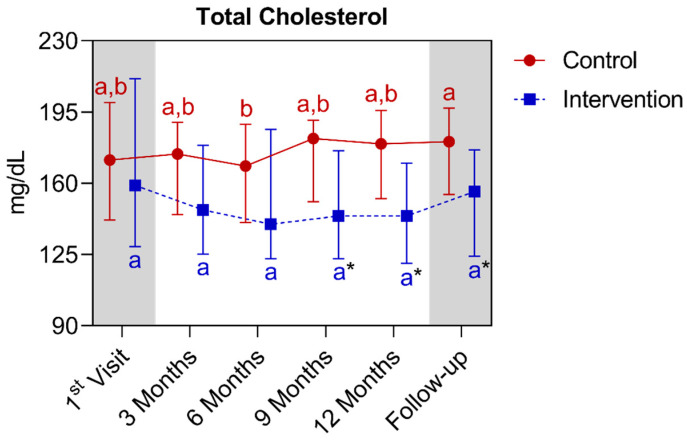
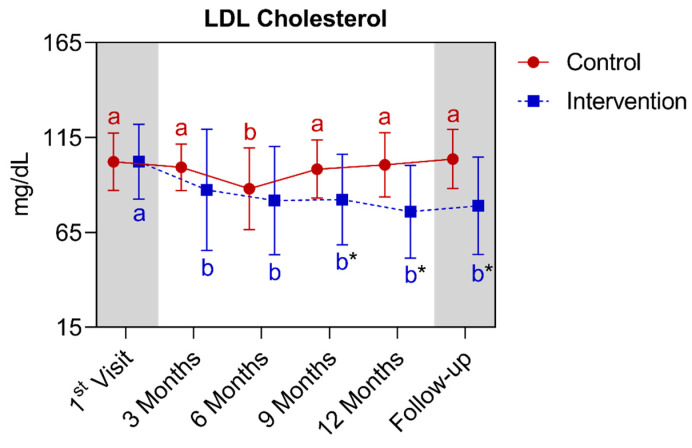
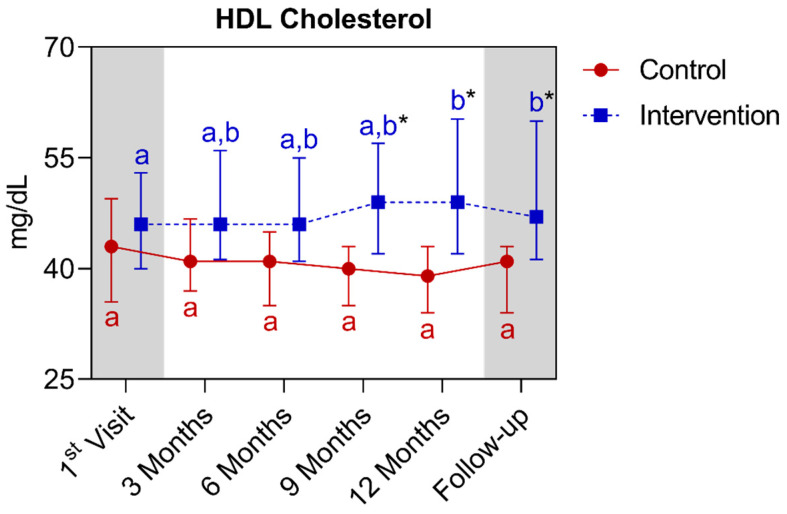
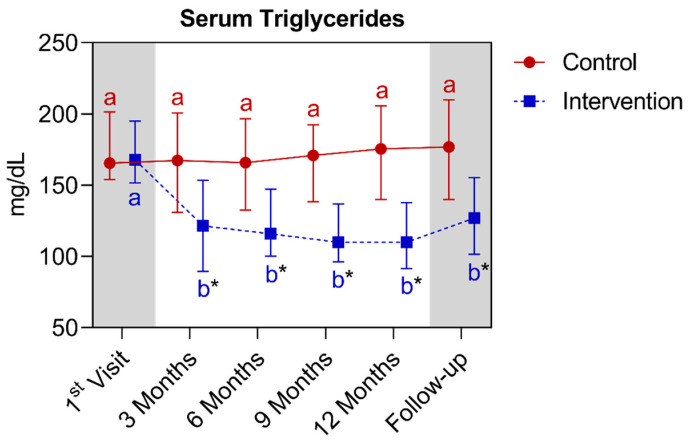
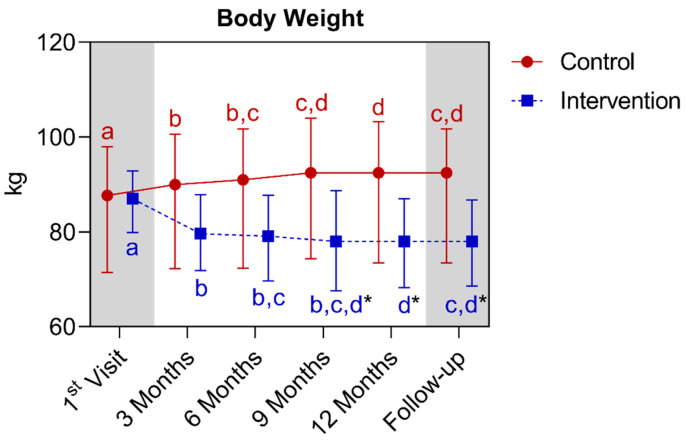
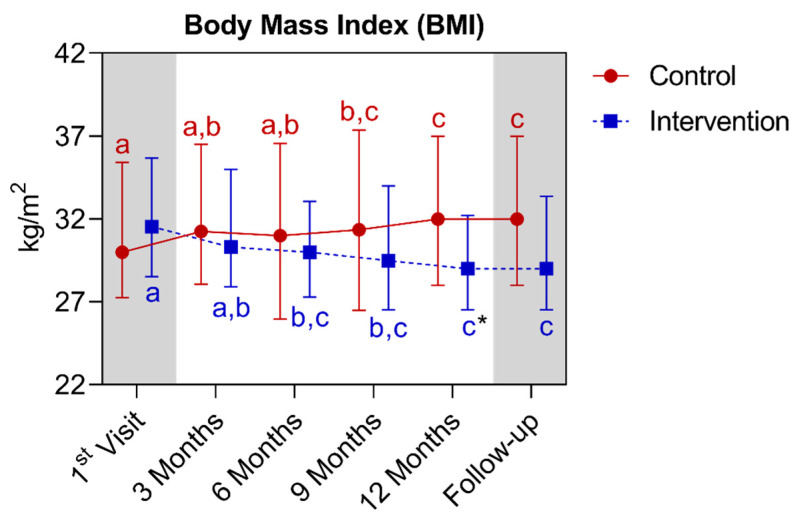
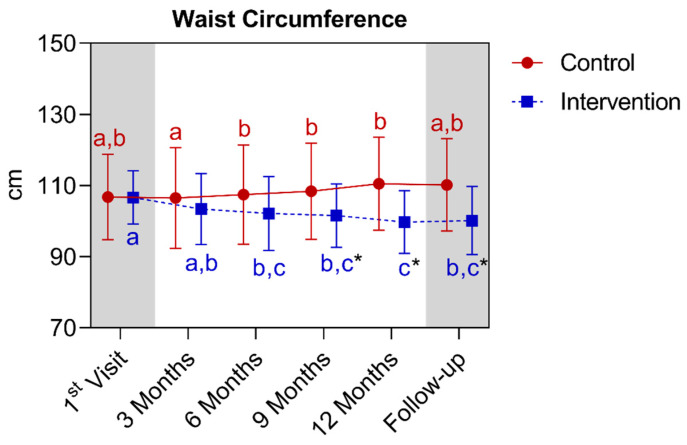
Results: In the intervention group, significant reductions were observed between the first and twelfth month for all parameters (p < 0.05), (except for TC), along with an increase in HDL-C (p = 0.0105). Conversely, in the control group, there was a significant increase in HbA1c, weight, BMI, FBG, and WHR (p < 0.05) between the first and twelfth months. Regarding the comparison between groups, there was a significant difference for all analyzed parameters (p < 0.05) from the first to the twelfth month. In the follow-up, differences were also observed (p < 0.05), except for BMI (p > 0.05).

Conclusion: The individualized nutritional intervention improved eating habits, anthropometric, biochemical, and cardiovascular markers in T2D over 12 months, with sustained results during follow-up. The dietary plan inspired by the Mediterranean and DASH diets demonstrated good adaptation to the Brazilian food culture and the patients' socioeconomic contexts. Consistent monitoring and personalized nutritional management are essential for optimizing long-term outcomes. However, more clinical trials are necessary in order to optimize the level of evidence for longitudinal interventions.

Keywords: DASH diet; HDL cholesterol; LDL cholesterol; Type 2 diabetes mellitus; blood glucose; blood pressure; cardiovascular risk markers; hemoglobin glycated; mediterranean diet; nutritional intervention; personalized nutrition; total cholesterol; triglycerides; weight.


Conflict of interest statement

The authors declare no conflicts of interest.

Figures

Figure 1
Figure 1
Flowchart of the Research participants sample selection.
Figure 2
Figure 2
Gender of study participants. Description of the percentage of participants by gender in the control (a) and intervention (b) groups. M: male; F: female.
Figure 3
Figure 3
Age of study participants. Summarization of age by study group (control or intervention) (a) and descriptive histogram of the percentage of participants by age in the control (b) and intervention (c) groups. Data are presented as mean ± standard deviation. There is no significant difference between the age values presented by the control and intervention groups (unpaired t-test; p > 0.05).
Figure 4
Figure 4
Socioeconomic status of study participants. Descriptive histogram of the percentage of participants by socioeconomic class in the control (a) and intervention (b) groups.
Figure 5
Figure 5
Basal metabolic rates (BMRs) of study participants. Summarization of BMRs for participants in the control (a) and intervention (b) groups. Data are presented as median ± interquartile range. There is no significant difference between the BMR values for both sexes presented by the control and intervention groups (Mann–Whitney test; p > 0.05).
Figure 6
Figure 6
Total energy expenditures (TEEs) of study participants. Summarization of the TEEs for participants in the control (a) and intervention (b) groups. Data are presented as median ± interquartile range. There is no significant difference between the TEE values for both sexes presented by the control and intervention groups (Mann–Whitney test; p > 0.05).
Figure 7
Figure 7
Total energetic values (TEVs) of study participants. Summarization of the TEVs for participants in the control (a) and intervention (b) groups. Data are presented as median ± interquartile range. There is no significant difference between the TEV values for both sexes presented by the control and intervention groups (Mann–Whitney test; p > 0.05).
Figure 8
Figure 8
The fasting blood glucose of participants in the control and intervention groups over the study period. Data are presented as median ± interquartile range. Within each group (same data line), values that do not share at least one superscript letter have a significant difference between them (Friedman test; Dunn’s post hoc test; p < 0.05). Within the same period, an asterisk indicates a significant difference between the values of each group (Kruskal–Wallis test; Dunn’s post hoc test; p < 0.05).
Figure 9
Figure 9
The percentage of glycated hemoglobin of participants in the control and intervention groups over the study period. Data are presented as median ± interquartile range. Within each group (same data line), values that do not share at least one superscript letter have a significant difference between them (Friedman test; Dunn’s post hoc test; p < 0.05). Within the same period, an asterisk indicates a significant difference between the values of each group (Kruskal–Wallis test; Dunn’s post hoc test; p < 0.05).
Figure 10
Figure 10
Total cholesterol of participants in the control and intervention groups over the study period. Data are presented as median ± interquartile range. Within each group (same data line), values that do not share at least one superscript letter have a significant difference between them (Friedman test; Dunn’s post hoc test; p < 0.05). Within the same period, an asterisk indicates a significant difference between the values of each group (Kruskal–Wallis test; Dunn’s post hoc test; p < 0.05).
Figure 11
Figure 11
The LDL cholesterol values of participants in the control and intervention groups over the study period. Data are presented as mean ± standard deviation. Within each group (same data line), values that do not share at least one superscript letter have a significant difference between them. Within the same period, an asterisk indicates a significant difference between the values of each group [two-way ANOVA (repeated measures for intragroup); Šídák’s post hoc test; p < 0.05].
Figure 12
Figure 12
The HDL cholesterol values of participants in the control and intervention groups over the study period. Data are presented as median ± interquartile range. Within each group (same data line), values that do not share at least one superscript letter have a significant difference between them (Friedman test; Dunn’s post hoc test; p < 0.05). Within the same period, an asterisk indicates a significant difference between the values of each group (Kruskal–Wallis test; Dunn’s post hoc test; p < 0.05).
Figure 13
Figure 13
The serum triglycerides of participants in the control and intervention groups over the study period. Data are presented as median ± interquartile range. Within each group (same data line), values that do not share at least one superscript letter have a significant difference between them (Friedman test; Dunn’s post hoc test; p < 0.05). Within the same period, an asterisk indicates a significant difference between the values of each group (Kruskal–Wallis test; Dunn’s post hoc test; p < 0.05).
Figure 14
Figure 14
The body weight values of participants in the control and intervention groups over the study period. Data are presented as median ± interquartile range. Within each group (same data line), values that do not share at least one superscript letter have a significant difference between them (Friedman test; Dunn’s post hoc test; p < 0.05). Within the same period, an asterisk indicates a significant difference between the values of each group (Kruskal–Wallis test; Dunn’s post hoc test; p < 0.05).
Figure 15
Figure 15
The BMIs of participants in the control and intervention groups over the study period. Data are presented as median ± interquartile range. Within each group (same data line), values that do not share at least one superscript letter have a significant difference between them (Friedman test; Dunn’s post hoc test; p < 0.05). Within the same period, an asterisk indicates a significant difference between the values of each group (Kruskal–Wallis test; Dunn’s post hoc test; p < 0.05).
Figure 16
Figure 16
The waist circumferences of participants in the control and intervention groups over the study period. Data are presented as mean ± standard deviation. Within each group (same data line), values that do not share at least one superscript letter have a significant difference between them. Within the same period, an asterisk indicates a significant difference between the values of each group [two-way ANOVA (repeated measures for intragroup); Šídák’s post hoc test; p < 0.05].
Figure 17
Figure 17
The waist-to-hip ratios of participants in the control and intervention groups over the study period. Data are presented as median ± interquartile range. Within each group (same data line), values that do not share at least one superscript letter have a significant difference between them (Friedman test; Dunn’s post hoc test; p < 0.05). Within the same period, an asterisk indicates a significant difference between the values of each group (Kruskal–Wallis test; Dunn’s post hoc test; p < 0.05).
Figure 18
Figure 18
The systolic blood pressure values of the participants in the control and intervention groups over the study period. Data are presented as mean ± standard deviation. Within each group (same data line), values that do not share at least one superscript letter have a significant difference between them. Within the same period, an asterisk indicates a significant difference between the values of each group [two-way ANOVA (repeated measures for intragroup); Šídák’s post hoc test; p < 0.05].
Figure 19
Figure 19
The diastolic blood pressure values of participants in the control and intervention groups over the study period. Data are presented as median ± interquartile range. Within each group (same data line), values that do not share at least one superscript letter have a significant difference between them (Friedman test; Dunn’s post hoc test; p < 0.05). Within the same period, an asterisk indicates a significant difference between the values of each group (Kruskal–Wallis test; Dunn’s post hoc test; p < 0.05).
Figure 20
Figure 20
The heart rate values of participants in the control and intervention groups over the study period. Data are presented as median ± interquartile range. Within each group (same data line), values that do not share at least one superscript letter have a significant difference between them (Friedman test; Dunn’s post hoc test; p < 0.05). Within the same period, an asterisk indicates a significant difference between the values of each group (Kruskal–Wallis test; Dunn’s post hoc test; p < 0.05).

References

    1. International Diabetes Federation . IDF Diabetes Atlas. 10th ed. International Diabetes Federation; Brussels, Belgium: 2021. [(accessed on 20 January 2022)]. Available online: http://www.diabetesatlas.org.
    1. ElSayed N.A., Aleppo G., Aroda V.R., Bannuru R.R., Brown F.M., Bruemmer D., Collins B.S., Hilliard M.E., Isaacs D., Johnson E.L., et al. 8. Association Obesity and Weight Management for the Prevention and Treatment of Type 2 Diabetes: Standards of Care in Diabetes-2023. Diabetes Care. 2023;46((Suppl. S1)):S128–S139. doi: 10.2337/dc23-S008. - DOI - PMC - PubMed
    1. Marx N., Federici M., Schütt K., Müller-Wieland D., Ajjan R.A., Antunes M.J., Christodorescu R.M., Crawford C., Di Angelantonio E., Eliasson B., et al. ESC Scientific Document Group. 2023 ESC Guidelines for the management of cardiovascular disease in patients with diabetes. Eur. Heart J. 2023;44:4043–4140. doi: 10.1093/eurheartj/ehad192. - DOI - PubMed
    1. World Health Organization (WHO) Fact Sheet: Obesity and Overweight. World Health Organization; Geneva, Switzerland: 2021. [(accessed on 20 November 2021)]. Available online: https://www.who.int/news-room/fact-sheets/detail/obesity-and-overweight.
    1. World Health Organization (WHO) Proposed Policy Priorities for Preventing Obesity and Diabetes in the Eastern Mediterranean Region. World Health Organization; Geneva, Switzerland: 2017. (Technical Report Series).

MeSH terms