. 2024 Apr 29;16(9):1244.
doi: 10.3390/polym16091244.

Adsorption and Structuration of PEG Thin Films: Influence of the Substrate Chemistry

Affiliations

Adsorption and Structuration of PEG Thin Films: Influence of the Substrate Chemistry

Maurice Brogly et al. Polymers (Basel). .

Abstract

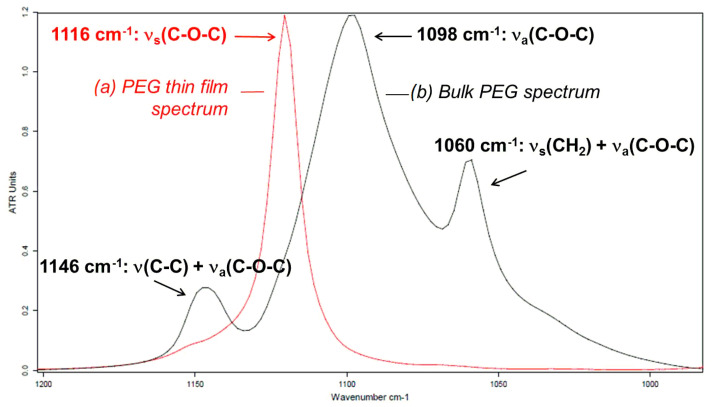
This study investigates polyethylene glycol (PEG) homopolymer thin film adsorption on gold surfaces of controlled surface chemistry. The conformational states of physisorbed PEG are analyzed through polarization modulation infrared reflection-absorption spectrometry (PM-IRRAS). The PM-IRRAS principle is based on specific optical selection rules allowing the detection of surface-specific FTIR response of thin polymer films on the basis of differential reflectivity at the polymer/substrate interface for p- and s-polarized light. The intensification of the electric field generated at the PEG/substrate interface for p-polarized IR light in comparison with s-polarized light permits the analysis of PEG chain anisotropy and conformational changes induced by the adsorption. Results showed that PEG adsorbs on model substrates having a rather hydrophilic character in a way that the PEG chains spread parallel to the surface. In the case of a very hydrophilic substrate, the adsorbed PEG chains are in a stable thermodynamic state which allows them to arrange and crystallize as stacked crystalline lamellae after adsorption. The surface topography and morphology of the PEG thin films were also investigated by atomic force microscopy (AFM). While in the bulk state, PEG crystallizes in the form of large spherulites; on substrates whose adsorption is favored by surface chemistry, PEG crystallizes in the form of stacked lamellae with a thickness equal to 20 nm. Conversely, on a hydrophobic substrate, the PEG chains do not crystallize and adsorption occurs in the statistical coil state.

Keywords: PM-IRRAS spectrometry; polyethylene glycol (PEG); structuration; surface chemistry; thin film.


Conflict of interest statement

The authors declare no conflicts of interest.

Figures

Figure 1
Figure 1
Formula of polyethylene glycol (PEG).
Figure 2
Figure 2
Hydrophobic (Au-CH3) and hydrophilic (Au-NH2) substrates obtained by chemical grafting of gold-coated glass substrates.
Figure 3
Figure 3
Scheme of the PM-IRRAS principle.
Figure 4
Figure 4
Infrared spectrum (ATR) of PEG in the 4000 to 700 cm−1 region.
Figure 5
Figure 5
Infrared spectrum (ATR) of PEG in the region (a) 3100 to 2600 cm−1, (b) 1500 to 1200 cm−1 and (c) 1200 to 800 cm−1.
Figure 6
Figure 6
AFM pictures of the deflection signal in contact mode (10 µm × 10 µm) for (a) Au-NH2 substrate, (b) Au substrate and (c) Au-CH3 substrate.
Figure 7
Figure 7
Comparison of the infrared spectra of PEG thin film adsorbed on Au (PM-IRRAS) (red line) and bulk PEG (ATR) (black line) in the ν(C-O-C) region from 1000 to 1200 cm−1.
Figure 8
Figure 8
AFM picture of the deflection signal in contact mode for PEG thin film spin-coated on Au substrate (90 µm × 90 µm).
Figure 9
Figure 9
Infrared spectrum of PEG thin film adsorbed on Au substrate (red line), Au-CH3 hydrophobic substrate (green line), and Au-NH2 hydrophilic substrate (blue line), in the 2600 to 3000 cm−1 ν(CH2) absorption zone.
Figure 10
Figure 10
Scheme of orientation angles for a vibration mode with an oscillating dipole (red arrow) ⊥ to the main chain axis. Reproduced from [19], with permission from Elsevier, 2024.
Figure 11
Figure 11
Comparison of the (a) thin film PM-IRRAS and (b) bulk ATR infrared spectra of PEG in the 3100 to 2600 cm−1 ν(CH2) absorption region.
Figure 12
Figure 12
Spectral decomposition of bulk PEG ATR spectrum in the 2600 to 3000 cm−1 region. FIT spectrum (black line) corresponds to the sum of individual contributed bands (red line + blue lines).
Figure 13
Figure 13
Infrared spectrum of PEG thin film adsorbed on a gold-coated substrate (Au) (red line), hydrophobic substrate (Au-CH3) (green line), and hydrophilic substrate (Au-NH2) (blue line) in the ν(C-O-C) spectral domain from 1000 to 1200 cm−1.
Figure 14
Figure 14
AFM pictures of the deflection signal in contact mode (10 µm × 10 µm) of PEG thin film adsorbed on (a) Au-NH2 hydrophilic substrate, (b) Au gold substrate and (c) Au-CH3 hydrophobic substrate.
Figure 15
Figure 15
3D AFM picture (20 µm × 20 µm) of the deflection signal in contact mode for PEG thin film spin-coated on the Au-NH2 hydrophilic substrate.

References

    1. Kim M.W. Surface activity and property of polyethyleneoxide (PEO) in water. Colloids Surf. A Physicochem. Eng. Asp. 1997;128:145–154. doi: 10.1016/S0927-7757(96)03918-0. - DOI
    1. Harris J.M., Chess R.B. Effect of pegylation on pharmaceuticals. Nat. Rev. Drug Discov. 2003;2:214–221. doi: 10.1038/nrd1033. - DOI - PubMed
    1. Pean J.M., Boury F., Venier-Julienne M.C., Menei P., Proust J.E., Benoit J.P. Why does PEG 400 co-encapsulation improve NGF stability and release from PLGA biodegradable microspheres? Pharm. Res. 1999;16:1294–1299. doi: 10.1023/A:1014818118224. - DOI - PubMed
    1. Albertsson P.A. Partition of Cell Particles and Macromolecules. 3rd ed. Wiley; New York, NY, USA: 1986.
    1. Kao K.N., Constable F., Michayluck M.R., Gamborg O.L. Plant protoplast fusion and growth of intergeneric hybrid cells. Planta. 1974;120:215–227. doi: 10.1007/BF00390290. - DOI - PubMed

LinkOut - more resources